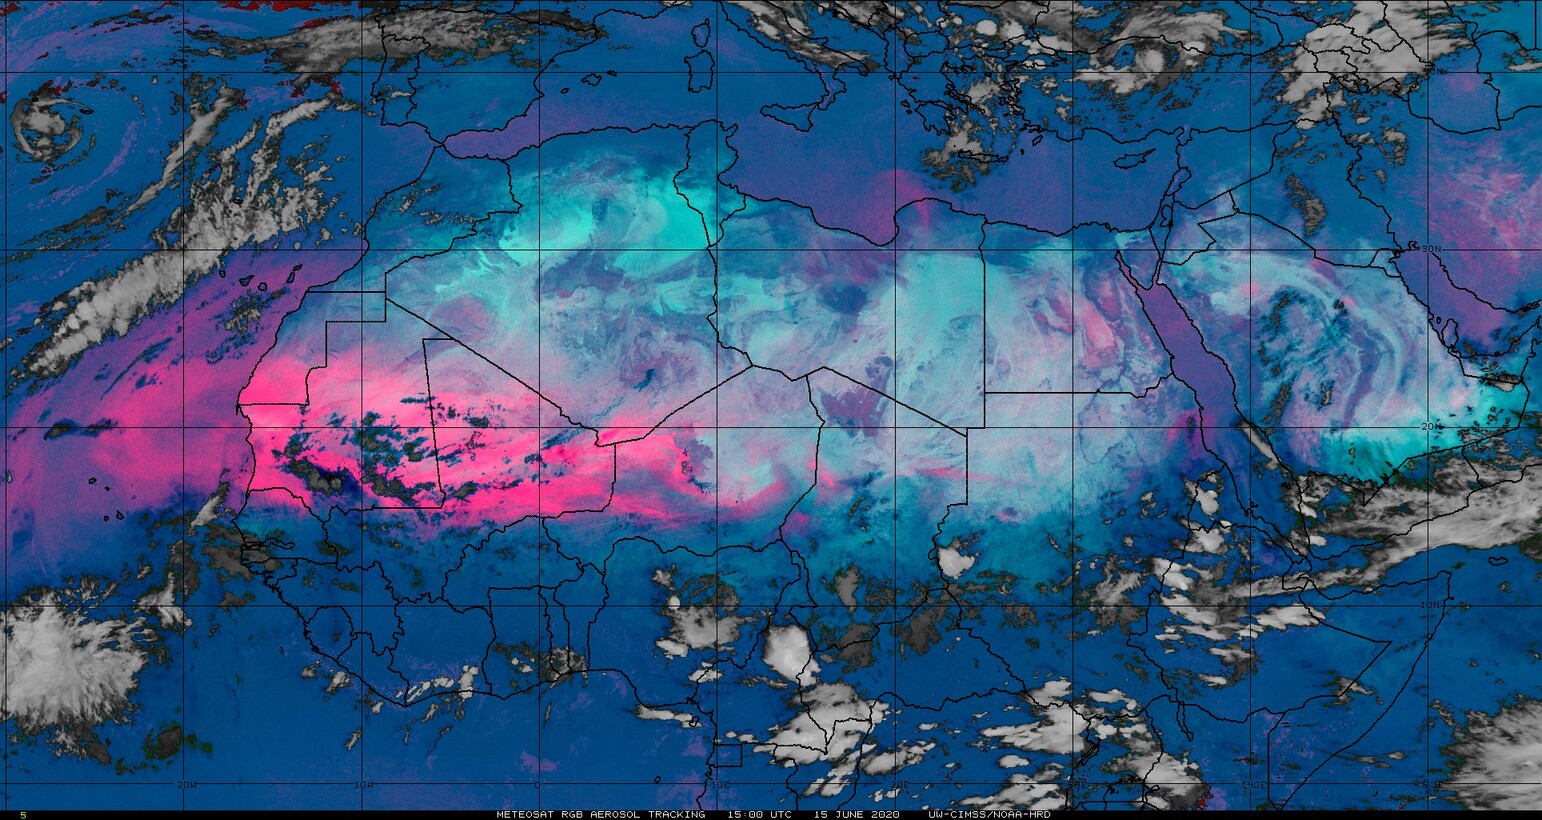
GOES-16 Split Window difference (SWD) fields, above, and Meteosat Dust RGB imagery (both from 1500 UTC on 15 June 2020, and available at this site) suggest that a Saharan Air Layer (SAL) event is developing in the eastern Atlantic Ocean. (Click here to see an animation of the Split Window Difference; AWIPS note: the... Read More

Color-enhanced GOES-16 Split Window Difference field, 1500 UTC on 15 June 2020 (Click to enlarge)
GOES-16 Split Window difference (SWD) fields, above, and Meteosat Dust RGB imagery (both from 1500 UTC on 15 June 2020, and available at this site) suggest that a Saharan Air Layer (SAL) event is developing in the eastern Atlantic Ocean. (Click here to see an animation of the Split Window Difference; AWIPS note: the default SWD enhancement has been replaced in the animation by the Grid/Low-Range Enhanced field) The dry, dusty air associated with SALs has an impact on air quality in the Caribbean, and it also suppresses tropical cyclone activity. What other satellite products can be used to track this feature?
The 4-panel images below includes GOES-16 Aerosol Detection (upper left), GOES-16 Dust RGB (upper right), GOES-16 Split-Window Difference (10.3 µm – 12.3 µm) (lower left), and gridded NOAA-Unique Combined Atmospheric Processing System (NUCAPS) 850-700 mb Relative Humidity at 1550 UTC`and 1600 UTC. GOES-16 Aerosol Detection can detect SAL layers because of the suspended dust in the atmosphere. Both the Dust RGB and Split Window difference fields detect the SAL because of the differential absorption of infrared radiation at 10.3 µm and 12.3 µm by silicates within the dust.
The bright pink in the Dust RGB is characteristic of dust detection with that product, and it shows a strong feature emerging from Africa. The Split Window difference (SWD) field shows the SAL region to be blue to brown; note that SAL air is indicated over the central Atlantic as well. The yellow/orange/red enhancement in the SWD (bracketed by blue regions in the enhancement that suggest dry air) between 30º and 40º W Longitude, and 10º and 20º N Latitude, suggests more moisture in the air there.
Aerosol Optical Depth is higher in the SAL air because of the suspended dust. Relatively cleaner air is north and south of the feature. The low-level Relative Humidity in the SAL air is low. This is more easily seen in the later image — 1600 UTC with this ascending NOAA-20 pass — than in the earlier (1550 UTC) image. (Click here to see a toggle of both gridded NUCAPS fields).
GOES-16 Aerosol Detection (upper left), GOES-16 Dust RGB (upper right), GOES-16 Split-Window Difference (10.3 µm – 12.3 µm) (lower left), and gridded NOAA-Unique Combined Atmospheric Processing System (NUCAPS) 850-700 mb Relative Humidity at 1550 UTC (Click to enlarge)
GOES-16 Aerosol Detection (upper left), GOES-16 Dust RGB (upper right), GOES-16 Split-Window Difference (10.3 µm – 12.3 µm) (lower left), and gridded NOAA-Unique Combined Atmospheric Processing System (NUCAPS) 850-700 mb Relative Humidity at 1600 UTC (Click to enlarge)
GOES-16 Aerosol Products, below, identify both the region of higher Aerosol Optical Depth (AOD), and the type of Aerosol (in this case: Dust) that is responsible for the higher AOD values.
GOES-16 Aerosol Optical Depth and GOES-16 Aerosol Type, 1600 UTC on 15 June 2020 (Click to enlarge)
The plot below shows the location of the NUCAPS points for the early afternoon swath in the eastern Atlantic. The points overlay the 850 mb – 700 mb relative humidity fields. Note the dryness at the eastern edge of the image, near 30º W; a skinny tongue of moisture (cyan in the moisture enhancement) extends to the north (corresponding to the region in the SWD where yellow/orange/red colors suggest more moisture), with dry air north and west of that moisture, near 45º W.
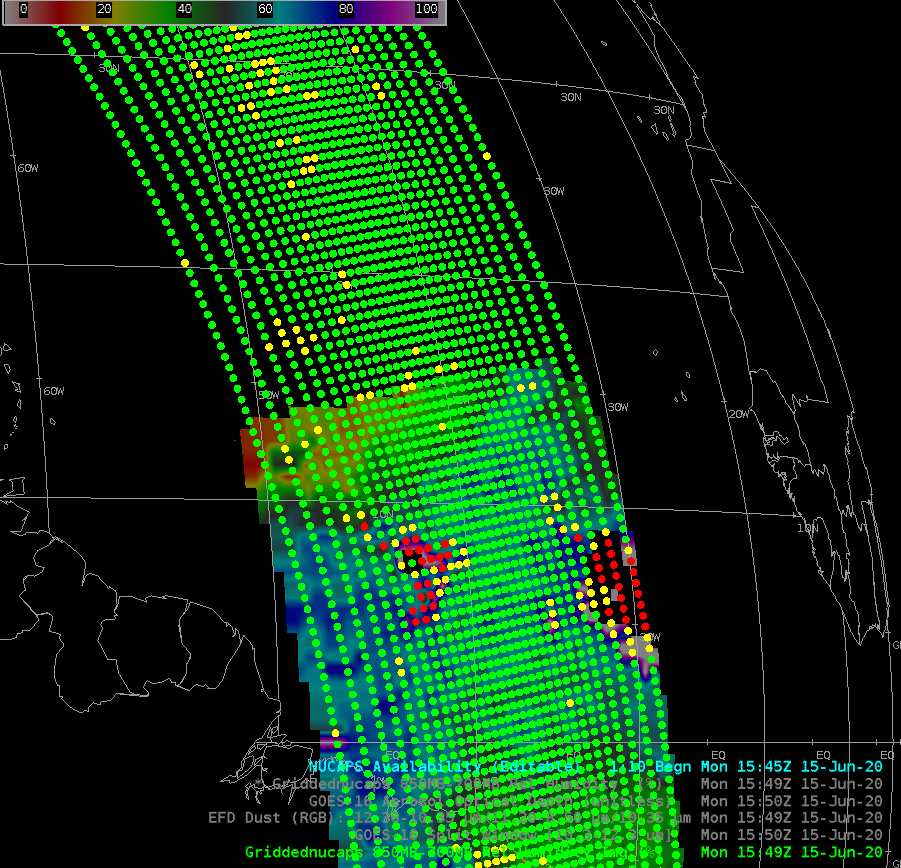
NUCAPS Sounding Locations overlain on top of Gridded NUCAPS field of 850 mb – 700 mb relative humidity (Click to enlarge)
The three soundings below show the dry air to the north and west (13º N, 42.5º W), the relative moisture in the middle (13.5º N, 36.5º W), and the dry air to the east (13.5º N, 31º W).
NUCAPS soundings at 1600 UTC in dry air, in the ribbon of moist air, and in dry air at the eastern edge of the NUCAPS swath.
True-color imagery (an example computed using CSPP-Geo is shown below from 1710 UTC) can also be used to track dust. Dust in true color has a much different presentation than adjacent clear(er) skies.
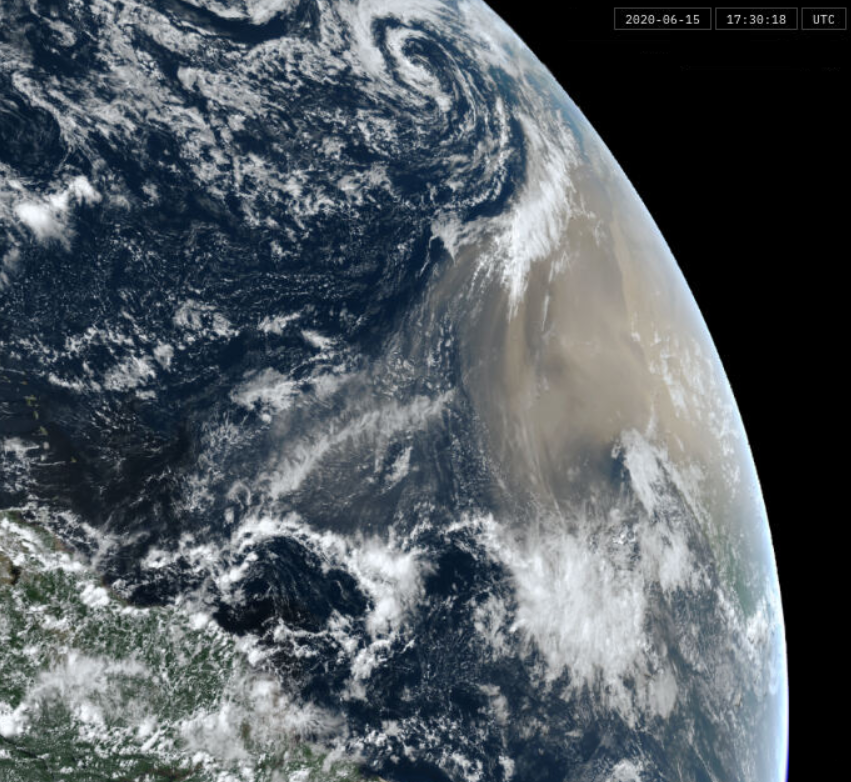
GOES-16 True Color imagery, 1730 UTC on 15 June 2020 (Click to enlarge)
View only this post
Read Less

![GOES-17 “Red” Visible (0.64 µm) and Shortwave Infrared (3.9 µm) images [click to play animation | MP4]](https://cimss.ssec.wisc.edu/satellite-blog/images/2020/06/200612_goes17_visible_shortwaveInfrared_Magnum_Fire_AZ_anim.gif)
![Suomi NPP VIIRS Fire Radiative Power product [click to enlarge]](https://cimss.ssec.wisc.edu/satellite-blog/images/2020/06/200612_2112utc_suomiNPP_fireRadiativePower_Magnum_Fire_AZ_anim.gif)
![GOES-17 “Red” Visible (0.64 µm) and Shortwave Infrared (3.9 µm) images [click to play animation | MP4]](https://cimss.ssec.wisc.edu/satellite-blog/images/2020/06/200613_goes17_visible_shortwaveInfrared_Magnum_Fire_AZ_anim.gif)
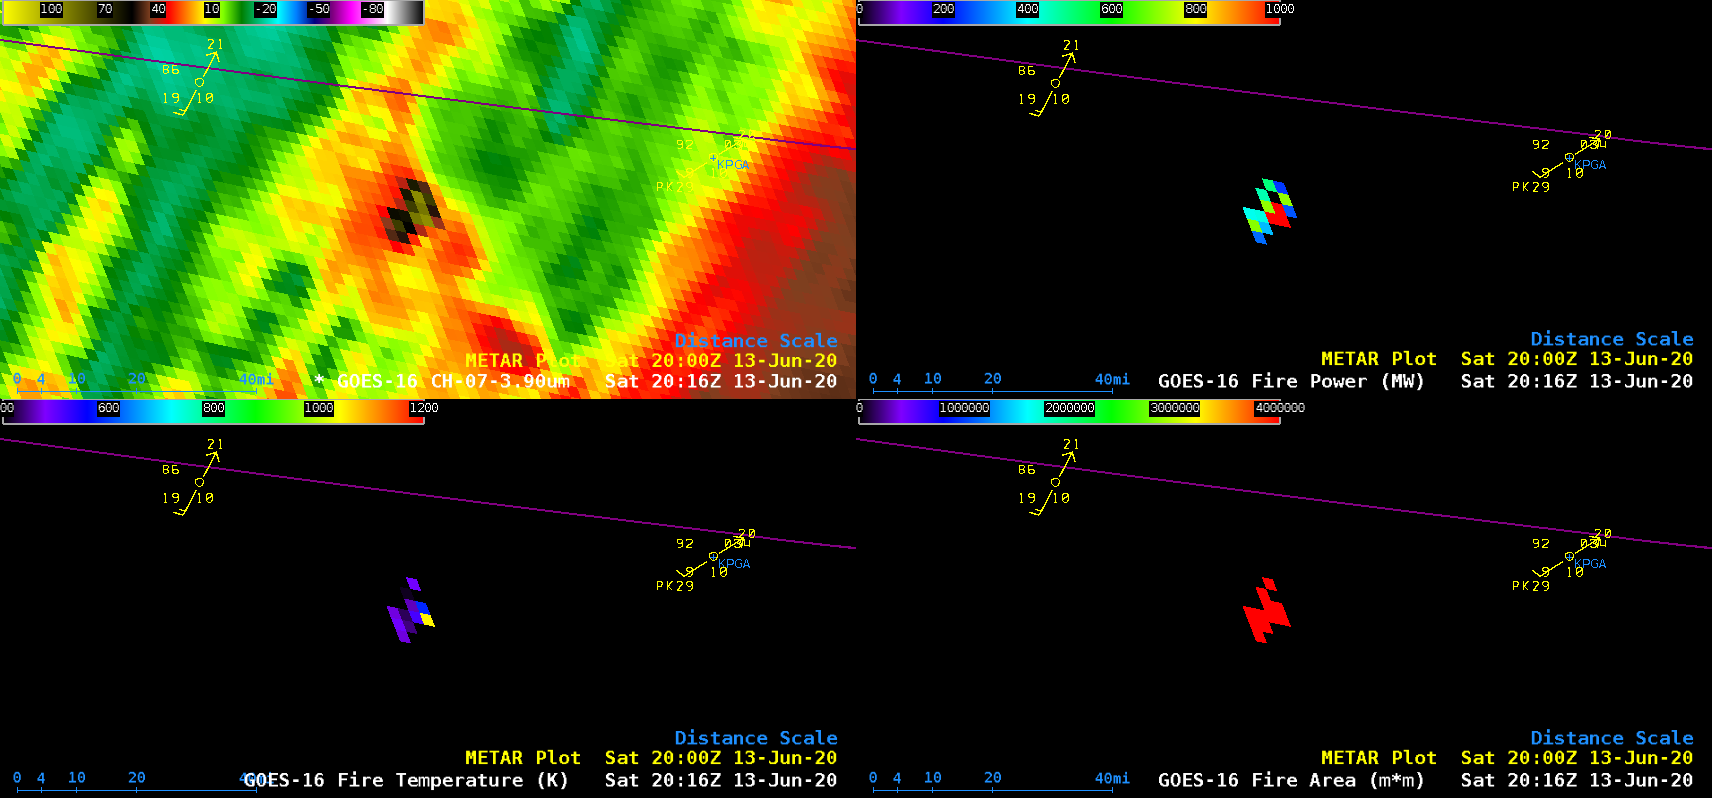
![GOES-16 Shortwave Infrared (3.9 µm), Fire Power, Fire Temperature and Fire Area [click to play animation | MP4]](https://cimss.ssec.wisc.edu/satellite-blog/images/2020/06/200613_goes16_shortwaveInfrared_firePower_fireTemperature_fireArea_Magnum_Fire_AZ_anim.gif)
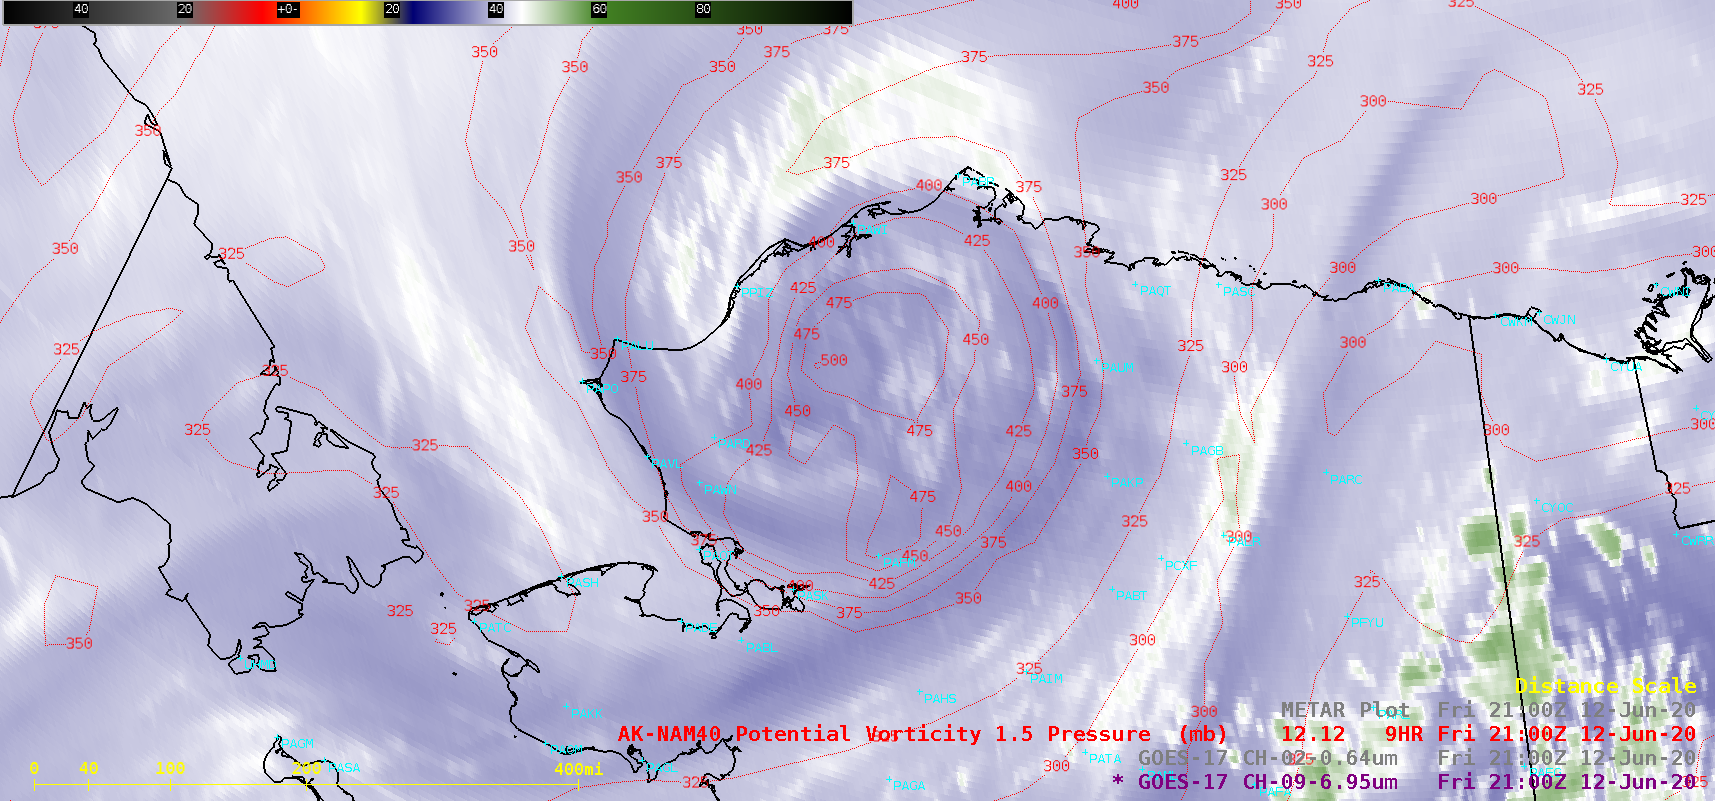
![GOES-17 Mid-level Water Vapor (6.9 µm) images, with contours of PV1.5 Pressure plotted in red [click to play animation | MP4]](https://cimss.ssec.wisc.edu/satellite-blog/images/2020/06/200612_goes17_waterVapor_pv1.5pressure_AK_anim.gif)
![GOES-17 Mid-level Water Vapor (6.9 µm) images, with contours of PV1.5 Pressure plotted in red and available NUCAPS sounding profiles denoted by green/yellow points [click to enlarge]](https://cimss.ssec.wisc.edu/satellite-blog/images/2020/06/ak_wv_nucaps-20200612_215031.png)
![NUCAPS sounding profile [click to enlarge]](https://cimss.ssec.wisc.edu/satellite-blog/images/2020/06/200612_22utc_nucaps_profile_AK.png)
![GOES-17 "Red" Visible (0.64 µm) images, with hourly surface reports plotted in red [click to play animation | MP4]](https://cimss.ssec.wisc.edu/satellite-blog/images/2020/06/200612_goes17_visible_AK_anim.gif)
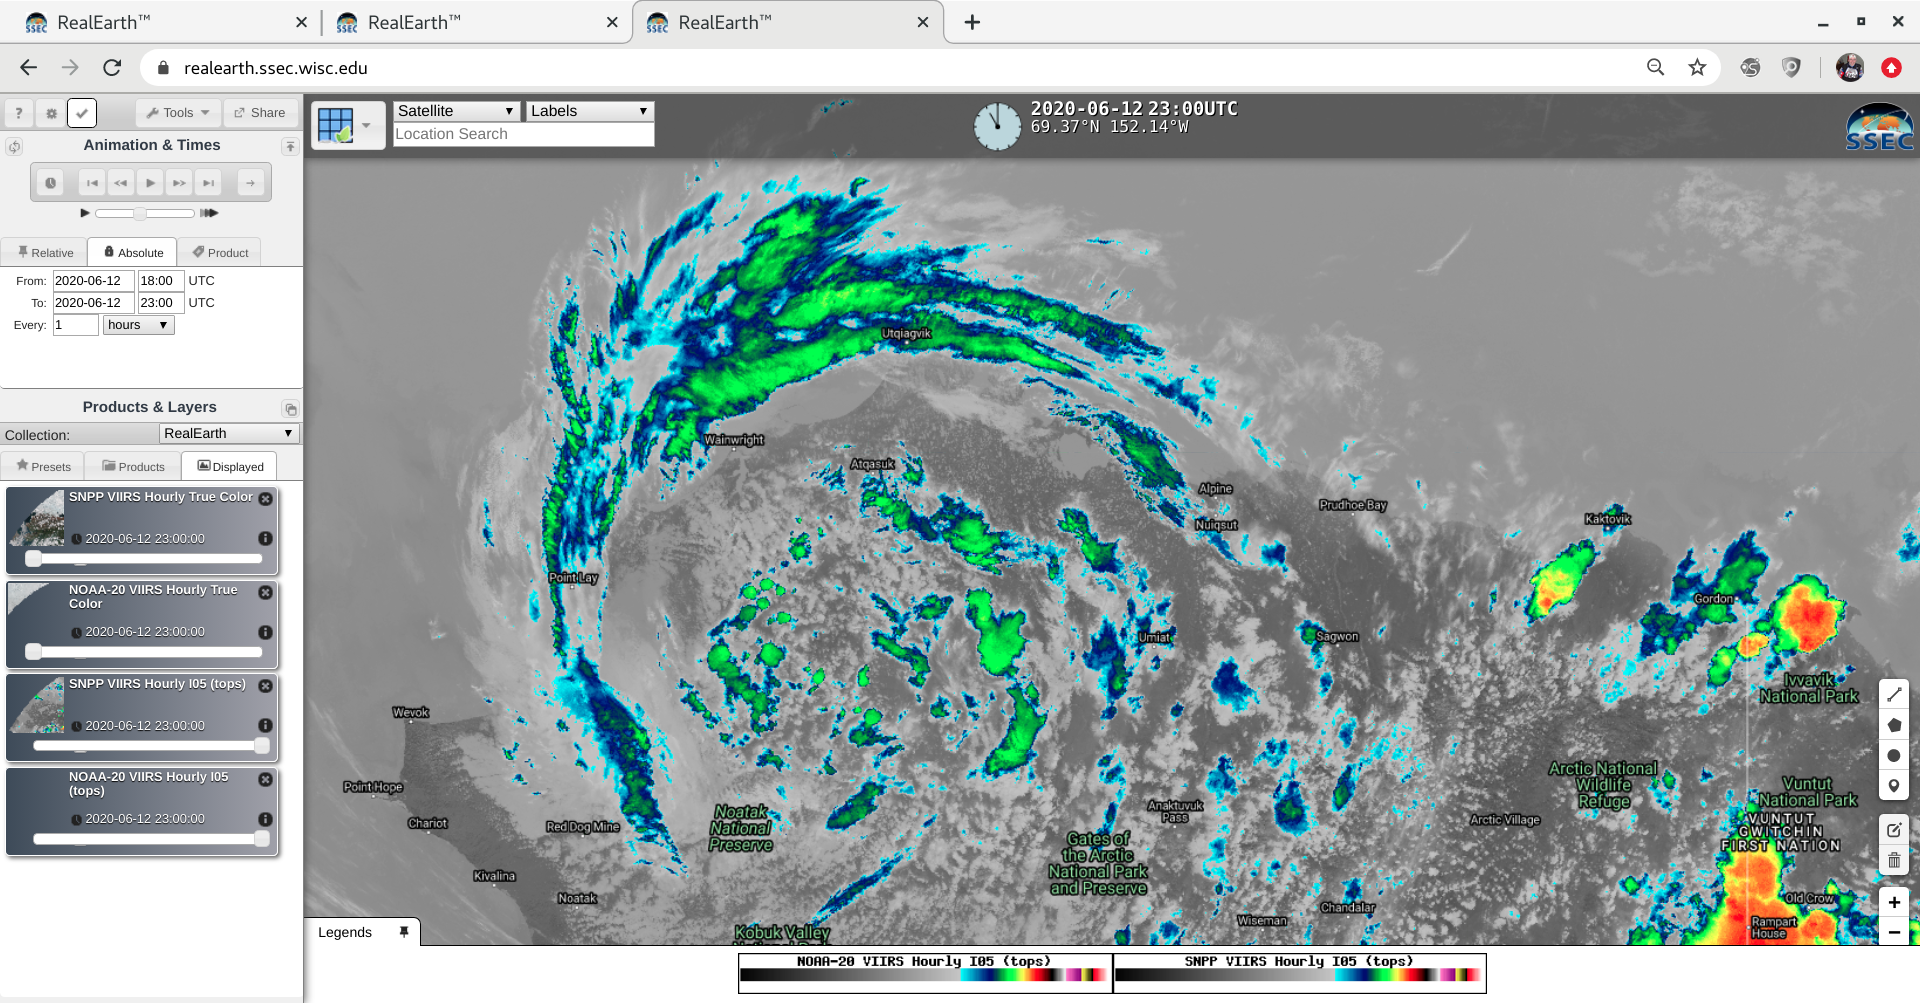
![VIIRS True Color (RGB) and Infrared Window (11.45 µm) images from NOAA-20 and Suomi NPP [click to enlarge]](https://cimss.ssec.wisc.edu/satellite-blog/images/2020/06/200612_noaa20_suomiNPP_trueColorRGB_infraredWindow_AK_anim.gif)
