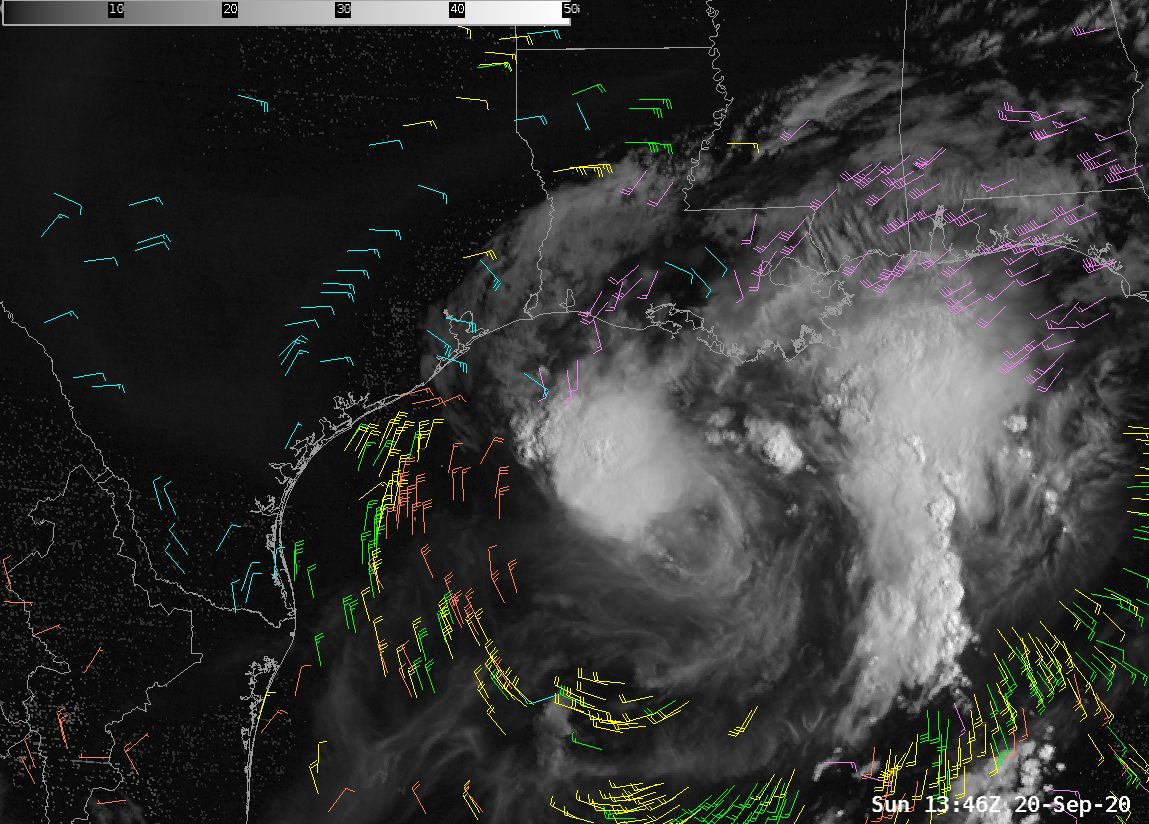
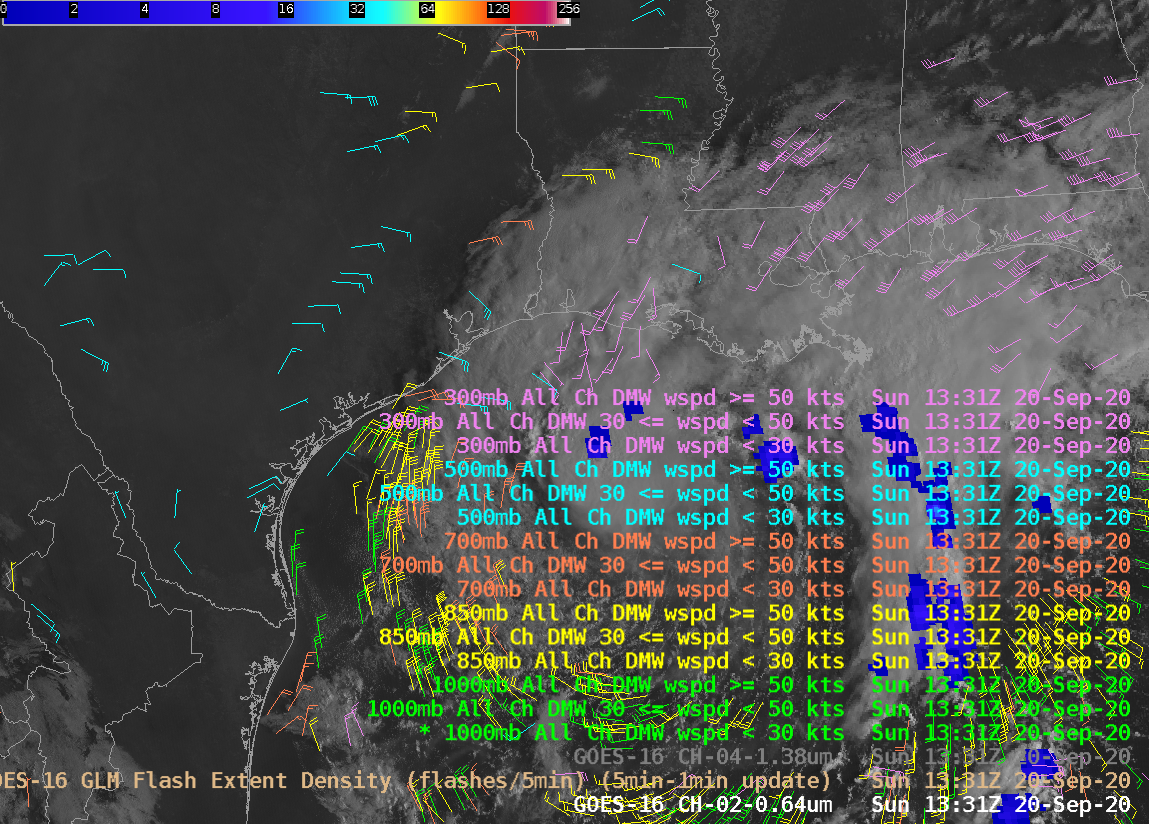
Tropical Storm Beta was in the northwest Gulf of Mexico on 20 September 2020. Visible imagery (with GLM overlain) shows two principal regions of convection, one near the center, and one in a long feeder band to the east of the storm. Derived motion winds (this image includes a legend that links vector color to level) show cyclonic low-level motion in... Read More
GOES-16 Imagery and Derived Motion winds at 1346 UTC on 20 September 2020 (Click to enlarge). ABI Imagery includes Visible (Band 2, 0.64 µm), the near-infrared ‘Cirrus’ (Band 4, 1.38 µm) and the upper water vapor (Band 8, 6.19 µm) and lower water vapor (Band 10, 7.34 µm) infrared imagery. Derived motion winds for 1346 UTC near 1000 mb (green), 850 mb (yellow), 700 mb (orange), 500 mb (cyan) and 300 mb (purple) are also shown
Tropical Storm Beta was in the northwest Gulf of Mexico on 20 September 2020. Visible imagery (with GLM overlain) shows two principal regions of convection, one near the center, and one in a long feeder band to the east of the storm. Derived motion winds (this image includes a legend that links vector color to level) show cyclonic low-level motion in the northwest Gulf of Mexico, divergent motion at 500 mb, and strong westerly outflow at 300 mb.
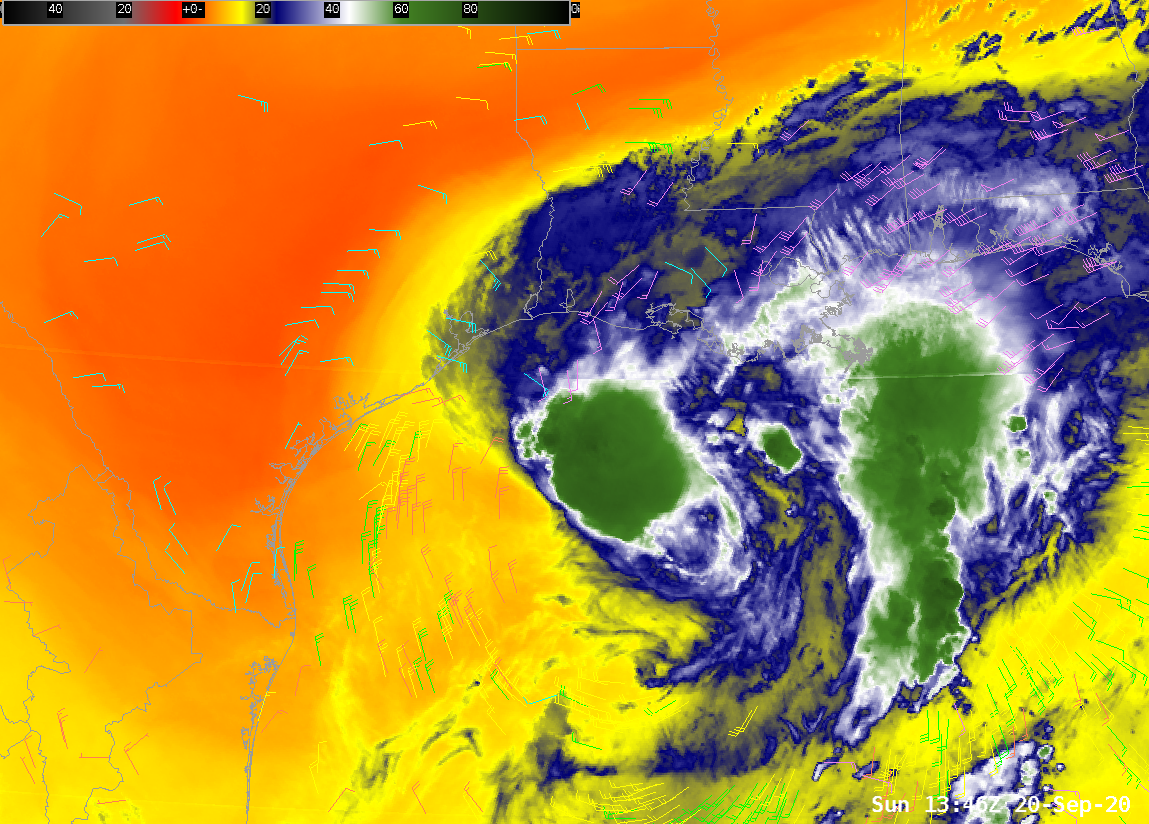
‘Cirrus Channel’ (Band 4, 1.38 µm) near-infrared imagery shows the considerable upper-level cloudiness associated with the central convection and the convective band east of the center. There is also abundant storm outflow to the east and north of the storm.
Visible imagery and low-level winds show cyclonic motion at low levels. The convection is displaced to the east because of southwesterly shear over the storm (shown below, in an image take from this site).
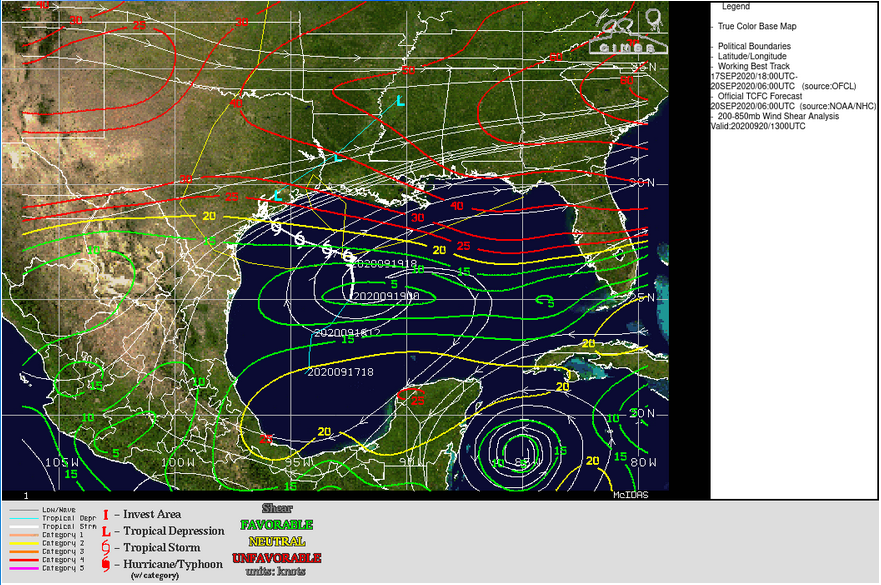
200-850 mb wind shear over the Gulf of Mexico, 1400 UTC on 20 September 2020 (click to enlarge)
Both upper-level and low-level water vapor imagery show very dry mid-tropospheric air over Texas. MIMIC Total Precipitable Water, below, (source), also shows the significant dry air over the continent. (Hurricane Teddy is also apparent in the western Atlantic).

Hourly MIMIC Total Precipitable Water estimates for the 24 hours ending 1400 UTC on 20 September 2020 (Click to enlarge)
Is the dry air influencing the development of this storm? Low-level flow (850-700), below, from this site, shows weak easterly flow. Low-level flow is from regions of deep moisture. Upper-level flow (200-700 mb) shows motion from the (dryer) west. These two different airflows are influencing the development of Beta.
Mean 850-700 mb flow at 1200 UTC, 20 September 2020 (Click to enlarge)
Mean 700-200 mb flow at 1200 UTC, 20 September 2020 (Click to enlarge)
For the latest on Beta, refer to the pages of the National Hurricane Center (direct link for Beta).
View only this post
Read Less
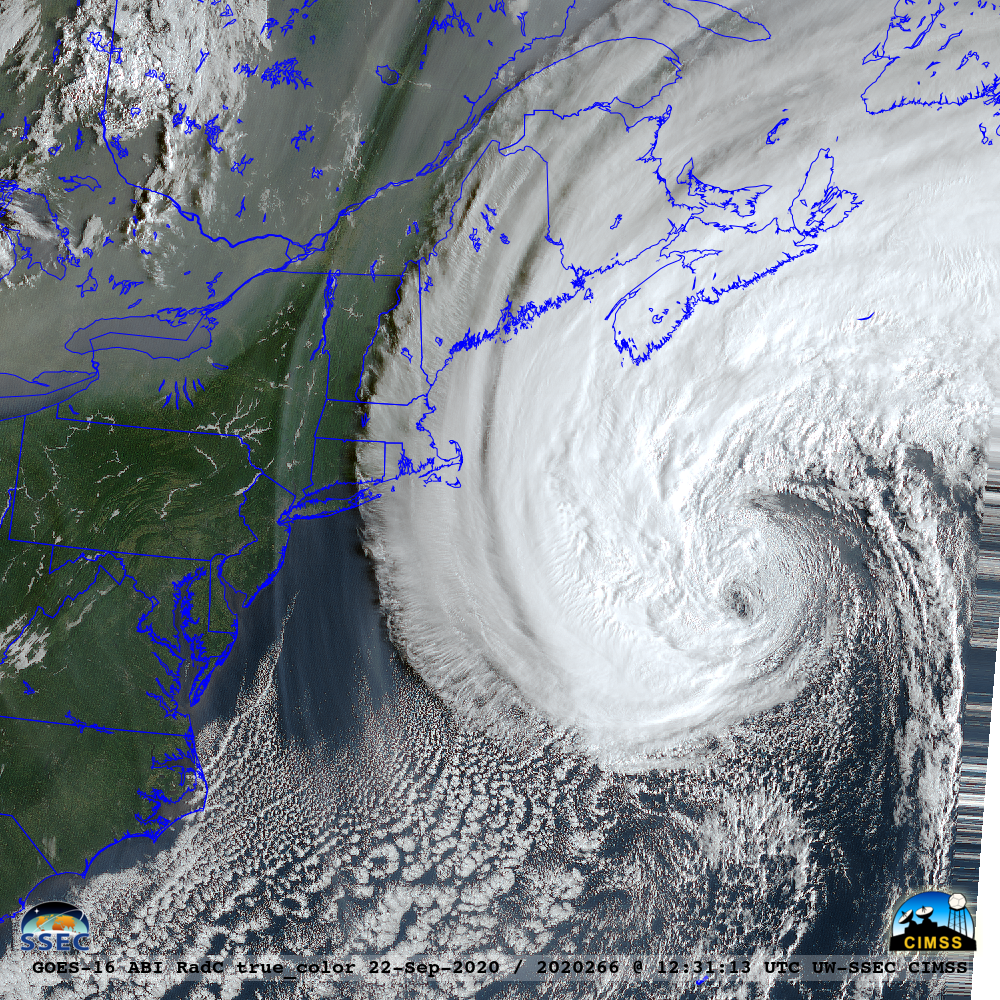
![GOES-16 True Color RGB images [click to play animation | MP4]](https://cimss.ssec.wisc.edu/satellite-blog/images/2020/09/200922_goes16_trueColorRGB_Hurricane_Teddy_wildfire_smoke_anim.gif)
![DMSP-17 SSMIS Microwave (85 GHz) image at 2217 UTC [click to enlarge]](https://cimss.ssec.wisc.edu/satellite-blog/images/2020/09/200922_2217utc_dmsp17_ssmis_microwave_Hurricane_Teddy.gif)
![GOES-16 CIMSS Natural Color RGB images, with and without an overlay of Aerosol Optical Depth [click to play animation | MP4]](https://cimss.ssec.wisc.edu/satellite-blog/images/2020/09/200922_goes16_cimssNaturalColorRGB_aerosolOpticalDepth_Hurricane_Teddy_wildfire_smoke_anim.gif)
![Plots of lidar backscatter and depolarization from 12 UTC o n 22 September to 00 UTC on 23 September [click to enlarge]](https://cimss.ssec.wisc.edu/satellite-blog/images/2020/09/200922_lidar_backscatter_depolariation_Madison_WI.jpg)


