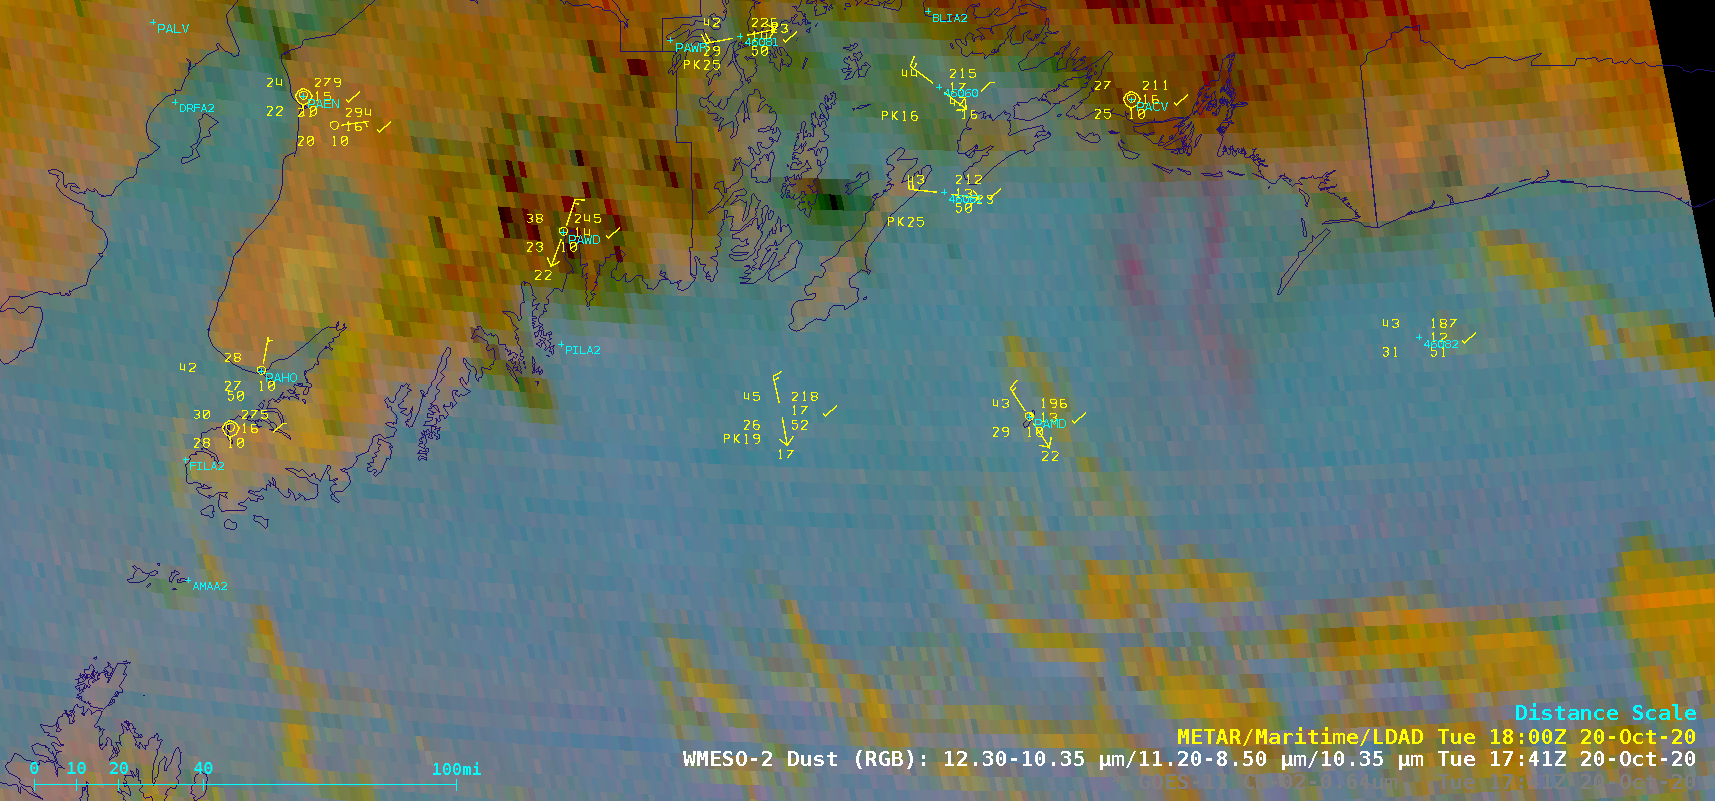
Strong gap winds accelerating out of the Copper River Valley along the southern coast of Alaska were lofting fine particles of glacial silt/sand and transporting those aerosols southward across the Gulf of Alaska on 20 October 2020. 1-minute Mesoscale Domain Sector GOES-17 (GOES-West) “Red” Visible (0.64 µm) and Dust Red-Green-Blue (RGB) images (above) displayed the plume... Read More

GOES-17 “Red” Visible (0.64 µm) and Dust RGB images [click to play animation | MP4]
Strong gap winds accelerating out of the
Copper River Valley along the southern coast of Alaska were lofting fine particles of glacial silt/sand and transporting those aerosols southward across the Gulf of Alaska on 20 October 2020. 1-minute
Mesoscale Domain Sector GOES-17
(GOES-West) “Red” Visible (
0.64 µm) and
Dust Red-Green-Blue (RGB) images
(above) displayed the plume of airborne dust during the period of 1700-2300 UTC.
A good visualization of the dust plume was provided by GOES-17 True Color RGB images created using Geo2Grid (below).
![GOES-17 True Color RGB images [click to play animation | MP4]](https://cimss.ssec.wisc.edu/satellite-blog/images/2020/10/GOES-17_ABI_RadF_true_color_2020294_211031Z.png)
GOES-17 True Color RGB images [click to play animation | MP4]
A comparison of Suomi NPP VIIRS Visible (0.64 µm), Shortwave Infrared (3.74 µm) and Infrared Window (11.45 µm) images at 2040 UTC is shown below — note that the dust plume appeared warmer
(darker shades of gray) on the Shortwave Infrared image, since the small dust particles were efficient reflectors of incoming solar radiation.
![Suomi NPP VIIRS Visible, Shortwave Infrared and Infrared Window images [click to enlarge]](https://cimss.ssec.wisc.edu/satellite-blog/images/2020/10/201020_2040utc_suomiNPP_viirs_visible_shortwaveInfrared_infraredWindow_AK_dust_anim.gif)
Suomi NPP VIIRS Visible (0.64 µm), Shortwave Infrared (3.74 µm) and Infrared Window (11.45 µm) images [click to enlarge]
The dust plume also exhibited a good signature in the VIIRS Aerosol Optical Thickness (AOT) product from the
eIDEA-AK site
(below).
![VIIRS True Color RGB and Aerosol Optical Thickness images [click to enlarge]](https://cimss.ssec.wisc.edu/satellite-blog/images/2020/10/201020_viirs_trueColorRGB_aerosolOpticalThickness_AK_dust_anim.gif)
VIIRS True Color RGB and Aerosol Optical Thickness images [click to enlarge]
View only this post
Read Less
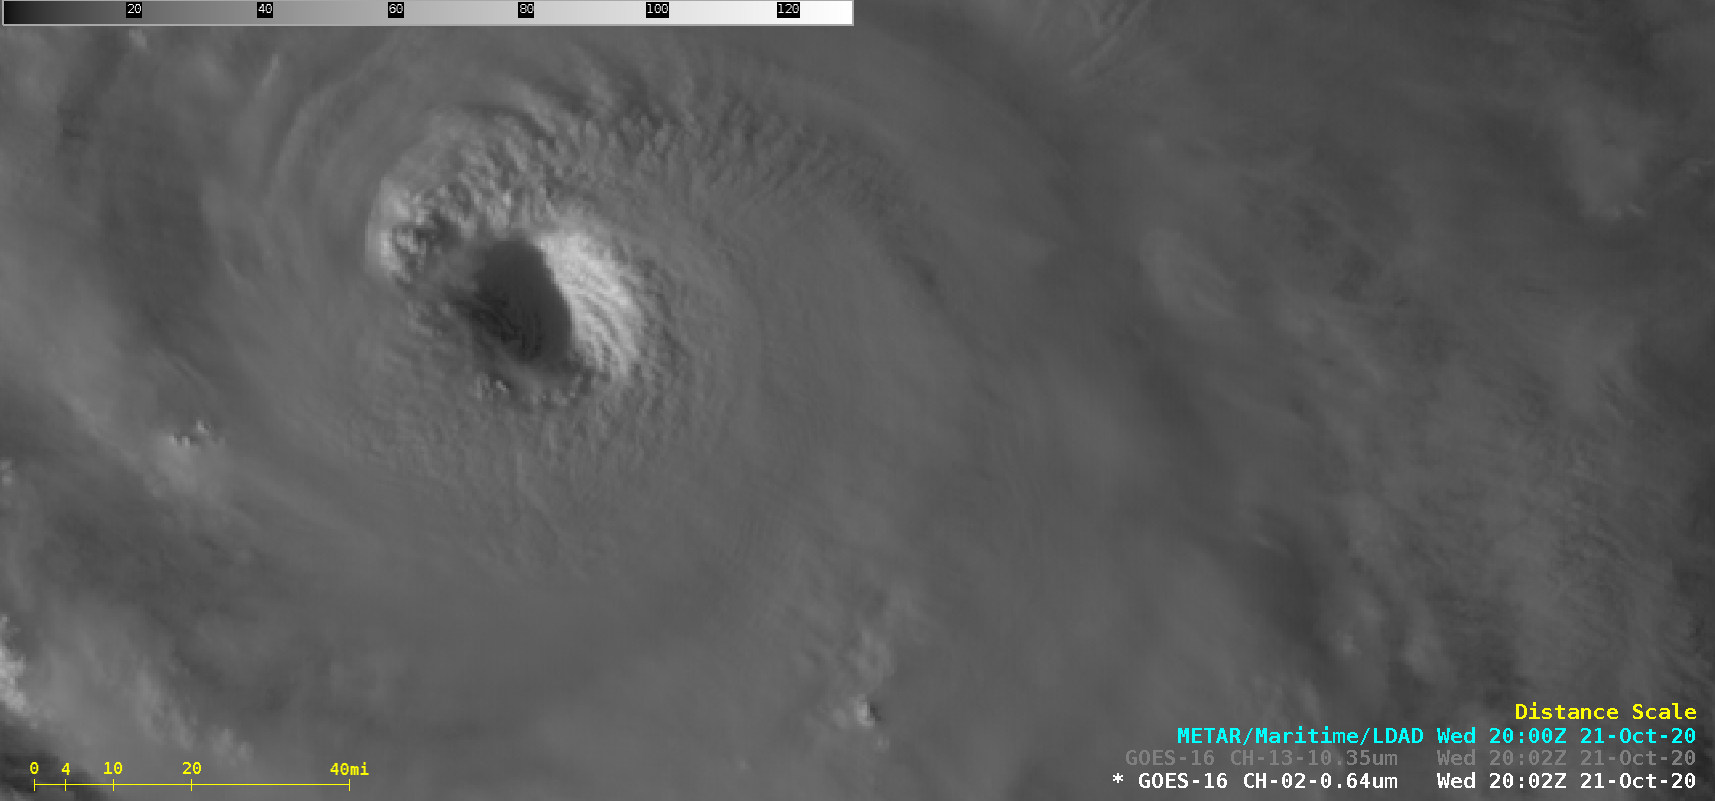
![GOES-16 “Red” Visible (0.64 µm) and “Clean” Infrared Window (10.35 µm) images [click to play animation | MP4]](https://cimss.ssec.wisc.edu/satellite-blog/images/2020/10/201021_goes16_visible_infrared_Hurricane_Epsilon_anim.gif)
![GOES-16 Mid-level Water Vapor(6.9 µm) images, with plots of Derived Motion Winds [click to enlarge]](https://cimss.ssec.wisc.edu/satellite-blog/images/2020/10/201021_goes16_waterVapor_winds_Epsilon.gif)


![GOES-17 True Color RGB images [click to play animation | MP4]](https://cimss.ssec.wisc.edu/satellite-blog/images/2020/10/201020_goes17_trueColorRGB_AK_dust_anim.gif)
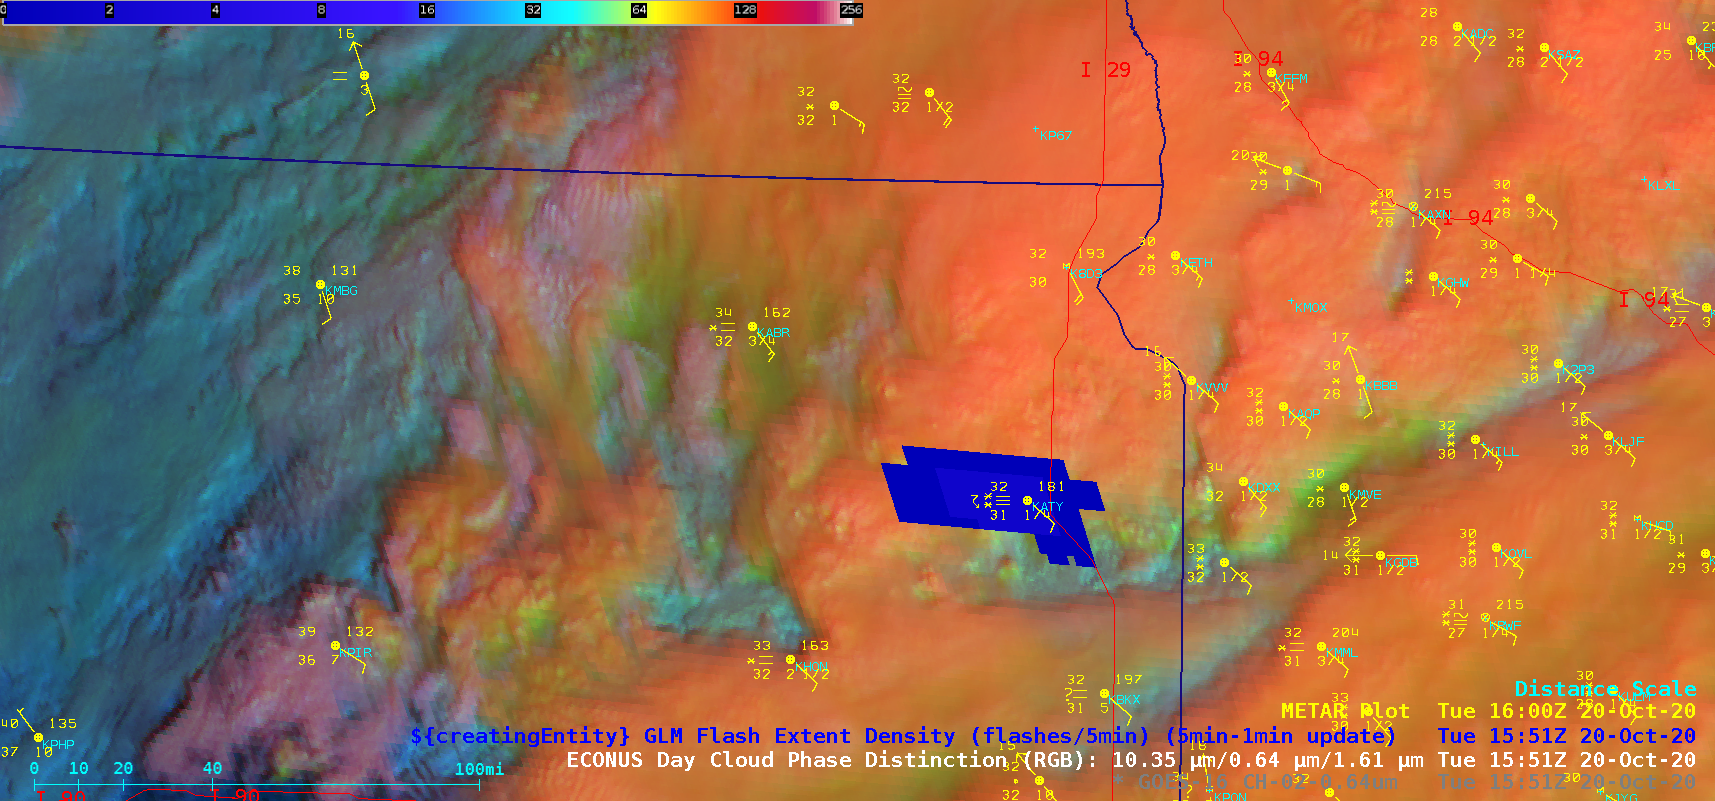
![GOES-16 Day Cloud Phase Distinction RGB images, with an overlay of GLM Flash Extent Density [click to play animation | MP4]](https://cimss.ssec.wisc.edu/satellite-blog/images/2020/10/201020_goes16_dayCloudPhaseDistinction_glmFlashExtentDensity_SD_thundersnow_anim.gif)
