Severe turbulence over coastal South Carolina
![GOES-16 Upper-level Water Vapor (6.2 µm) images, with plots of pilot reports and SIGMET boundaries [click to play animation | MP4]](https://cimss.ssec.wisc.edu/satellite-blog/wp-content/uploads/sites/5/2019/11/191115_goes16_waterVapor_pireps_sigmets_anim.gif)
GOES-16 Upper-level Water Vapor (6.2 µm) images, with pilot reports of turbulence and SIGMET boundaries [click to play animation | MP4]
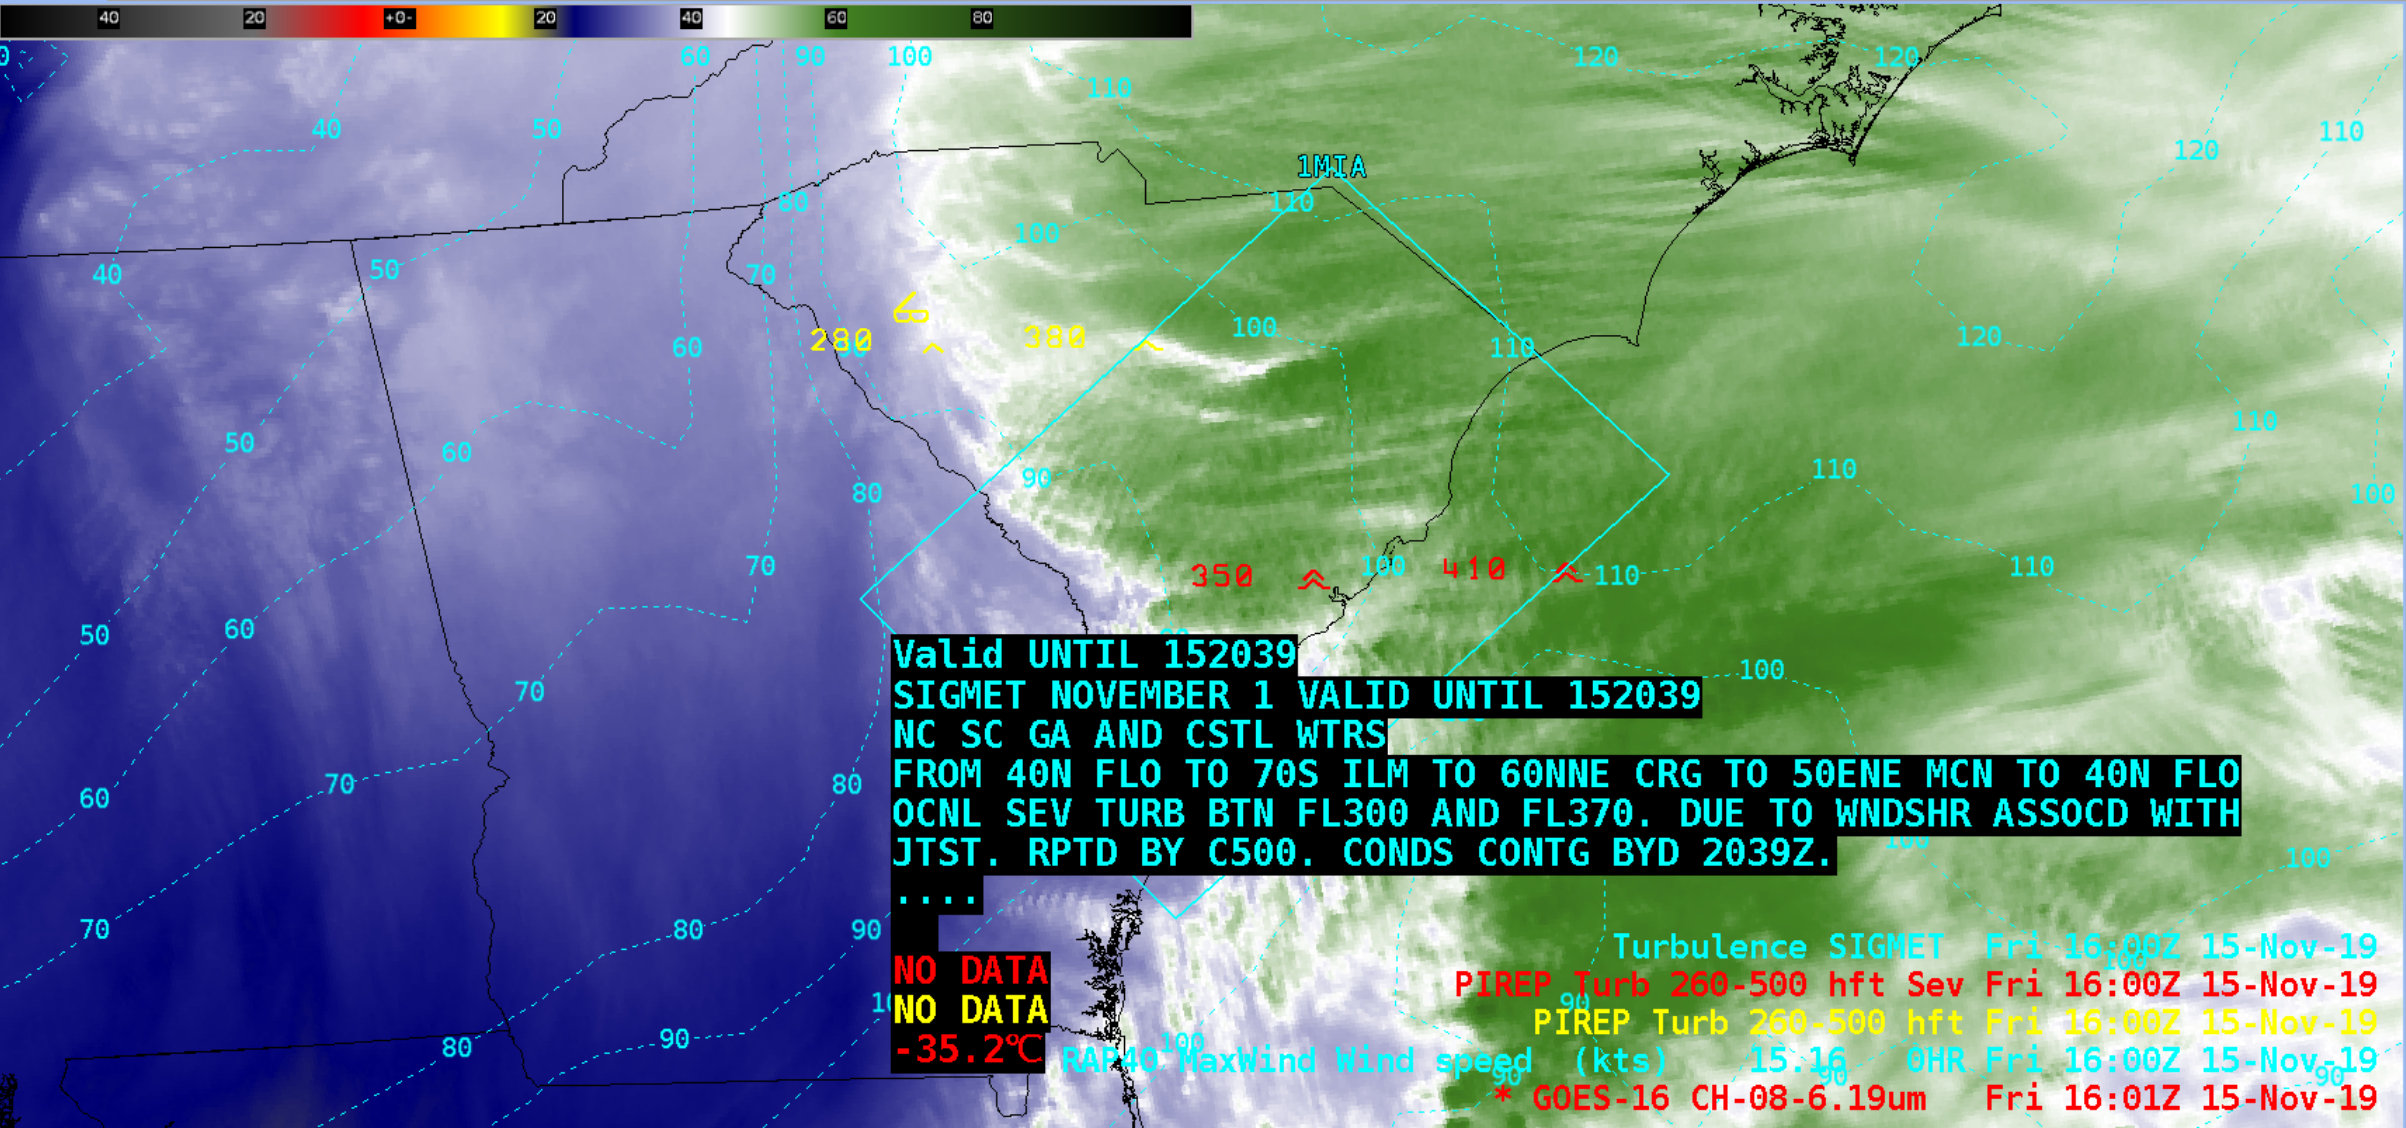
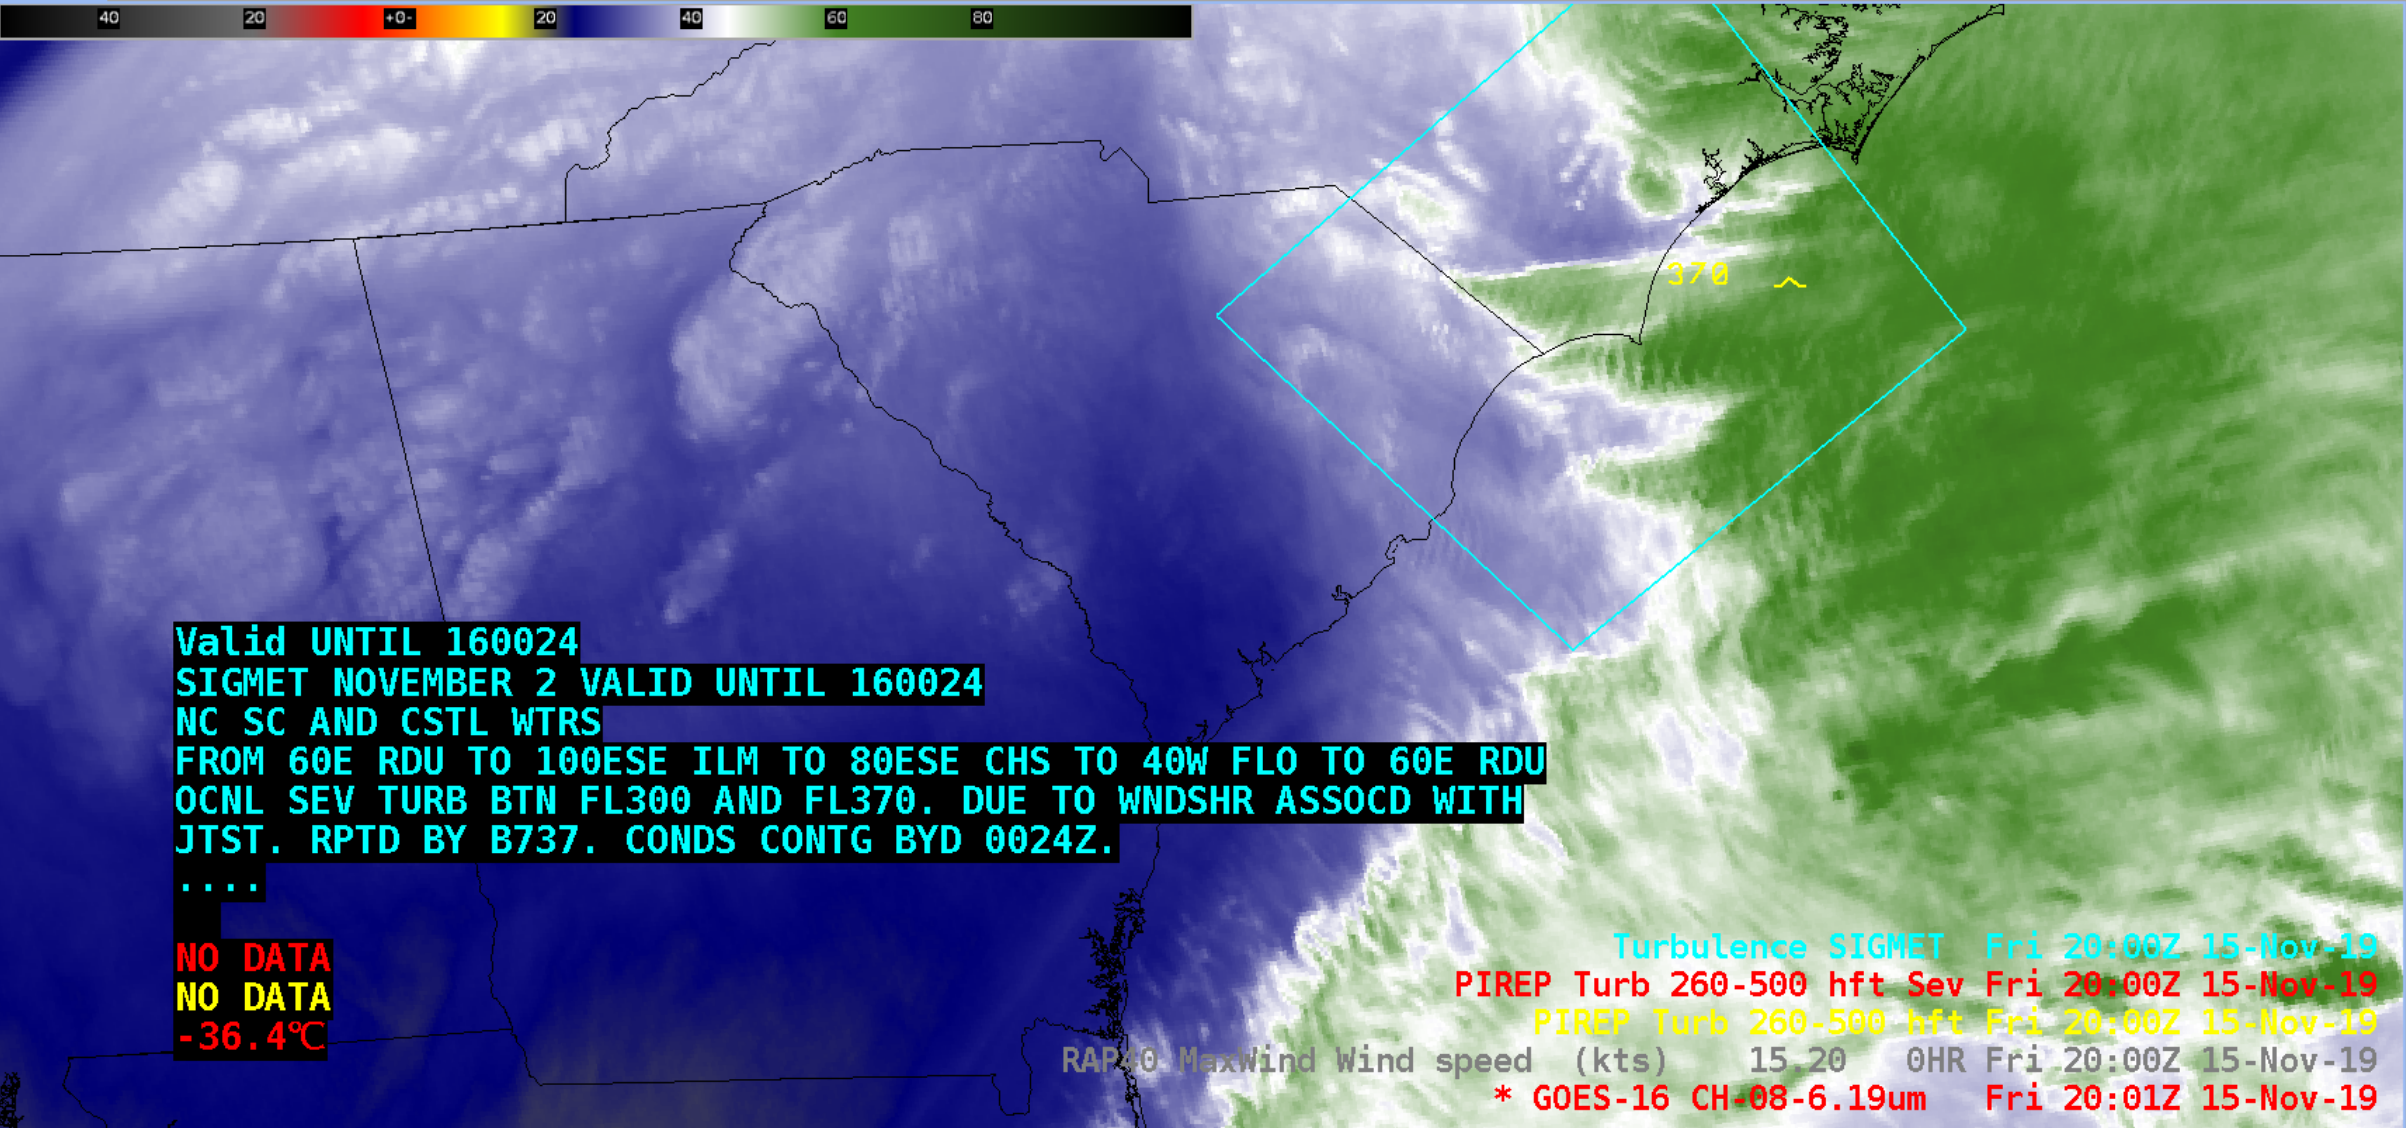
The same GOES-16 Water Vapor images which include isotachs of RAP40 model maximum wind (at any level) are shown below — most of the Moderate to Severe turbulence reports were occurring within the speed gradient along the poleward (left) edge of a SW-NE oriented jet stream flowing parallel to the coast.
![GOES-16 Upper-level Water Vapor (6.2 µm) images, with plots of pilot reports, SIGMET boundaries, and isotachs of RAP40 model maximum wind [click to play animation | MP4]](https://cimss.ssec.wisc.edu/satellite-blog/wp-content/uploads/sites/5/2019/11/191115_goes16_waterVapor_pireps_sigmets_rap40maxWinds_anim.gif)
GOES-16 Upper-level Water Vapor (6.2 µm) images, with pilot reports of turbulence, SIGMET boundaries, and isotachs of RAP40 model maximum wind [click to play animation | MP4]
![Terra MODIS Visible (0.65 µm) image, with plots of pilot reports and SIGMET boundaries [click to enlarge]](https://cimss.ssec.wisc.edu/satellite-blog/wp-content/uploads/sites/5/2019/11/191115_1600utc_modis_vis_pireps-20191115_160124.png)
Terra MODIS Visible (0.65 µm) image, with pilot reports of turbulence and SIGMET boundaries [click to enlarge]
![NOAA-20 VIIRS True Color RGB and Infrared Window (11.45 µm) images, with pilot reports of turbulence [click to enlarge]](https://cimss.ssec.wisc.edu/satellite-blog/wp-content/uploads/sites/5/2019/11/191115_1740utc_noaa20_truecolor_infrared_pireps_anim.gif)
NOAA-20 VIIRS True Color RGB and Infrared Window (11.45 µm) images, with pilot reports of turbulence [click to enlarge]