![GOES-16 Mid-level Water Vapor (6.9 µm) images, with hourly surface weather type plotted in red [click to play animation | MP4]](https://cimss.ssec.wisc.edu/satellite-blog/wp-content/uploads/sites/5/2019/10/G16_WV_ND_09_12OCT2019_B9_2019284_120127_GOES-16_0001PANEL_FRAME00469.GIF)
GOES-16 Mid-level Water Vapor (6.9 µm) images, with hourly surface weather type plotted in red [click to play animation | MP4]
With the approach of an
anomalously-deep 500 hPa low, an early-season winter storm produced very heavy snowfall and blizzard conditions across the Northern Plains — particularly in central/eastern North Dakota and
southern Manitoba — during the
10 October –
12 October 2019 period. GOES-16
(GOES-East) Mid-level Water Vapor (
6.9 µm) images
(above) showed the long duration of precipitation across that region. Text listings of snowfall totals and wind gusts are available from
WPC,
NWS Bismarck and
NWS Grand Forks (more complete storm summaries:
NWS Bismarck |
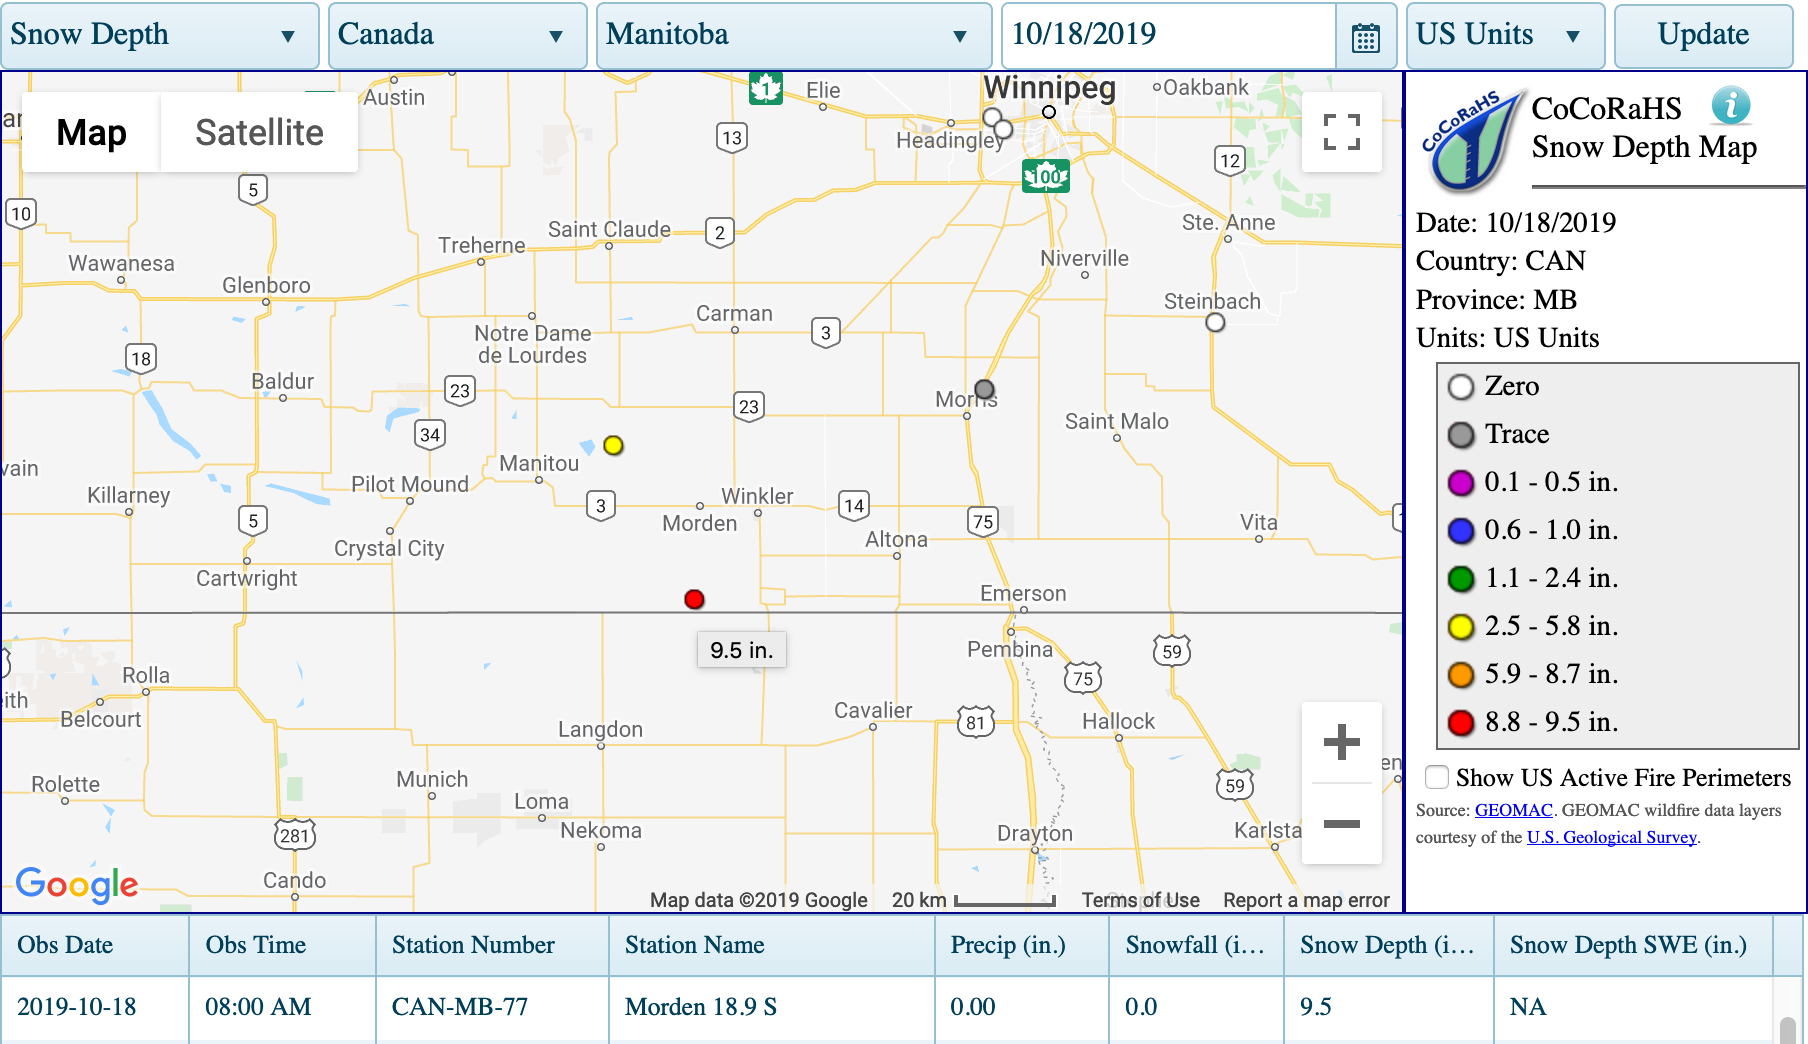
NWS Grand Forks). The highest storm total snowfall amount in far southern Manitoba was 32 inches south of Morten (which reported a
snow depth of 30 inches on the morning of 12 October), with 30 inches in central North Dakota at Harvey.
GOES-16 “Red” Visible (0.64 µm) images (below) displayed the storm during the daylight hours on 10/11/12 October.
![GOES-16 "Red" Visible (0.64 µm) images on 10/11/12 October, with hourly precipitation type plotted in red [click to play animation | MP4]](https://cimss.ssec.wisc.edu/satellite-blog/wp-content/uploads/sites/5/2019/10/G16_VIS_ND_11OCT2019_B2_2019284_150127_GOES-16_0001PANEL_FRAME00025.GIF)
GOES-16 “Red” Visible (0.64 µm) images on 10/11/12 October, with hourly precipitation type plotted in red [click to play animation | MP4]
On 11 October, GOES-16 Visible images with an overlay of
GLM Flash Extent Density
(below) revealed intermittent clusters of lightning activity over northwestern Minnesota, northeastern North Dakota and southern Manitoba — while no surface stations explicitly reported a thunderstorm, NWS Grand Forks received calls from the public about
thundersnow. The texture of cloud tops in the Visible imagery also supported the presence of embedded convective elements, which likely enhanced snowfall rates as they pivoted across that area. An animation of GOES-16 Visible imagery with plots of GLM Groups and surface weather type is available
here.
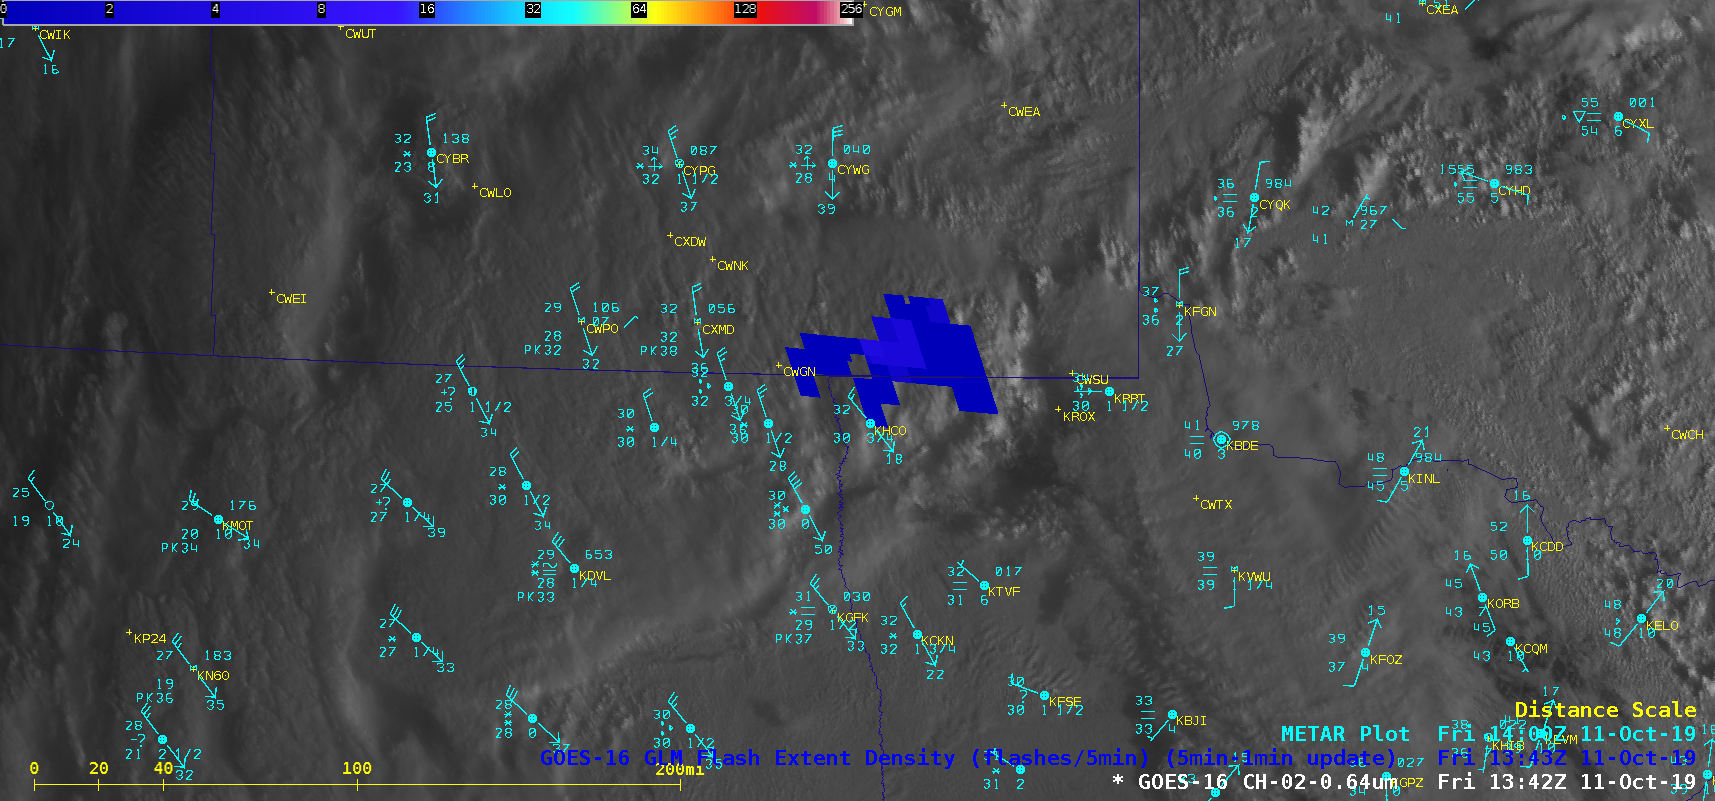
GOES-16 “Red” Visible (0.64 µm) images, with an overlay of GLM Flash Extent Density [click to play animation | MP4]
Note that this lightning-producing convection was occurring near the leading edge of the cyclone’s mid-tropospheric dry slot, as seen in GOES-16 Water Vapor imagery
(below).
![GOES-16 "Red" Visible (0.64 µm, left) and Mid-level Water Vapor (6.9 µm, right) images, with GLM Groups plotted in red [click to play animation | MP4]](https://cimss.ssec.wisc.edu/satellite-blog/wp-content/uploads/sites/5/2019/10/G16_VIS_WV_ND_THUNDERSNOW_11OCT2019_B29_2019284_164834_0002PANELS_FRAME00229.GIF)
GOES-16 “Red” Visible (0.64 µm, left) and Mid-level Water Vapor (6.9 µm, right) images, with GLM Groups plotted in red [click to play animation | MP4]
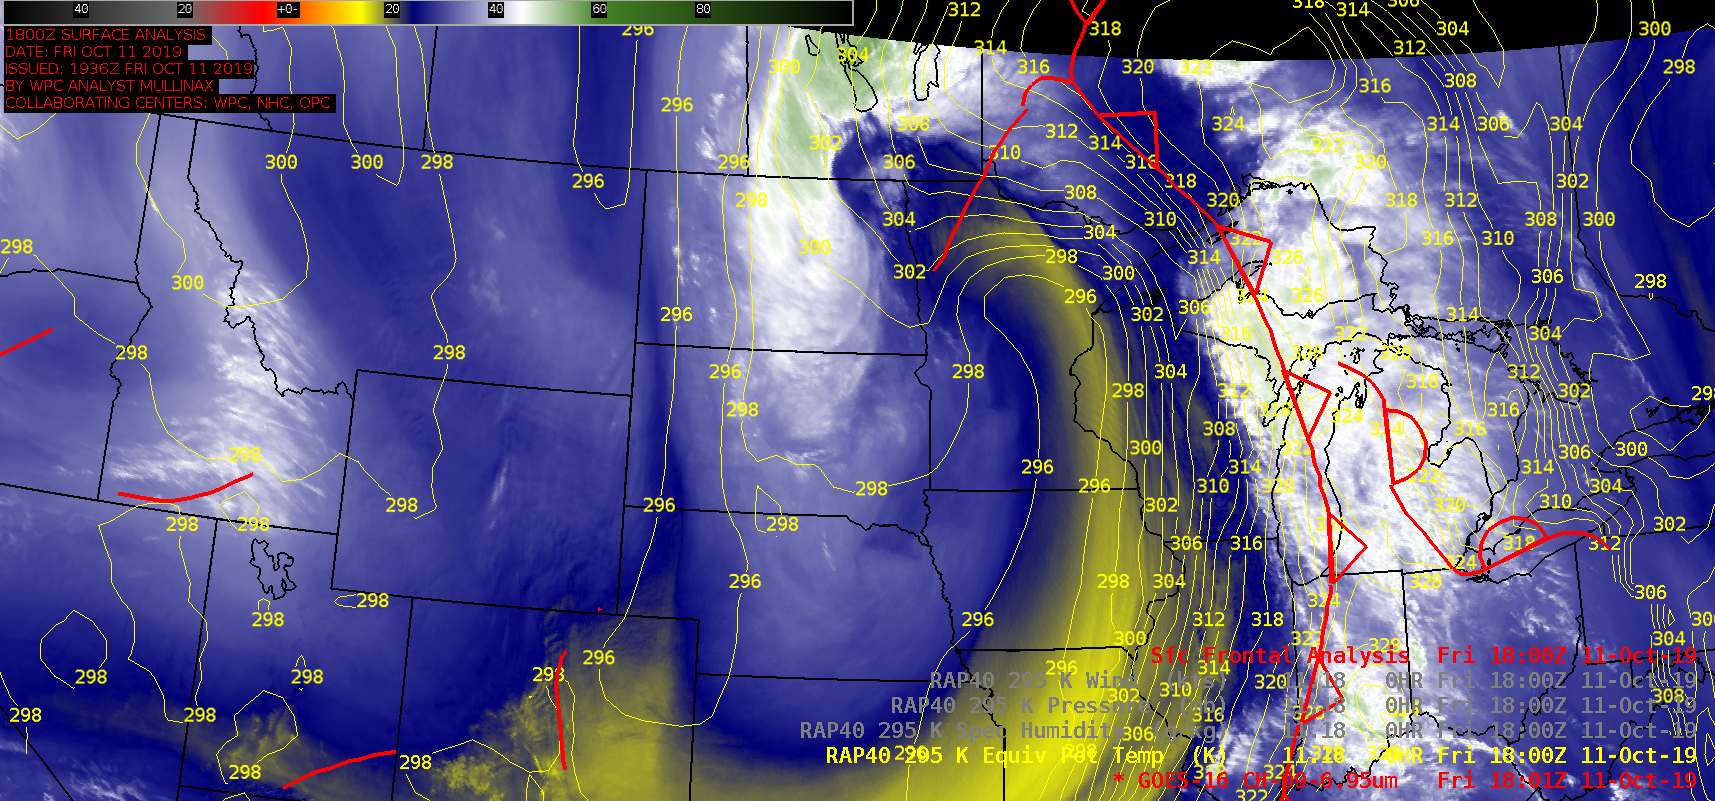
One important aspect of this storm was the formation of a
TROugh of
Warm air
ALoft or
TROWAL (
SHyMet |
Martin, 1998) as the surface low began to enter its occluded phase on 11 October — contours of Equivalent Potential Temperature along the 295 K isentropic surface
(below) helped to diagnose the axis of the TROWAL as it curved cyclonically from southwestern Ontario to southern Manitoba and then southward over North Dakota.
![GOES-16 Mid-level Water Vapor (6.9 µm) images, with 295 K equivalent potential temperature contours plotted in yellow and surface fronts plotted in red [click to play animation | MP4]](https://cimss.ssec.wisc.edu/satellite-blog/wp-content/uploads/sites/5/2019/10/nd_wv_295k_thetae-20191011_180127.png)
GOES-16 Mid-level Water Vapor (6.9 µm) images, with 295 K Equivalent Potential Temperature contours plotted in yellow and surface fronts plotted in red [click to play animation | MP4]
A similar animation with contours of 295 K specific humidity
(below) also displayed the orientation of a west-to-east cross section B-B’
(green) across northern Northern Minnesota and northern Minnesota.
![GOES-16 Mid-level Water Vapor (6.9 µm) images, with 295 K Specific Humidity contours plotted in yellow and surface fronts plotted in red [click to play animation | MP4]](https://cimss.ssec.wisc.edu/satellite-blog/wp-content/uploads/sites/5/2019/10/nd_wv_xsec_lineB-20191011_180127.png)
GOES-16 Mid-level Water Vapor (6.9 µm) images, with 295 K Specific Humidity contours plotted in yellow and surface fronts plotted in red [click to play animation | MP4]
The Line B-B’ cross section at 16 UTC (with and without contours of Equivalent Potential Temperature) is shown below. Note the deep column of upward vertical velocity
(highlighted by color shading of Omega) centered over Langdon, North Dakota — the moist TROWAL airstream can be seen sloping isentropically upward and westward behind the 3 g/kg Specific Humidity contour, as it approached the region of upward vertical motion. Langdon received 27 inches of snowfall; the prolonged southward passage of the TROWAL over North Dakota likely contributed to this accumulation.
![Cross section of RAP40 model fields along Line B-B' at 16 UTC [click to enlarge]](https://cimss.ssec.wisc.edu/satellite-blog/wp-content/uploads/sites/5/2019/10/191011_16utc_LineB_cros_section_anim.gif)
Cross section of RAP40 model fields along Line B-B’ at 16 UTC [click to enlarge]
As the storm was gradually winding down on 12 October, its circulation exhibited a very broad middle-tropospheric signature on GOES-16 Water Vapor imagery
(below).
![GOES-16 Mid-level Water Vapor (6.9 µm) images, with surface frontal positions [click to play animation]](https://cimss.ssec.wisc.edu/satellite-blog/wp-content/uploads/sites/5/2019/10/bliz_wv-20191012_221030.png)
GOES-16 Mid-level Water Vapor (6.9 µm) images, with surface frontal positions [click to play animation | MP4]
===== 17 October Update =====
![Aqua MODIS True Color and False Color RGB images [click to enlarge]](https://cimss.ssec.wisc.edu/satellite-blog/wp-content/uploads/sites/5/2019/10/191017_aqua_modis_truecolor_falsecolor_ND_MN_anim.gif)
Aqua MODIS True Color and False Color RGB images [click to enlarge]
After the area had already experienced its wettest Fall season on record, additional rainfall and snowmelt from this winter storm exacerbated ongoing flooding problems. A comparison of 250-meter resolution Aqua MODIS True Color and False Color Red-Green-Blue (RGB) images (
source) centered over northeastern North Dakota
(above) revealed flooding along the Red River (which flows northward along the North Dakota / Minnesota border) — water appears as darker shades of blue in the False Color image.
A Suomi NPP VIIRS Flood Product depicting floodwater fractions in the Red River Valley north of Grand Forks ND (as visualized using RealEarth) is shown below.
![Suomi NPP VIIRS Flood Product, depicting floodwater fractions in the Red River Valley north of Grand Forks, ND [click to enlarge]](https://cimss.ssec.wisc.edu/satellite-blog/wp-content/uploads/sites/5/2019/10/191018_river_flood_ND_MN.png)
Suomi NPP VIIRS Flood Product, depicting floodwater fractions in the Red River Valley north of Grand Forks, ND [click to enlarge]
===== 18 October Update =====
![GOES-16 Day Cloud Phase Distinction RGB images [click to play animation | MP4]](https://cimss.ssec.wisc.edu/satellite-blog/wp-content/uploads/sites/5/2019/10/nd_rgb-20191018_170130.png)
GOES-16 Day Cloud Phase Distinction RGB images [click to play animation | MP4]
On 18 October — 1 week after the height of the historic blizzard — GOES-16
Day Cloud Phase Distinction RGB images showed significant snow cover
(brighter shades of green) remaining in parts of northeastern North Dakota and southern Manitoba that received the highest storm total snowfall accumulations (for example, 32″ south of Morden MB, 29″ at Vang ND, 28″ at Olga ND and 27″ at Langdon ND). The site south of Morden MB reported a residual
snow depth of 10 inches that morning.
View only this post
Read Less
![GOES-17 “Red” Visible (0.64 µm, left) and "Clean" Infrared Window (10.35 µm, right) images, with SPC Storm Reports plotted in red [click to play animation | MP4]](https://cimss.ssec.wisc.edu/satellite-blog/wp-content/uploads/sites/5/2019/10/191019_goes17_visible_infrared_spcStormReports_ID_anim.gif)
![[click to play animation | MP4]](https://cimss.ssec.wisc.edu/satellite-blog/wp-content/uploads/sites/5/2019/10/191019_goes17_waterVapor_spcStormReports_ID_anim.gif)
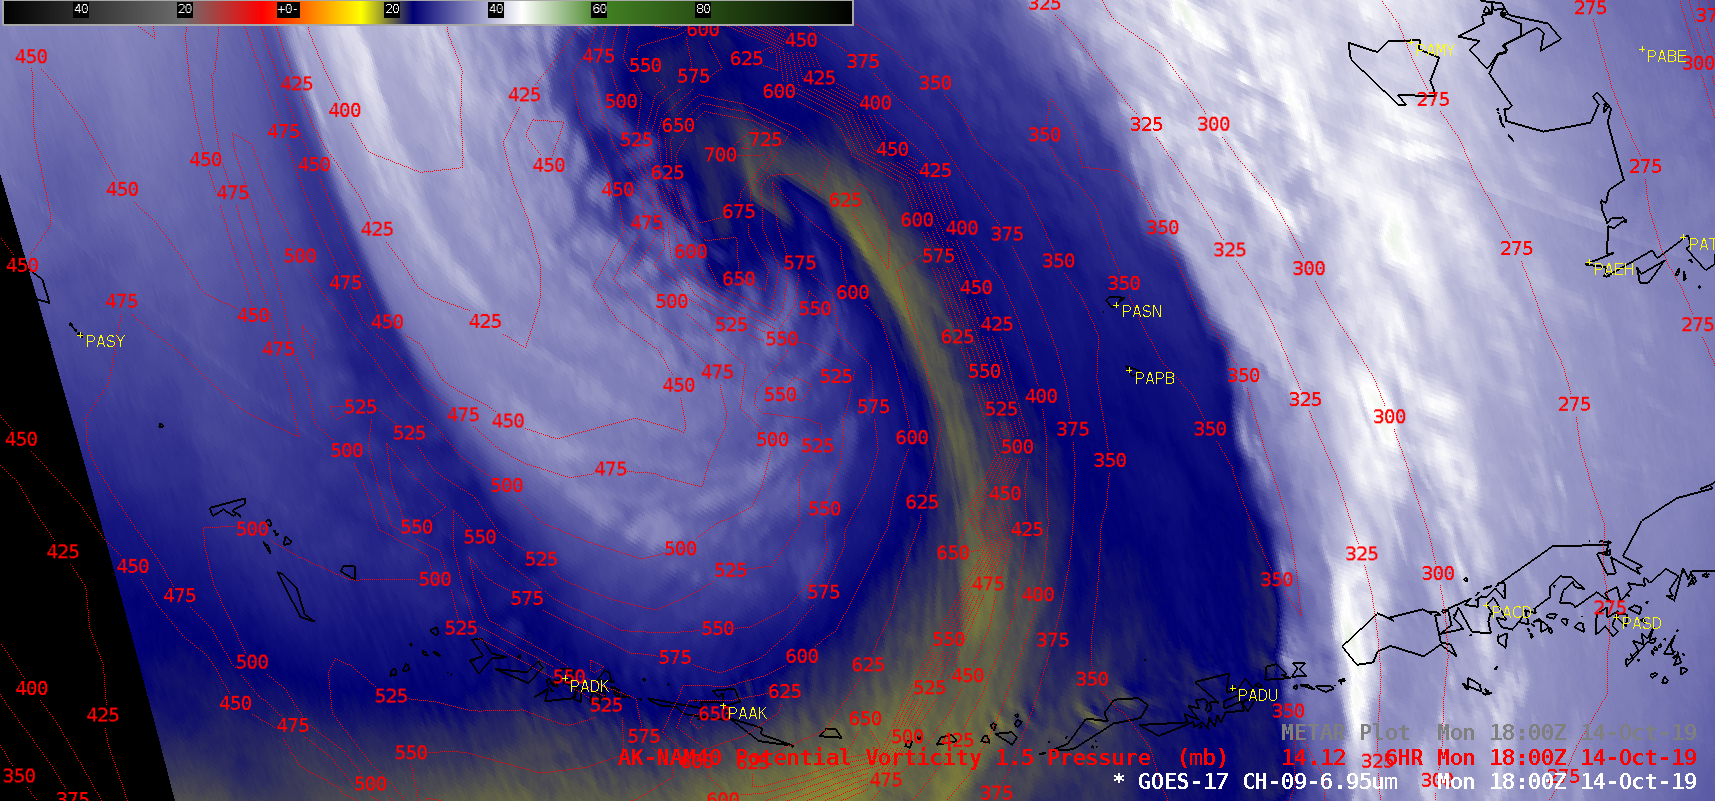
![GOES-17 Mid-level Water Vapor (6.9 µm) images with surface reports plotted in cyan, then contours of the PV1.5 pressure, followed by the GOES-17 Air Mass RGB [click to play animation | MP4]](https://cimss.ssec.wisc.edu/satellite-blog/wp-content/uploads/sites/5/2019/10/191014_goes17_waterVapor_metars_pv1.5pressure_airMassRGB_Hagibis_remnants_Bering_Sea_anim.gif)
![Plots of rawinsonde data at St. Paul Island [click to enlarge]](https://cimss.ssec.wisc.edu/satellite-blog/wp-content/uploads/sites/5/2019/10/191014_PASN_RAOBS.GIF)
![Suomi NPP VIIRS Day/Night Band (0.7 µm) images at 2319 UTC on 15 October and 0100 UTC on 16 October [click to enlarge]](https://cimss.ssec.wisc.edu/satellite-blog/wp-content/uploads/sites/5/2019/10/191015_suomiNPP_viirs_dayNightBand_Higibis_remnants_Russia_landfall_anim.gif)
![GOES-16 Mid-level Water Vapor (6.9 µm) images, with hourly surface weather type plotted in red [click to play animation | MP4]](https://cimss.ssec.wisc.edu/satellite-blog/wp-content/uploads/sites/5/2019/10/191009_191012_goes16_waterVapor_surfaceWeatherType_anim.gif)
![GOES-16 "Red" Visible (0.64 µm) images on 10/11/12 October, with hourly precipitation type plotted in red [click to play animation | MP4]](https://cimss.ssec.wisc.edu/satellite-blog/wp-content/uploads/sites/5/2019/10/191010_191012_goes16_visible_surfaceWeatherType_anim.gif)

![GOES-16 "Red" Visible (0.64 µm, left) and Mid-level Water Vapor (6.9 µm, right) images, with GLM Groups plotted in red [click to play animation | MP4]](https://cimss.ssec.wisc.edu/satellite-blog/wp-content/uploads/sites/5/2019/10/191011_goes16_visible_waterVapor_glm_ND_MN_MB_anim.gif)
![GOES-16 Mid-level Water Vapor (6.9 µm) images, with 295 K equivalent potential temperature contours plotted in yellow and surface fronts plotted in red [click to play animation | MP4]](https://cimss.ssec.wisc.edu/satellite-blog/wp-content/uploads/sites/5/2019/10/191011_goes16_waterVapor_thetaE_Upper_Midwest_trowal_anim.gif)
![GOES-16 Mid-level Water Vapor (6.9 µm) images, with 295 K Specific Humidity contours plotted in yellow and surface fronts plotted in red [click to play animation | MP4]](https://cimss.ssec.wisc.edu/satellite-blog/wp-content/uploads/sites/5/2019/10/191011_goes16_waterVapor_295K_specificHumidity_Upper_Midwest_trowal_anim.gif)
![GOES-16 Mid-level Water Vapor (6.9 µm) images, with surface frontal positions [click to play animation]](https://cimss.ssec.wisc.edu/satellite-blog/wp-content/uploads/sites/5/2019/10/191012_goes16_waterVapor_fronts_anim.gif)
![GOES-16 Day Cloud Phase Distinction RGB images [click to play animation | MP4]](https://cimss.ssec.wisc.edu/satellite-blog/wp-content/uploads/sites/5/2019/10/191018_goes16_dayCloudPhaseDistinctionRGB_ND_MB_anim.gif)

