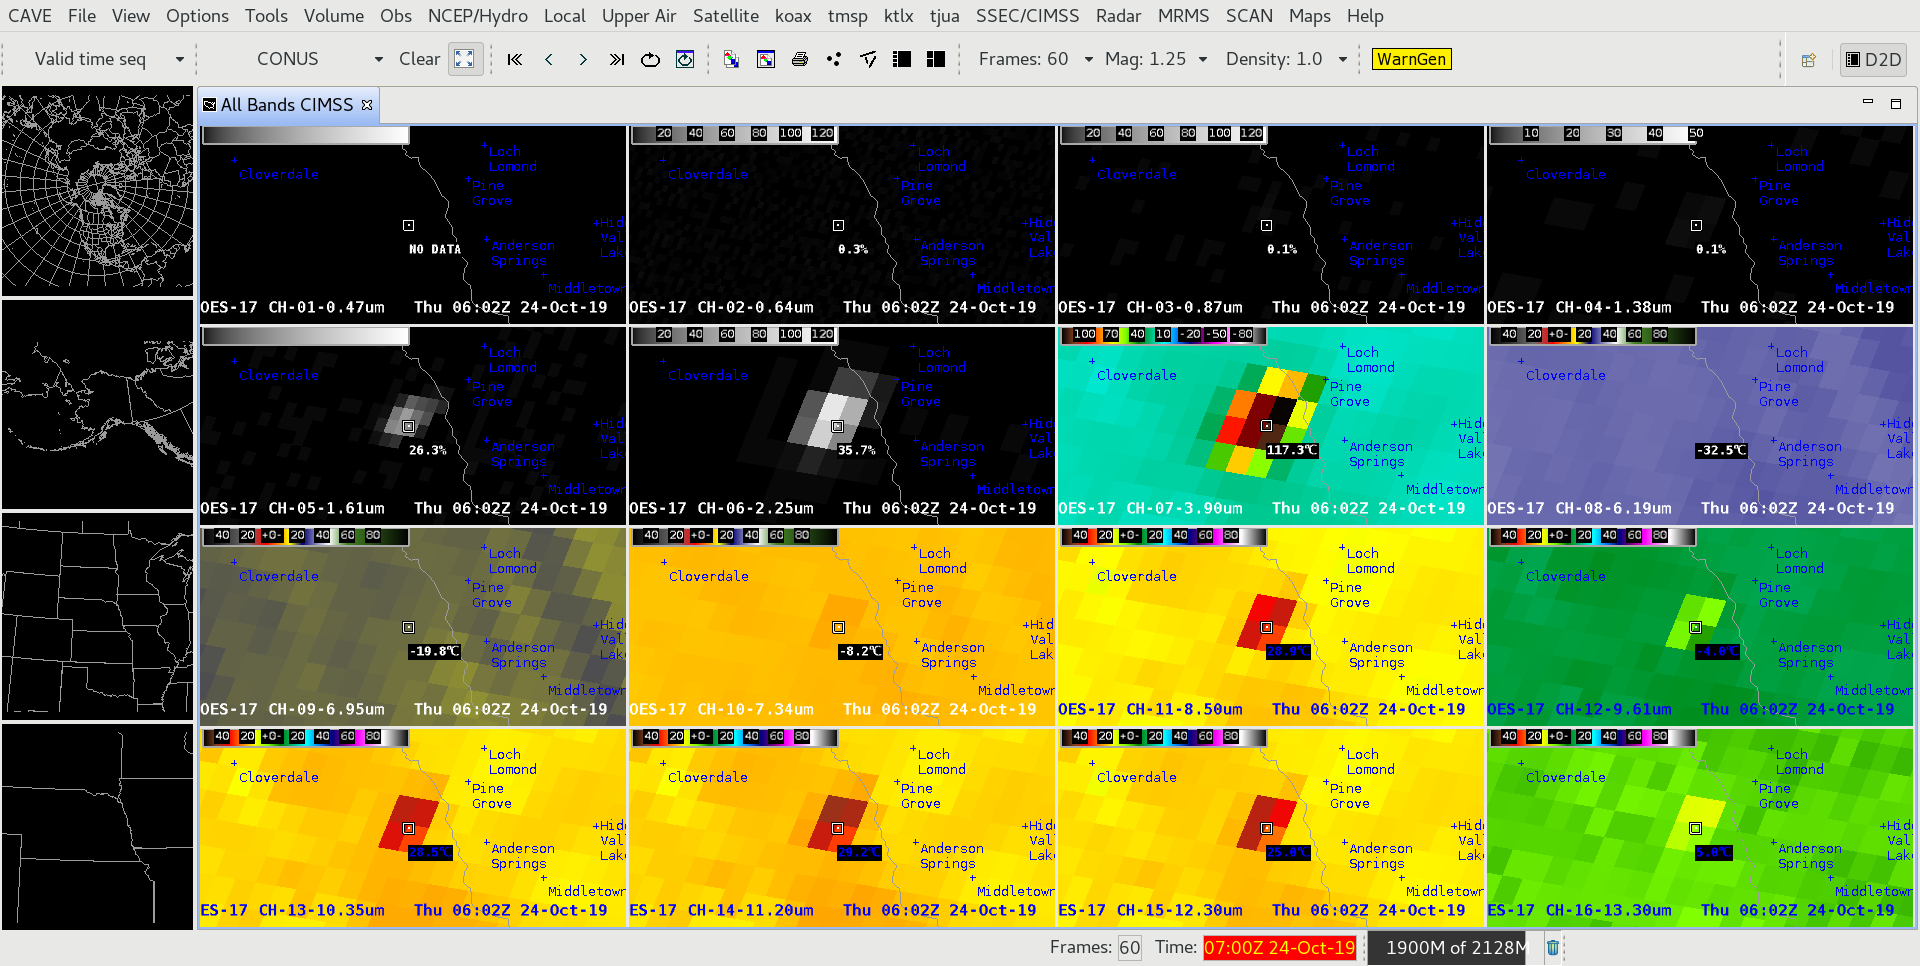
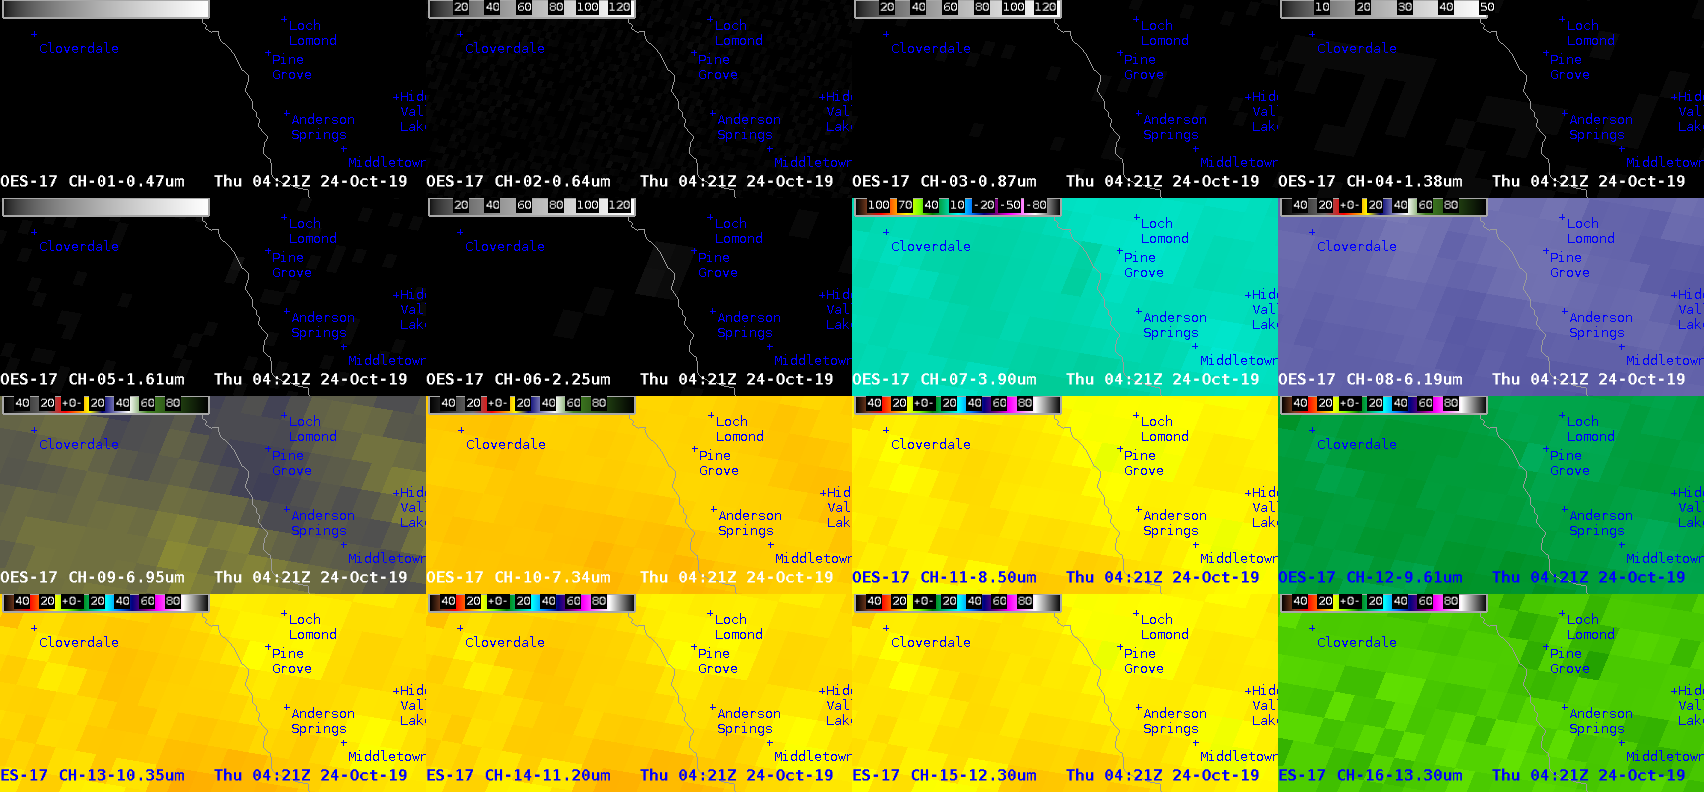
1-minute interval (and 30-second interval, beginning at 0730 UTC) Mesoscale Domain Sector GOES-17 (GOES-West) multi-panel images showing all 16 ABI spectral bands (above) revealed the hot thermal signature of the Kincade Fire in Northern California on 24 October 2019. The fire thermal anomaly first became evident in Shortwave Infrared and Near-Infrared imagery at 0421 UTC... Read More
![GOES-17 multi-panel images showing all 16 ABI spectral bands [click to play animation | MP4]](https://cimss.ssec.wisc.edu/satellite-blog/wp-content/uploads/sites/5/2019/10/ca_16p-20191024_060357.png)
GOES-17 multi-panel images showing all 16 ABI spectral bands [click to play animation | MP4]
1-minute interval (and 30-second interval, beginning at 0730 UTC)
Mesoscale Domain Sector GOES-17
(GOES-West) multi-panel images showing all 16
ABI spectral bands
(above) revealed the hot thermal signature of the
Kincade Fire in Northern California on
24 October 2019. The fire thermal anomaly first became evident in Shortwave Infrared and Near-Infrared imagery at 0421 UTC or 9:21 PM PDT on 23 October (
0421 UTC image |
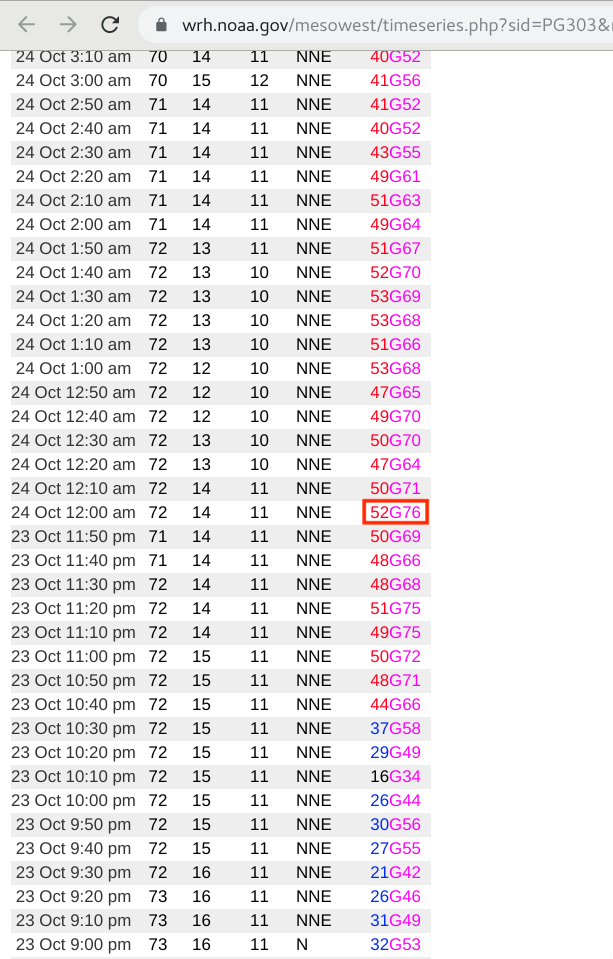
6-minute animation). A weather station close to the fire (
Healdsburg Hills) recorded
winds gusting to 76 mph less than 2 hours after the fire started; at that time, the Relative Humidity was only 11%. Above-normal temperatures were also present across that region of California, with Downtown Oakland setting a daily record high of 89ºF.
At times the fire’s hot thermal emissions were detected by 13 of the 16 spectral bands — including very subtle signatures in the “Red” Visible (0.64 µm), Near-Infrared “Vegetation” (0.86 µm) and “Cirrus” (1.38 µm), and Low-level Water Vapor (7.34 µm) bands (below). The hottest Shortwave Infrared (3.9 µm) brightness temperature observed was 138.7ºC (411.9 K), which is the saturation temperature for those ABI detectors.
Since overlapping 1-minute GOES-17 Mesoscale Sectors provided 30-second Visible images, the westward transport of dense smoke from the fire source could be followed in great temporal and spatial detail (below). Note that a ship about 50 miles offshore reported smoke at 18 UTC. Just south of the dense plume, smoke was being reported at Santa Rosa — but the surface visibility remained at 10 miles.
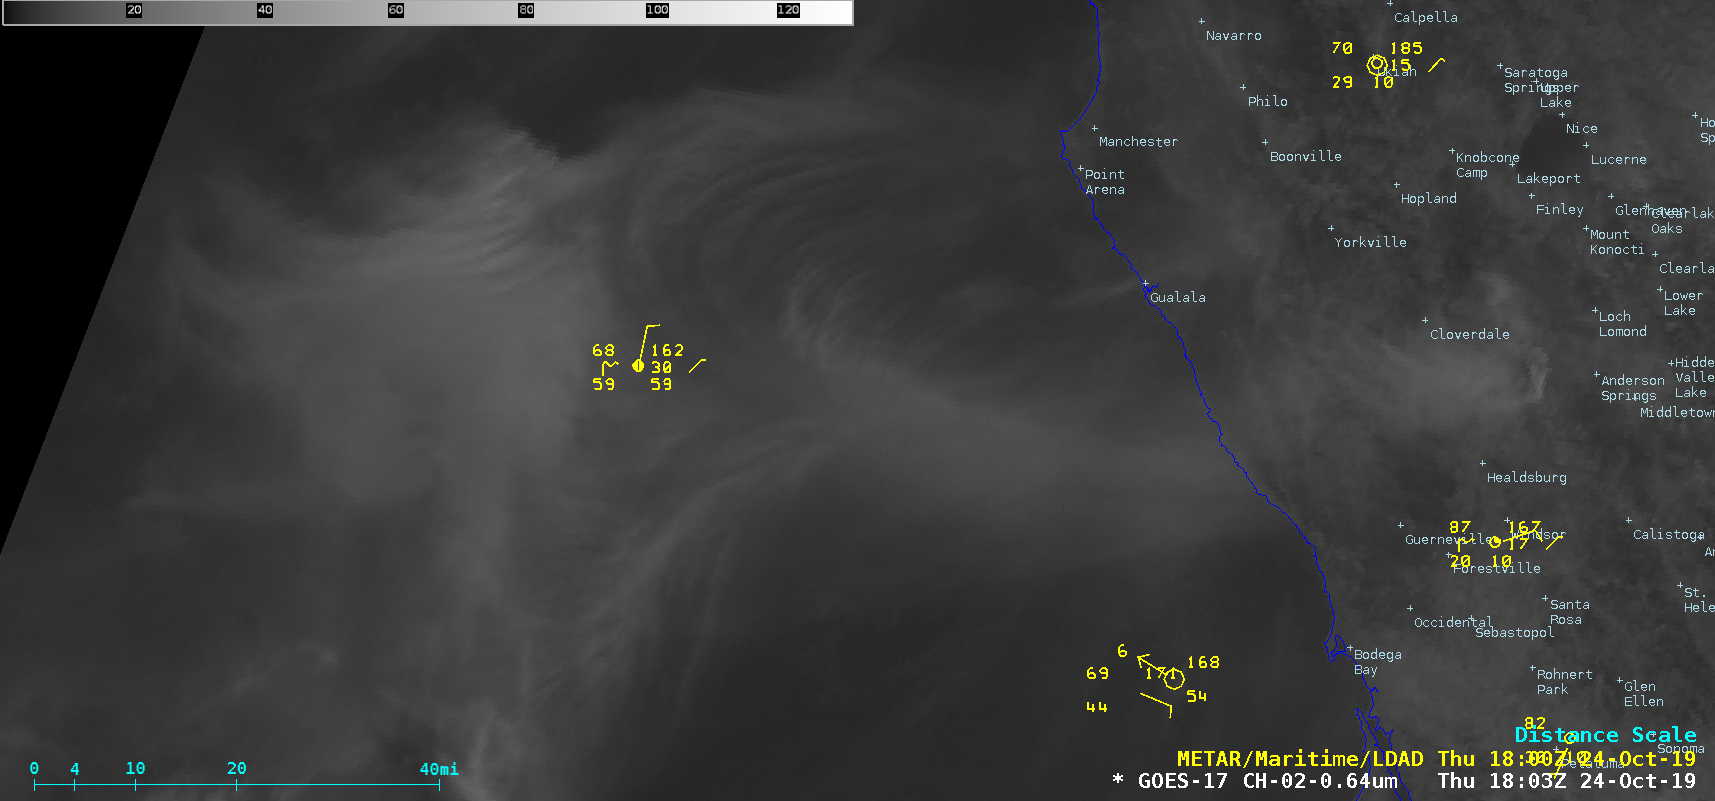
GOES-17 “Red” Visible (0.64 µm) images, with surface reports plotted in yellow [click to play animation | MP4]
A larger-scale view using the GOES-17
CIMSS Natural Color Red-Green-Blue (RGB) product
(below) indicated that smoke had been transported about 400 miles offshore by 20 UTC.
![GOES-17 CIMSS Natural Color RGB images [click to play animation | MP4]](https://cimss.ssec.wisc.edu/satellite-blog/wp-content/uploads/sites/5/2019/10/ca_rgb-20191024_201119.png)
GOES-17 CIMSS Natural Color RGB images [click to play animation | MP4]
A toggle between Terra MODIS True Color and False Color RGB images from the
MODIS Today site
(below) provided a more detailed view of the smoke plume and the thermal anomaly
(shades of pink to red) associated with the large Kincade Fire (as well as the much smaller Muir Fire near the coast, north of San Francisco).
![Terra MODIS True Color and False Color RGB images [click to enlarge]](https://cimss.ssec.wisc.edu/satellite-blog/wp-content/uploads/sites/5/2019/10/191024_1826utc_terra_modis_truecolor_falsecolor_CA_anim.gif)
Terra MODIS True Color and False Color RGB images at 1826 UTC [click to enlarge]
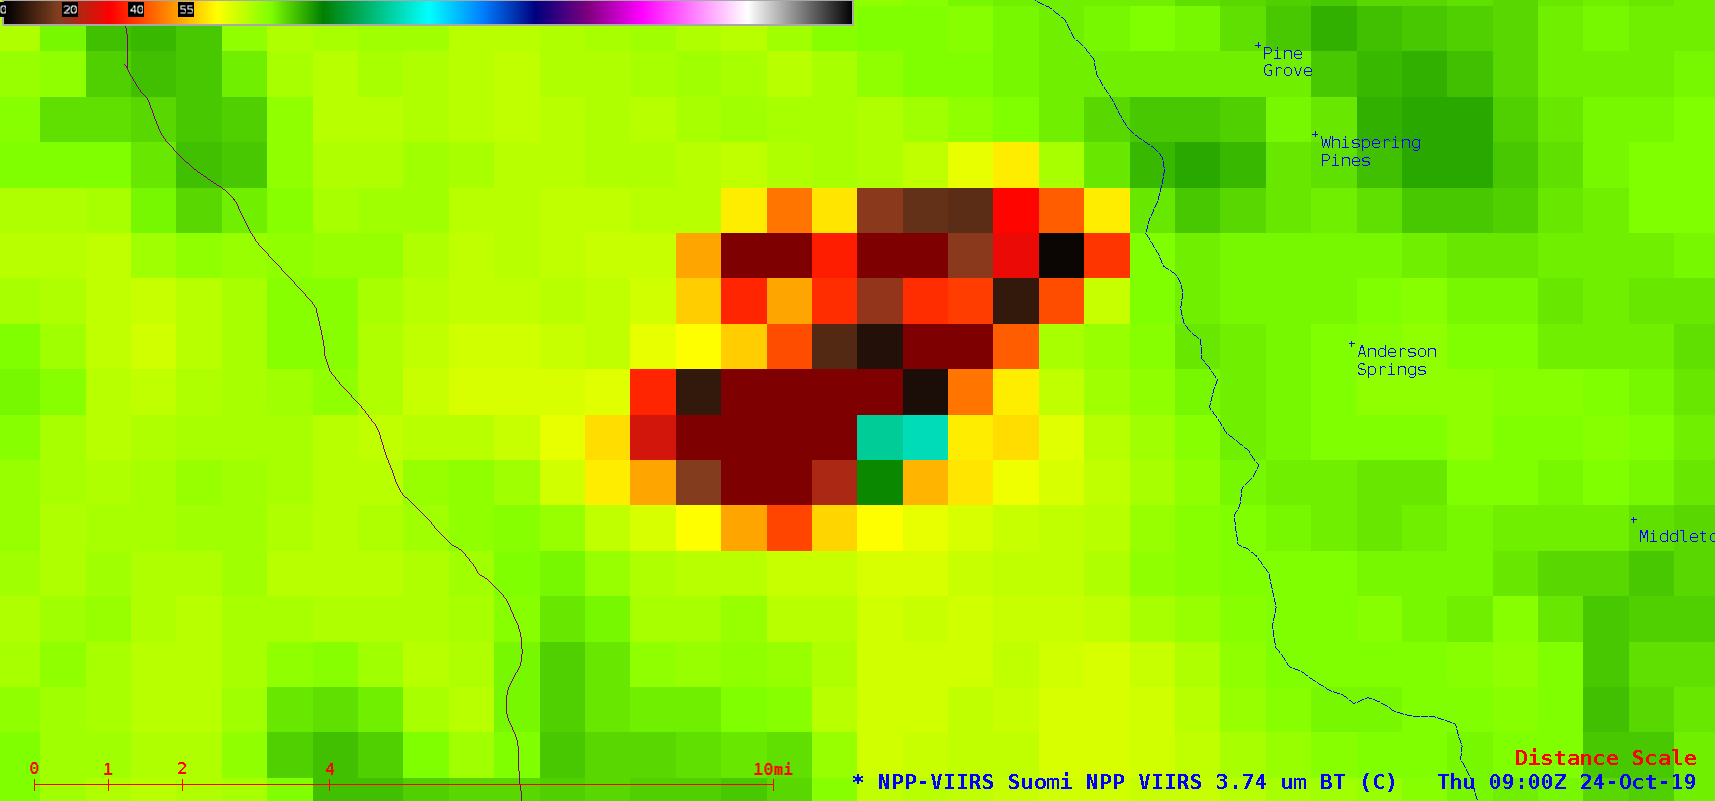
A comparison of Suomi NPP VIIRS Shortwave Infrared (3.74 µm) images at 0900 and 2023 UTC
(below) showed the expansion of the fire’s thermal anomaly
(red to black pixels) during that ~11.5 hour period.
![Suomi NPP VIIRS Shortwave Infrared (3.74 µm) images at 0900 and 2023 UTC [click to enlarge]](https://cimss.ssec.wisc.edu/satellite-blog/wp-content/uploads/sites/5/2019/10/191024_suomiNPP_viirs_shortwaveInfrared_Kincade_Fire_CA_anim.gif)
Suomi NPP VIIRS Shortwave Infrared (3.74 µm) images at 0900 and 2023 UTC; the solid violet line west of the fire is California Highway 101. [click to enlarge]
View only this post
Read Less
![GOES-17 multi-panel images showing all 16 ABI spectral bands [click to play animation | MP4]](https://cimss.ssec.wisc.edu/satellite-blog/wp-content/uploads/sites/5/2019/10/191024_goes17_16panel_Kincade_Fire_CA_anim.gif)

![GOES-17 CIMSS Natural Color RGB images [click to play animation | MP4]](https://cimss.ssec.wisc.edu/satellite-blog/wp-content/uploads/sites/5/2019/10/191024_goes17_naturalColorRGB_Kincade_Fire_CA_anim.gif)

![NOAA-20 VIIRS Day/Night Band (0.7 µm) and Infrared Window (11.45 µm) images (credit: William Straka, CIMSS) [click to enlarge]](https://cimss.ssec.wisc.edu/satellite-blog/wp-content/uploads/sites/5/2019/10/191022_1543utc_noaa20_viirs_dayNightBand_infraredWindow_Bualoi_anim.gif)
![Himawari-8 Upper-level Water Vapor (6.2 µm) images [click to play animation | MP4]](https://cimss.ssec.wisc.edu/satellite-blog/wp-content/uploads/sites/5/2019/10/191020_191022_himawari8_upperLevelWaterVapor_Australia_anim.gif)
![Himawari-8 Mid-level Water Vapor (6.9 µm) images [click to play animation | MP4]](https://cimss.ssec.wisc.edu/satellite-blog/wp-content/uploads/sites/5/2019/10/191020_191022_himawari8_midLevelWaterVapor_Australia_anim.gif)
![GOES-16 “Clean” Infrared Window (10.35 µm) images, with SPC Storm Reports plotted in cyan [click to play animation | MP4]](https://cimss.ssec.wisc.edu/satellite-blog/wp-content/uploads/sites/5/2019/10/191020_goes16_infrared_spcStormReports_DFW_zoom_v2_anim.gif)
![GOES-16 “Clean” Infrared Window (10.35 µm) images, with SPC Storm Reports plotted in white [click to play animation | MP4]](https://cimss.ssec.wisc.edu/satellite-blog/wp-content/uploads/sites/5/2019/10/191020_goes16_infrared_spcStormReports_OK_TX_AR_LA_anim.gif)
