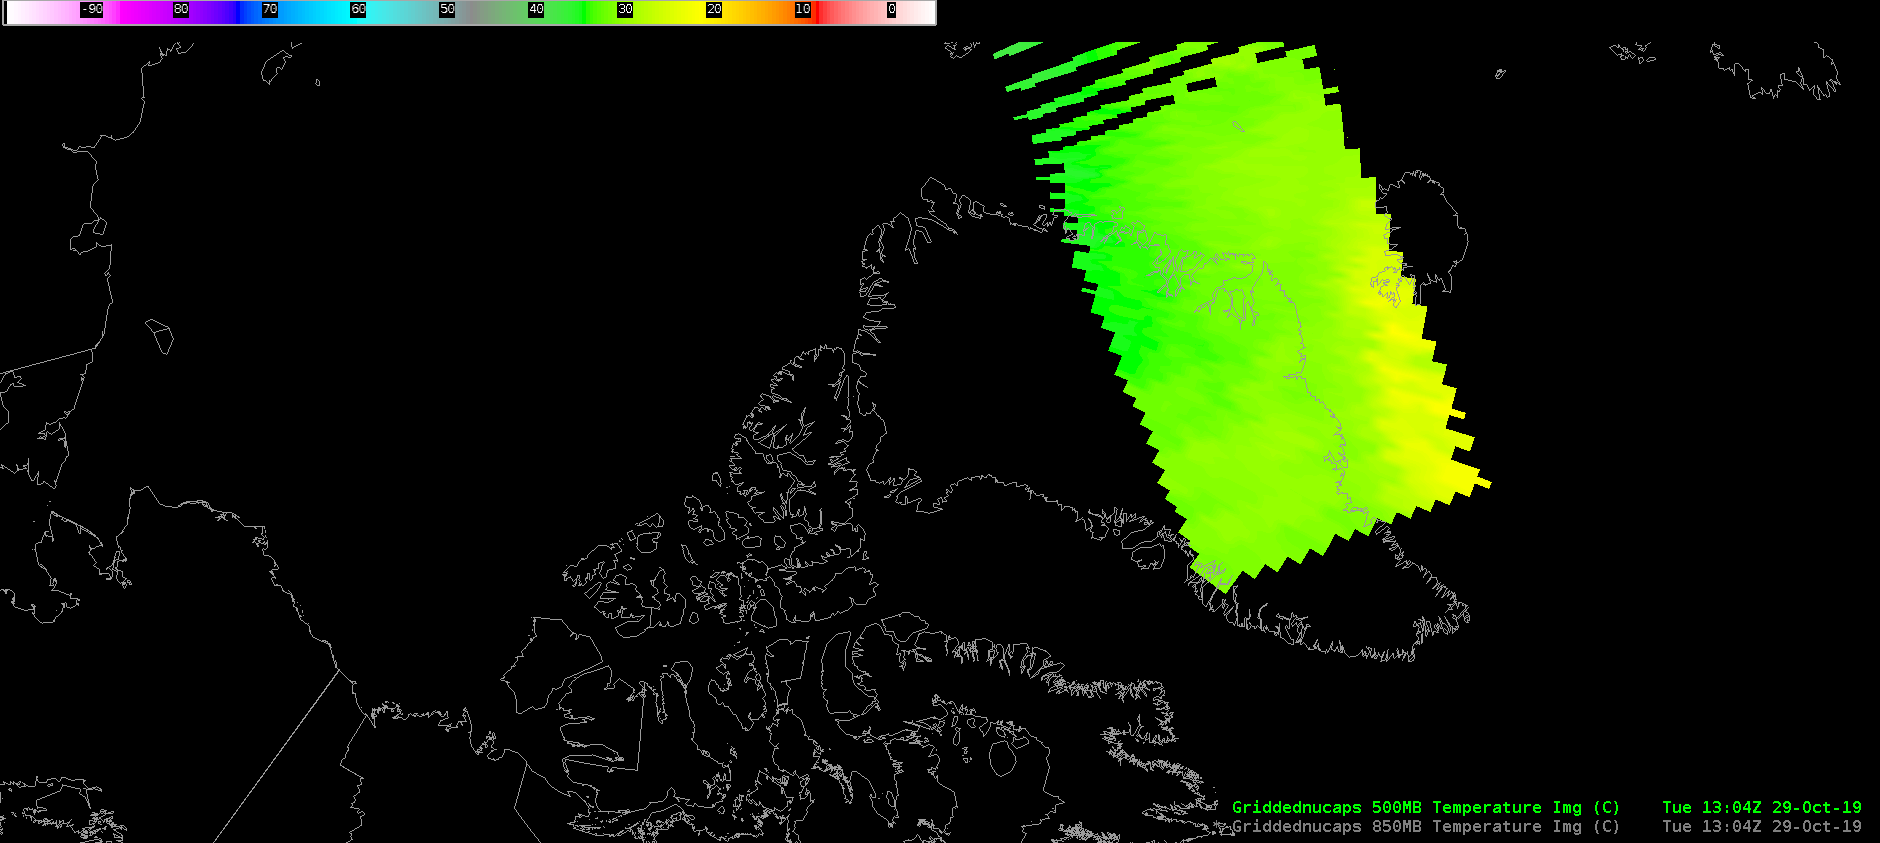
NUCAPS Sounding Availability points from AWIPS, 1304 UTC on 29 October 2019, and the Temperature at 500 hPa at the same time (Click to enlarge)
Gridded NUCAPS fields (Here’s a NASA SpoRT VLab page on the product) are now available in AWIPS, effective with AWIPS Build 19.3.1. The imagery above includes a swath of NUCAPS points (called up via ‘NUCAPS Sounding Availability’) under the Satellite Tab, and the ‘S-NPP and NOAA-20’ choice there (even though, at present, only NOAA-20 NUCAPS profiles are supplied to AWIPS). A ‘Gridded NUCAPS’ choice is available right about the NUCAPS Sounding Availability, and this allows a user to choose Temperature, Dewpoint Temperature, Equivalent Potential Temperature, Lapse Rates (and more!) at different standard mandatory pressure levels (or layers, for Lapse Rates). Interpolation in the vertical has moved the native NUCAPS pressure levels (mentioned here) to standard pressure levels.
The plot above also shows the temperature at 500 hPa for the same time, 1304 UTC. Gridded NUCAPS fields do not cover the entire extent of the NUCAPS Sounding Availability plots. In addition, values are present for all sounding color dot points — green, yellow and red — on the theory that a user can identify the bad data visually.
The animation below shows a series of gridded fields over northern Canada, covering much of the the Sounding Availability plot. Because of the timestamps on these different grids, they do not all time match the swath of NUCAPS Sounding Availability points. On this day, the size of some of the fields produced was quite small. The size of the gridded region is limited by computational resources on AWIPS, and the upper limit is 20 lines of NUCAPS soundings — 600 soundings total that are horizontally and vertically interpolated. The size is also affected by the order in which the soundings appear in AWIPS. If a small chunk (say, 7 lines of soundings) comes in, then that small chunk will be processed into a horizontal grid. It’s more common that grid sizes will be closer to what occurred at 1304 UTC.

Temperature at 500 mb from NUCAPS Soundings, 1304 – 1311 UTC on 29 October 2019 (Click to enlarge)
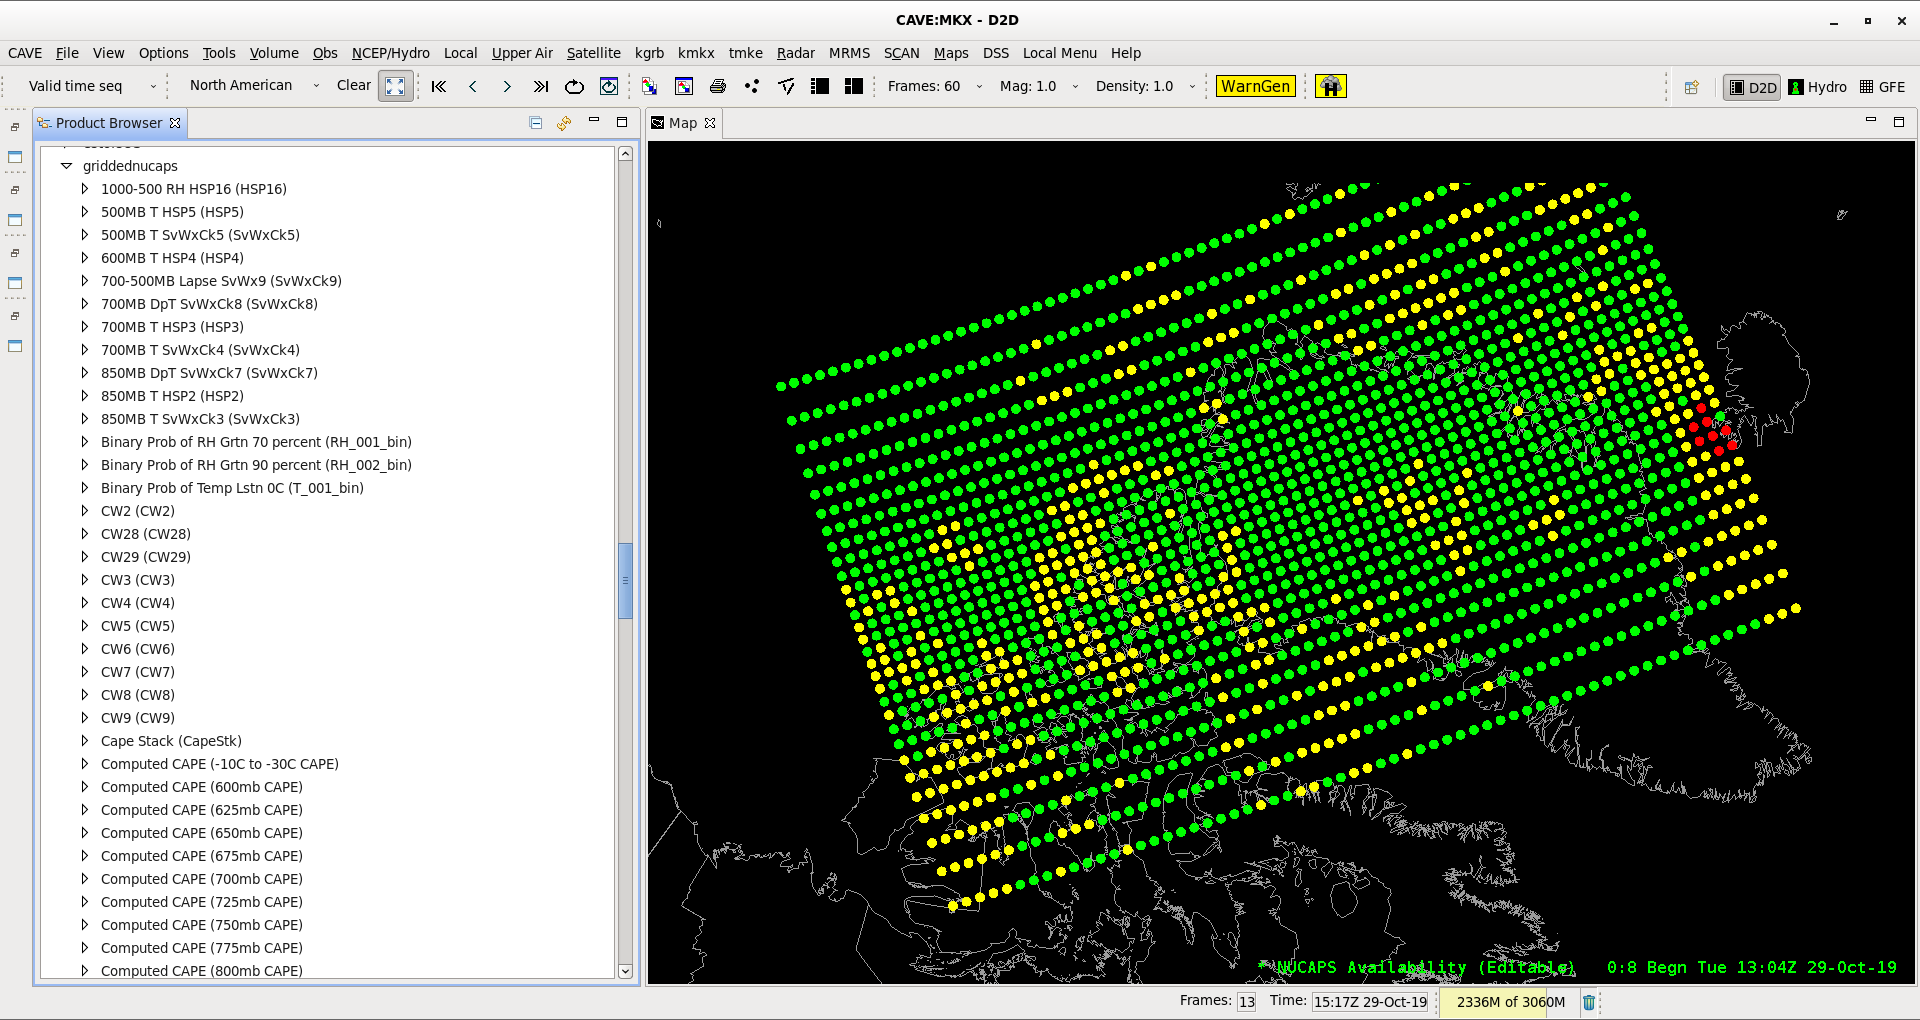
If you look in the Product Browser on AWIPS, you will find far more data than are available under the ‘Gridded NUCAPS’ menu under ‘NOAA-20 and S-NPP’ under the satellite tab. (Here’s just a small sample!) For example, you can plot Ozone estimates from NUCAPS, as shown below — loaded as a grid then converted to an image. Expect the presentation of NUCAPS horizontal fields in AWIPS to evolve with time. In the meantime, this is a valuable data set to determine (for example) the likelihood of snow v. rain based on the 925 Temperature and Dewpoint Depression.
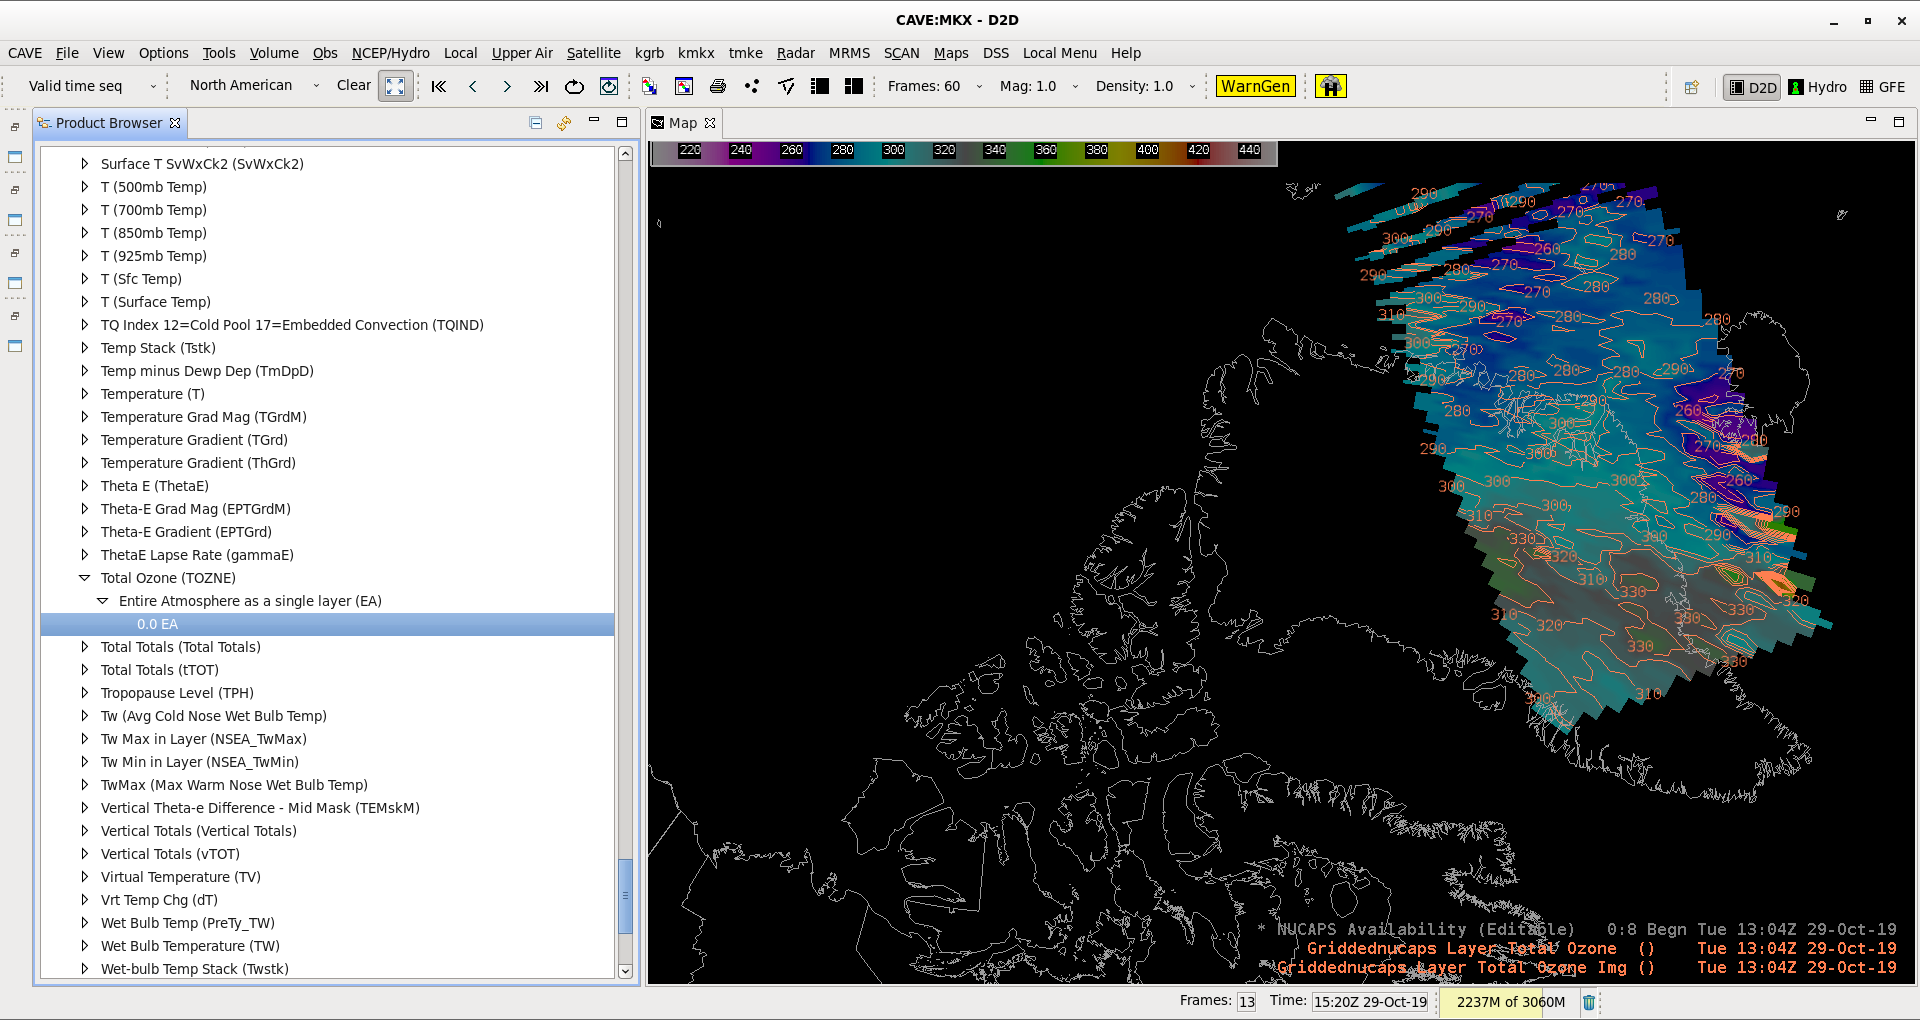
AWIPS Product Browser showing Ozone Estimates at 1304 UTC on 29 October 2019 (Click to enlarge)
(Thanks to Dr. Emily Berndt, NASA SpoRT, for clarifying remarks. Any errors that remain are the author’s, however! Imagery courtesy NWS MKX)
View only this post Read Less
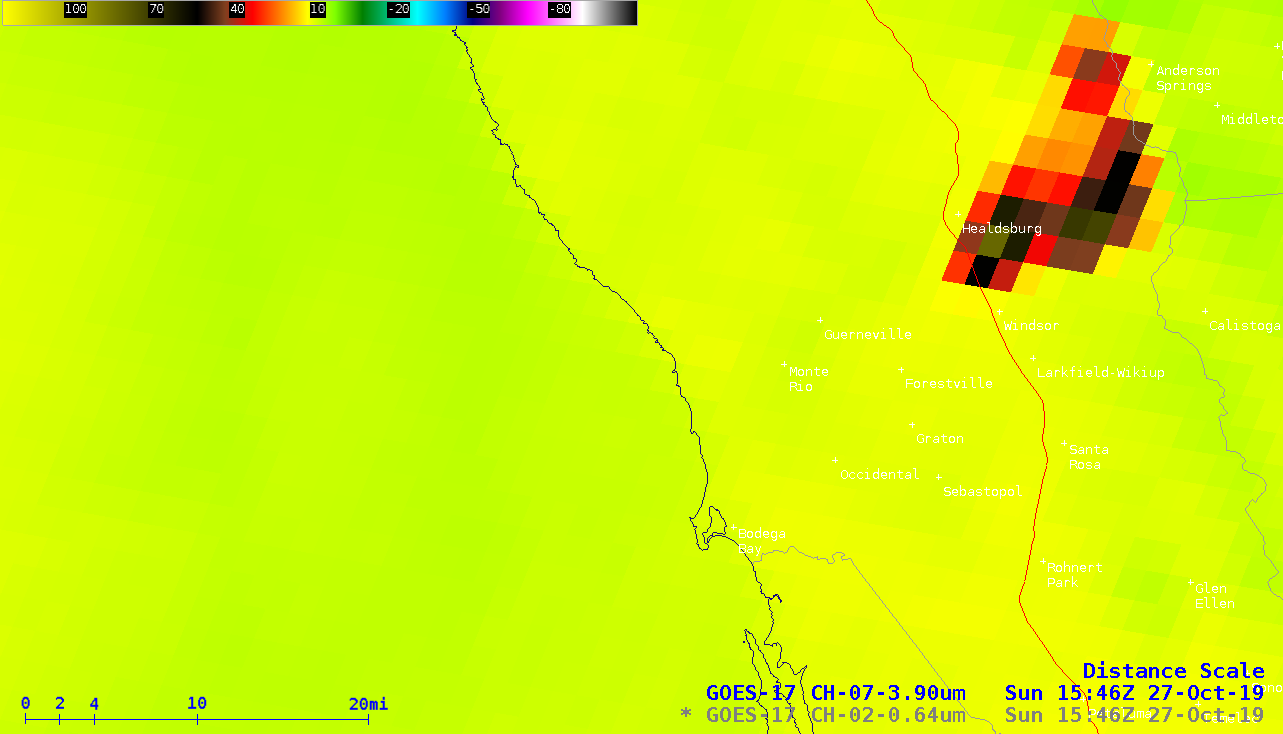
![GOES-17 Shortwave Infrared (3.9 µm) and “Red” Visible (0.64 µm) images [click to play animation | MP4]](https://cimss.ssec.wisc.edu/satellite-blog/wp-content/uploads/sites/5/2019/10/191027_goes17_shortwaveInfrared_visible_Kincade_Fire_CA_anim.gif)
![GOES-17 True Color RGB images [click to play animation | MP4]](https://cimss.ssec.wisc.edu/satellite-blog/wp-content/uploads/sites/5/2019/10/191027_goes17_trueColorRGB_Kincade_Fire_CA_anim.gif)
![VIIRS Shortwave Infrared (3.74 µm) images from Suomi NPP and NOAA-20 [click to enlarge]](https://cimss.ssec.wisc.edu/satellite-blog/wp-content/uploads/sites/5/2019/10/191026_191027_viirs_shortwaveInfrared_Kincade_Fire_CA_anim.gif)
![GOES-16 “Red” Visible (0.64 µm, left) and “Clean” Infrared Window (10.3 µm, right) images [click to play animation | MP4]](https://cimss.ssec.wisc.edu/satellite-blog/wp-content/uploads/sites/5/2019/10/191025_goes16_visible_infrared_TS_Pablo_anim.gif)
![Suomi NPP VIIRS True Color RGB and Infrared Window (11.45 µm) images [click to enlarge]](https://cimss.ssec.wisc.edu/satellite-blog/wp-content/uploads/sites/5/2019/10/191025_15utc_suomiNPP_viirs_trueColorRGB_infraredWindow_TS_Pablo_anim.gif)
![Suomi NPP VIIRS True Color RGB and Infrared Window (11.45 µm) images [click to enlarge]](https://cimss.ssec.wisc.edu/satellite-blog/wp-content/uploads/sites/5/2019/10/191025_15utc_suomiNPP_viirs_trueColorRGB_infraredWindow_large_scale_TS_Pablo_anim.gif)
![GOES-16 “Red” Visible (0.64 µm, top) and “Clean” Infrared Window (10.3 µm, bottom) images [click to play animation | MP4]](https://cimss.ssec.wisc.edu/satellite-blog/wp-content/uploads/sites/5/2019/10/191026_goes16_visible_infrared_TS_Pablo_anim.gif)
![GOES-16 “Clean” Infrared Window (10.3 µm) images [click to play animation | MP4]](https://cimss.ssec.wisc.edu/satellite-blog/wp-content/uploads/sites/5/2019/10/191026_goes16_infrared_Pablo_Azores_anim.gif)
