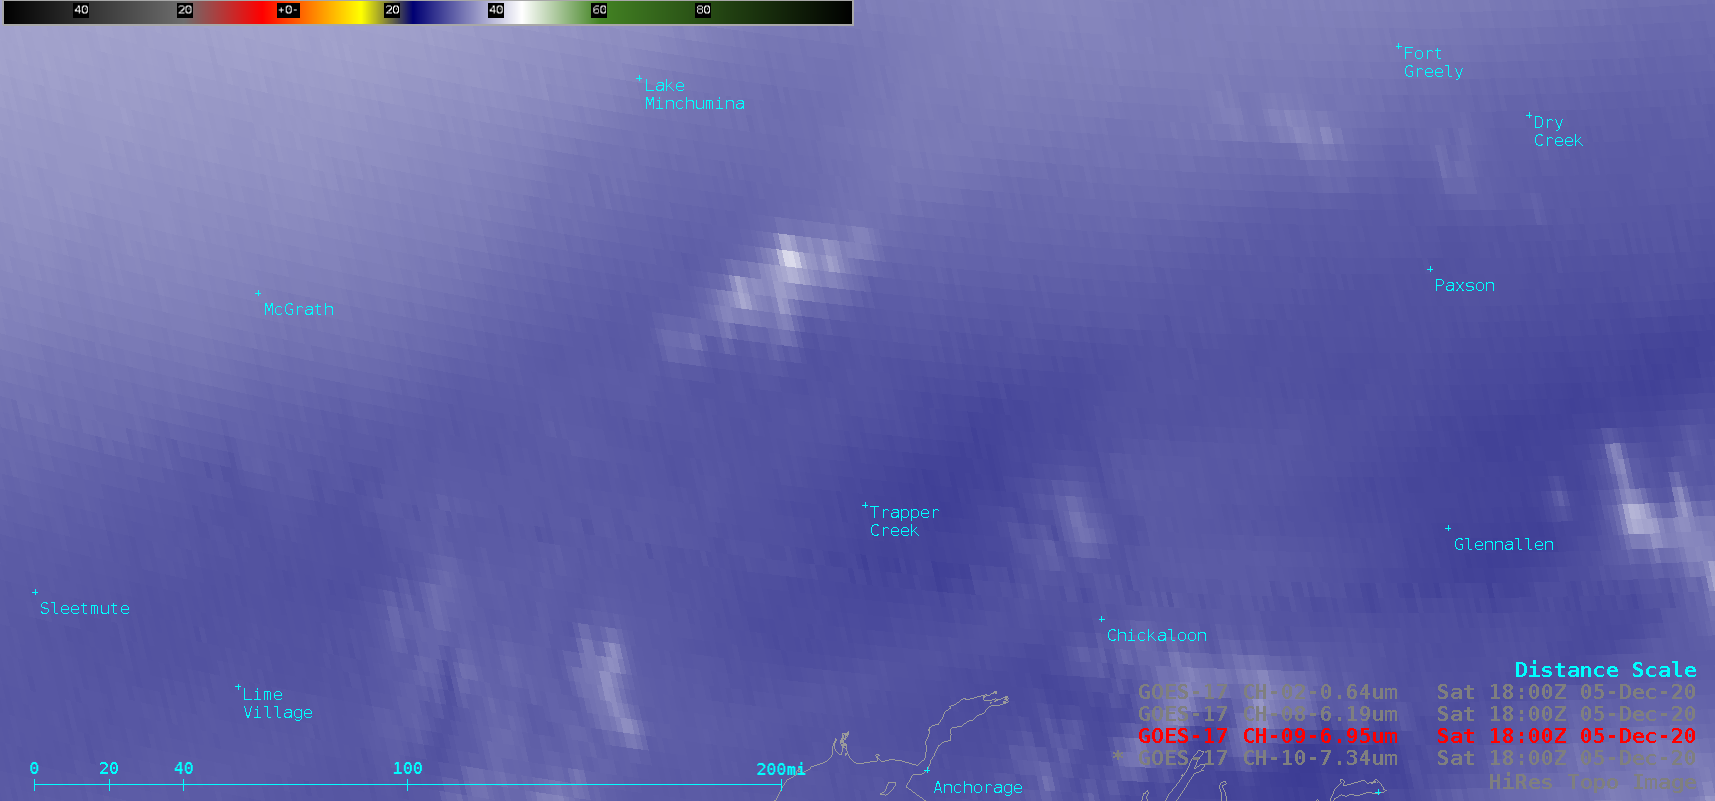
GOES-17 (GOES-West) Low-level (7.3 µm), Mid-level (6.9 µm) and Upper-level (6.2 µm) Water Vapor images (above) revealed cold thermal signatures (brighter shades of white) associated with the highest-elevation portions of the Alaska Range on 05 December 2020. Note the slight northward shift (16-20 km, or 10-12 miles) in the apparent location of Denali... Read More
![GOES-17 Low-level (7.3 µm), Mid-level (6.9 µm) and Upper-level (6.2 µm) Water Vapor images, with topography [click to play animation | MP4]](https://cimss.ssec.wisc.edu/satellite-blog/images/2020/12/ak_wv9-20201205_180032.png)
GOES-17 Low-level (7.3 µm), Mid-level (6.9 µm) and Upper-level (6.2 µm) Water Vapor images, with topography [click to play animation | MP4]
GOES-17
(GOES-West) Low-level (
7.3 µm), Mid-level (
6.9 µm) and Upper-level (
6.2 µm) Water Vapor images
(above) revealed cold thermal signatures
(brighter shades of white) associated with the highest-elevation portions of the Alaska Range on 05 December 2020. Note the slight northward shift (16-20 km, or 10-12 miles) in the apparent location of Denali in the GOES-17 images, due to
parallax.
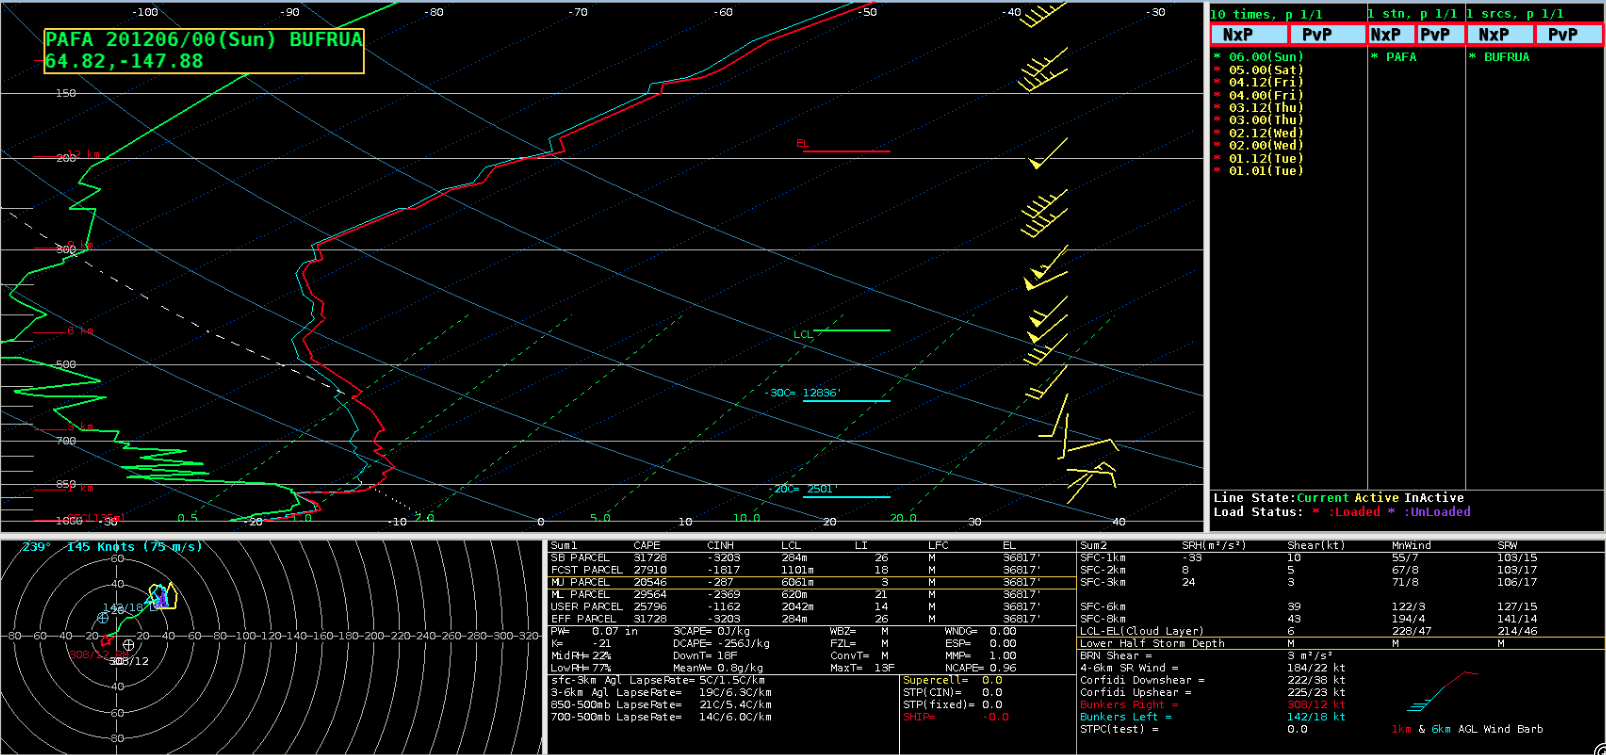
Plots of GOES-17 Water Vapor (ABI spectral band 8, 9 and 10) weighting functions calculated using 00 UTC rawinsonde data from Fairbanks (north of the Alaska Range) and from Anchorage (south of the Alaska Range) are shown below. Even with very large satellite viewing angles (or zenith angles) greater than 70 degrees — which would tend to shift the Water Vapor weighting function plots to higher altitudes — the presence of very dry air within much of the middle to upper troposphere had the effect of bringing the weighting function peaks downward to pressure levels corresponding to those of the higher elevations of the Alaska Range.
![GOES-17 Water Vapor weighting functions, calculated using 00 UTC rawinsonde data from Fairbanks [click to enlarge]](https://cimss.ssec.wisc.edu/satellite-blog/images/2020/12/201206_00utc_pafa_waterVapor_weightingFunctions.png)
GOES-17 Water Vapor weighting functions, calculated using 00 UTC rawinsonde data from Fairbanks [click to enlarge]
![GOES-17 Water Vapor weighting functions, calculated using 00 UTC rawinsonde data from Anchorage [click to enlarge]](https://cimss.ssec.wisc.edu/satellite-blog/images/2020/12/201206_00utc_panc_waterVapor_weightingFunctions.png)
GOES-17 Water Vapor weighting functions, calculated using 00 UTC rawinsonde data from Anchorage [click to enlarge]
The Total Precipitable Water (TPW) values seen on the 00 UTC Fairbanks and Anchorage soundings were 0.07 inch. However, a NOAA-20 NUCAPS sounding profile just 20-30 miles southwest of Denali around 12 UTC
(below) yielded TPW values of only 0.01 inch. The green color of that sounding point indicated successful retrievals from both the Cross-track Infrared Sounder (
CrIS) and Advanced Technology Microwave Sounder (
ATMS) instruments.
![GOES-17 Water Vapor (6.9 µm) image with plots of available 12 UTC NOAA-20 NUCAPS sounding points [click to enlarge]](https://cimss.ssec.wisc.edu/satellite-blog/images/2020/12/ak_wv9_nucaps-20201205_121032.png)
GOES-17 Water Vapor (6.9 µm) image, with plots of available 12 UTC NOAA-20 NUCAPS sounding points [click to enlarge]
![NOAA-20 NUCAPS profile just southwest of Denali around 12 UTC [click to enlarge]](https://cimss.ssec.wisc.edu/satellite-blog/images/2020/12/201205_12utc_nucaps_profile_SW_Denali.png)
NOAA-20 NUCAPS profile just southwest of Denali around 12 UTC [click to enlarge]
Another NOAA-20 NUCAPS green sounding profile just southwest of Denali around 22 UTC
(below) also yielded a TPW value of only 0.01 inch.
![GOES-17 Water Vapor (6.9 µm) image with plots of available 22 UTC NOAA-20 NUCAPS sounding points [click to enlarge]](https://cimss.ssec.wisc.edu/satellite-blog/images/2020/12/ak_wv9_nucaps-20201205_215031.png)
GOES-17 Water Vapor (6.9 µm) image, with plots of available 22 UTC NOAA-20 NUCAPS sounding points [click to enlarge]
![NOAA-20 NUCAPS profile just southwest of Denali around 22 UTC [click to enlarge]](https://cimss.ssec.wisc.edu/satellite-blog/images/2020/12/201205_22utc_nucaps_profile_SW_Denali.png)
NOAA-20 NUCAPS profile just southwest of Denali around 22 UTC [click to enlarge]
View only this post
Read Less
![GOES-17 Visible, Near-Infrared and Shortwave Infrared images [click to play animation | MP4]](https://cimss.ssec.wisc.edu/satellite-blog/images/2020/12/201209_goes17_visible_nearInfrared_shortwaveInfrared_SpaceX_Starship_landing_anim.gif)
![GOES-16 Visible, Near-Infrared and Shortwave Infrared images [click to play animation | MP4]](https://cimss.ssec.wisc.edu/satellite-blog/images/2020/12/201209_goes16_visible_nearInfrared_shortwaveInfrared_SpaceX_Starship_landing_anim.gif)
![Plot of 00 UTC rawinsonde data from Brownsville, Texas [click to enlarge]](https://cimss.ssec.wisc.edu/satellite-blog/images/2020/12/201210_00UTC_KBRO_RAOB.GIF)

![NOAA-20 VIIRS True Color and False Color RGB images [click to enlarge]](https://cimss.ssec.wisc.edu/satellite-blog/images/2020/12/201208_1923utc_noaa20_viirs_trueColorRGB_falseColorRGB_KS_OK_snowcover_anim.gif)
![GOES-16 Land Surface Temperature product [click to enlarge]](https://cimss.ssec.wisc.edu/satellite-blog/images/2020/12/ks_ok_lst-20201208_183112.png)
![GOES-16 Mid-level Water Vapor (6.9 µm) images, with plots of hourly surface weather type [click to play animation | MP4]](https://cimss.ssec.wisc.edu/satellite-blog/images/2020/12/201202_201203_goes16_waterVapor_surfaceWeatherType_anim.gif)
![NOAA-20 VIIRS True Color RGB images on 08 and 09 December [click to enlarge]](https://cimss.ssec.wisc.edu/satellite-blog/images/2020/12/201208_201209_viirs_trueColorRGB_KS_OK_snowcover_anim.gif)
![GOES-16 Nighttime Microphysics RGB images [click to play animation | MP4]](https://cimss.ssec.wisc.edu/satellite-blog/images/2020/12/201207_goes16_nighttimeMicrophysicsRGB_WV_powerplantplume_anim.gif)
![GOES-17 Low-level (7.3 µm), Mid-level (6.9 µm) and Upper-level (6.2 µm) Water Vapor images, with topography [click to play animation | MP4]](https://cimss.ssec.wisc.edu/satellite-blog/images/2020/12/201205_goes17_waterVapor_visible_Alaska_Range_anim.gif)
