Typhoon Chanhom south of Japan

Himawari-8 Target Sector over Typhoon Chanhom, 2314 UTC 8 October to 0532 UTC 9 October (Click to animate). Band 2, Visible (0.64 µm, upper left); Band 5 “Snow/Ice” (1.61 µm, upper right); Band 10, Low-level Water Vapor (7.3 µm, lower left); Band 13, Clean Window (10.4 µm, lower right)
Multi-spectral views from Himawari-8’s “Target Sector” that provides 2-minute imagery, above, show weakening Typhoon Chan-hom south of Japan. The Typhoon shows a sheared structure, with the surface circulation southwest of the main convection, a shift that is especially evident in the Band 5 1.61 µm channel that differentiates between low clouds containing water droplets and upper clouds containing ice crystals. (Himawari data courtesy of the Japan Meteorological Agency.) A 24-hour animation (ending at 0500 UTC on 9 October) of Mimic Total Precipitable water (from this site) shows that the storm is surrounded by dry air to the north and west.
An analysis of Advanced Microwave Sounder Unit (AMSU) Channel 7 (54.94 GHz), below, (from this site) shows a warm anomaly over the storm. Atmospheric shear (200-850 mb) is also shown in this figure, and the storm is approaching a region of high shear.
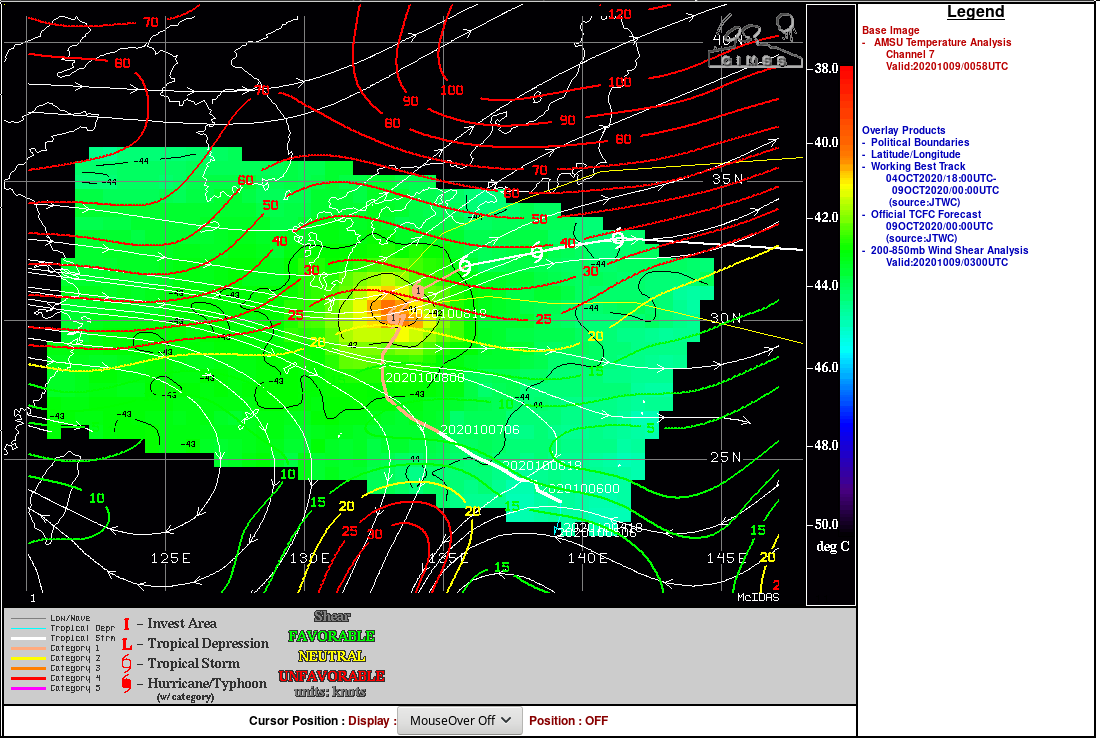
AMSU Channel 7 temperatures, 0058 UTC on 9 October 2020; Wind shear (contoured in green, yellow and red) from 850-200 mb, 0300 UTC on 9 October 2020 (Click to enlarge)