This website works best with a newer web browser such as Chrome, Firefox, Safari or Microsoft
Edge. Internet Explorer is not supported by this website.
As discussed on the Satellite Liaison Blog, wildfires driven by strong Santa Ana winds developed after sunset on 02 December — and 1-minute Mesoscale Domain Sector GOES-17 (GOES-West) “Red” Visible (0.64 µm) and Shortwave Infrared (3.9 µm) images (above) displayed the thermal anomalies and smoke plumes associated with larger fires that persisted into the subsequent daytime hours on 03 December 2020.GOES-17... Read More
GOES-17 “Red” Visible (0.64 µm) and Shortwave Infrared (3.9 µm) images [click to play animation | MP4]
As discussed on the Satellite Liaison Blog, wildfires driven by strong Santa Ana winds developed after sunset on 02 December — and 1-minute Mesoscale Domain Sector GOES-17 (GOES-West) “Red” Visible (0.64 µm) and Shortwave Infrared (3.9 µm) images (above) displayed the thermal anomalies and smoke plumes associated with larger fires that persisted into the subsequent daytime hours on 03 December 2020.
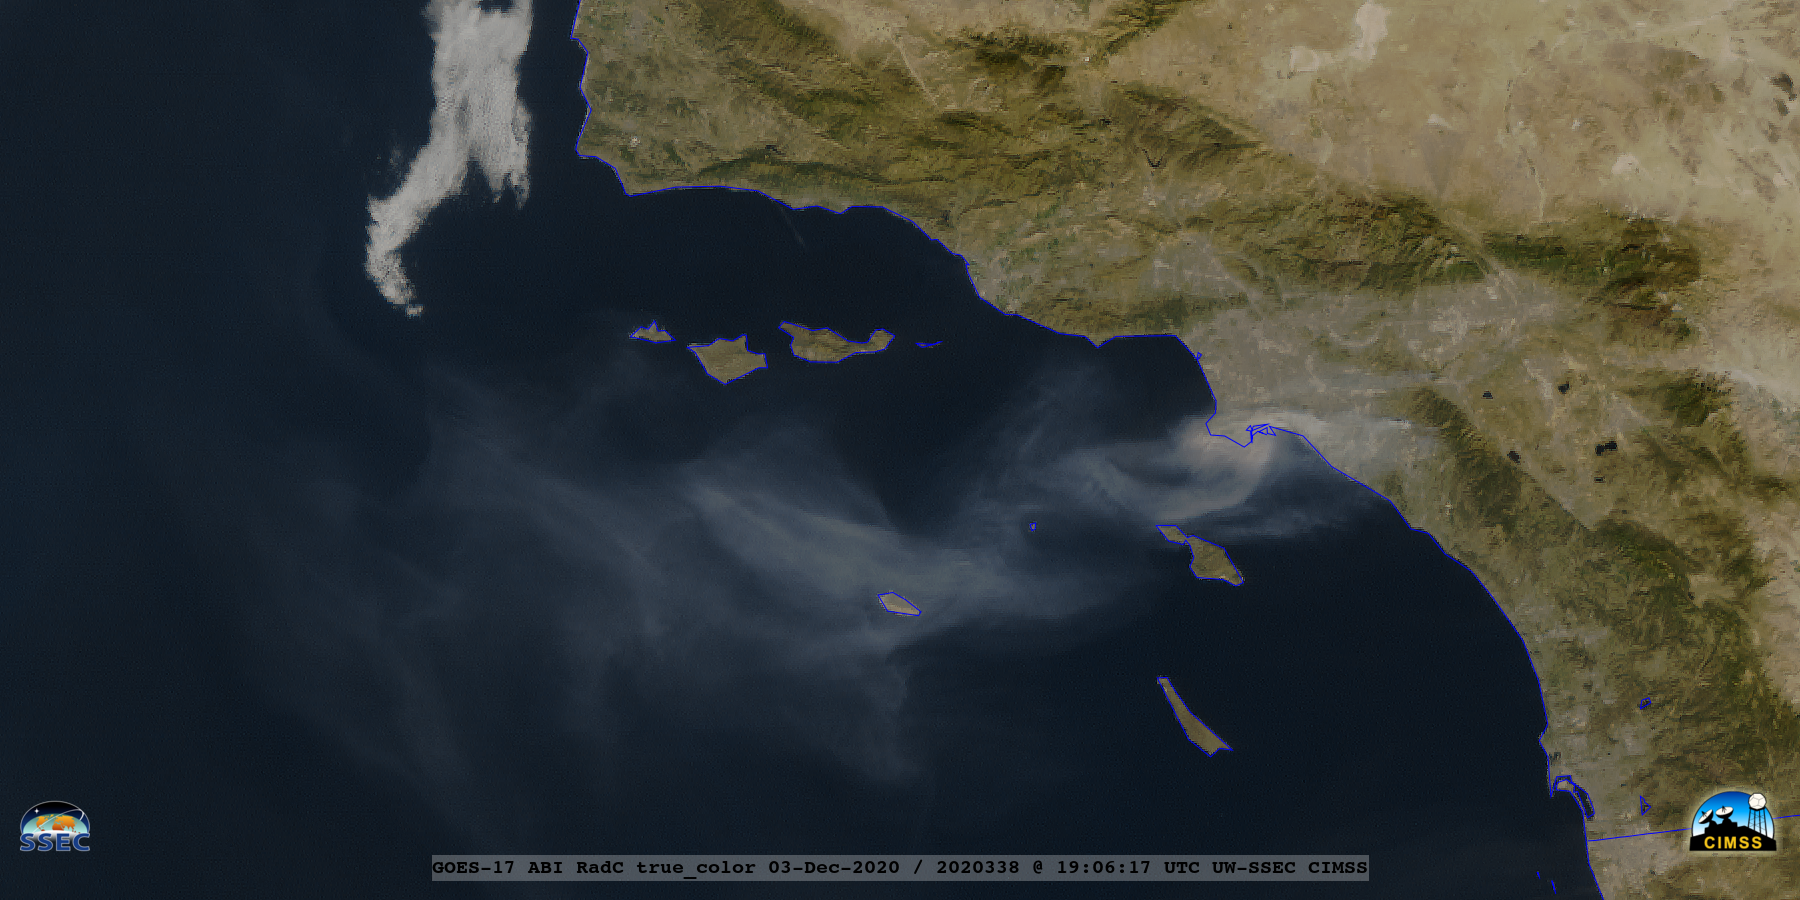
GOES-17 True Color Red-Green-Blue (RGB) images created using Geo2Grid(below) showed the offshore transport of wildfire smoke during the day.
GOES-17 True Color RGB images [click to play animation | MP4]
A before (24 November) / after (03 December) comparison of 30-meter resolution Landsat-8 False Color RGB images viewed using RealEarth(below) revealed the appearance of burn scars (darker shades of brown), active fire fronts (brighter shades of pink) and smoke plumes (shades of gray) associated with the Bond Fire east of Santa Ana and the smaller Airport Fire northwest of Corona.
Landsat-8 False Color RGB images, 24 November vs 03 December 2020 [click to enlarge]
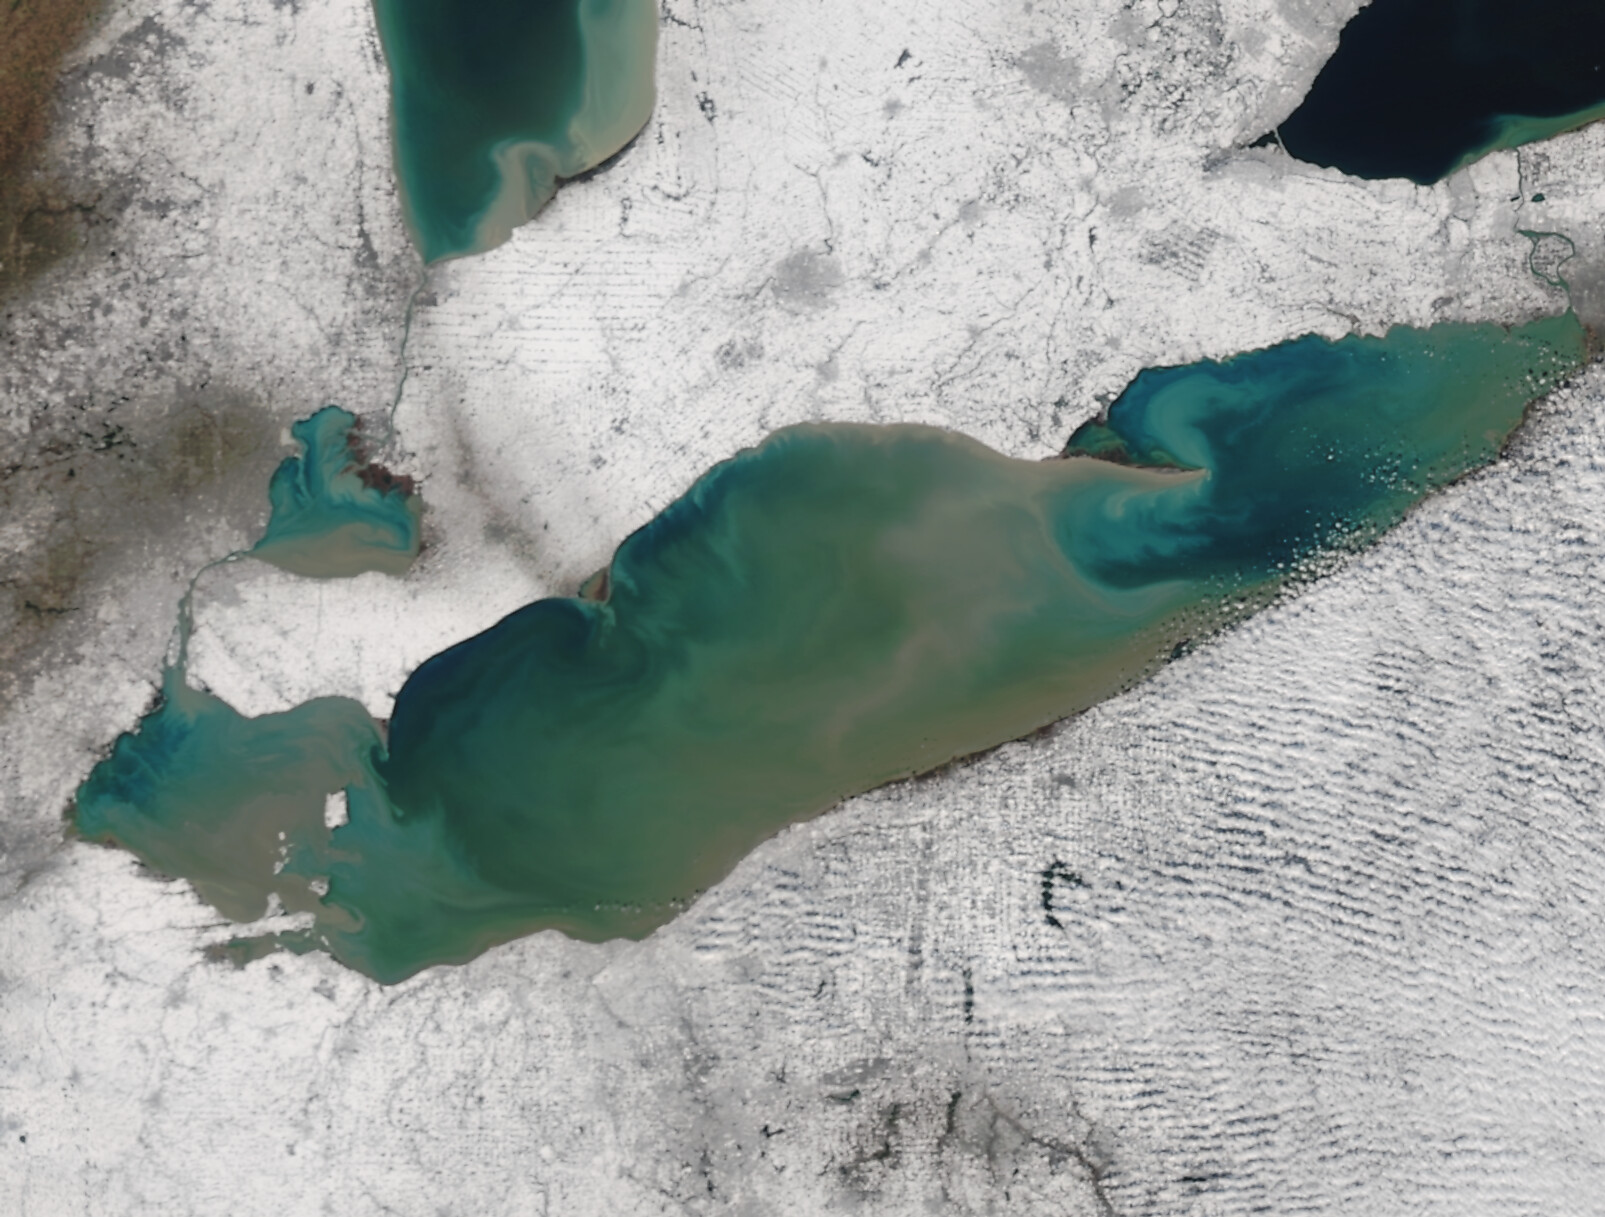
NOAA-20’s early afternoon pass over Lake Erie on 2 December 2020 produced a stunner of an image. Snow surrounds the open lake, a result of the first widespread storm of the season over the eastern Great Lakes.This image was created using Polar2Grid and Direct Broadcast data at the UW-Madison CIMSS. ... Read More
NOAA-20 VIIRS True-Color image, 1752 UTC on 2 December 2020 (Click to enlarge)
NOAA-20’s early afternoon pass over Lake Erie on 2 December 2020 produced a stunner of an image. Snow surrounds the open lake, a result of the first widespread storm of the season over the eastern Great Lakes.
This image was created using Polar2Grid and Direct Broadcast data at the UW-Madison CIMSS. The direct link is here. Images from other passes from NOAA-20 are in this directory, and from Suomi-NPP are here.
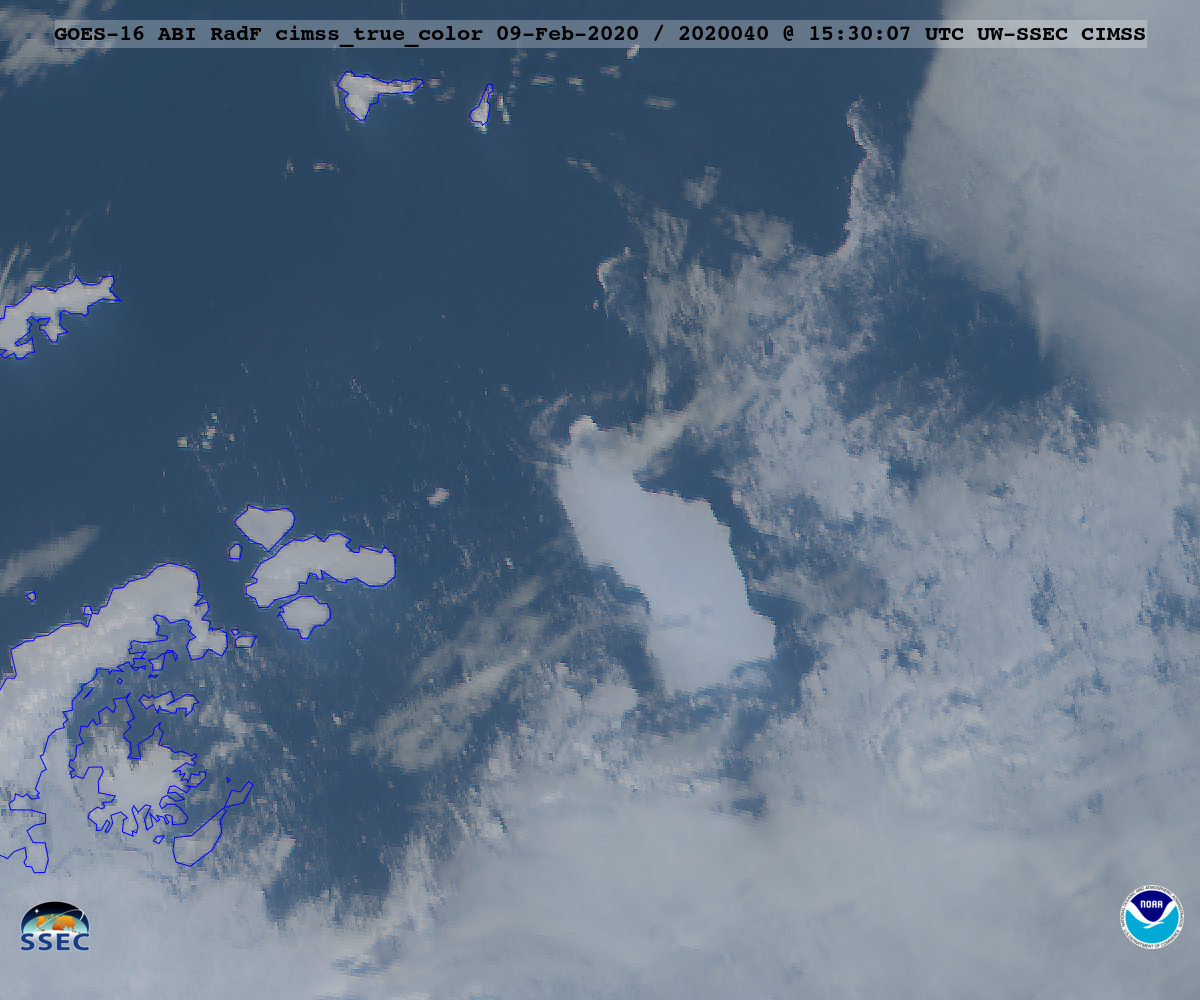
A very large iceberg broke off the Larsen-C Ice Shelf on the Antarctic Peninsula in July 2017 (recall this CIMSS Satellite Blog post, or this more recent post). While NOAA’s GOES-16 ABI visible sensors may not be ideal, they can monitor the iceberg’s location if the cloud cover is not too thick, as shown in the... Read More
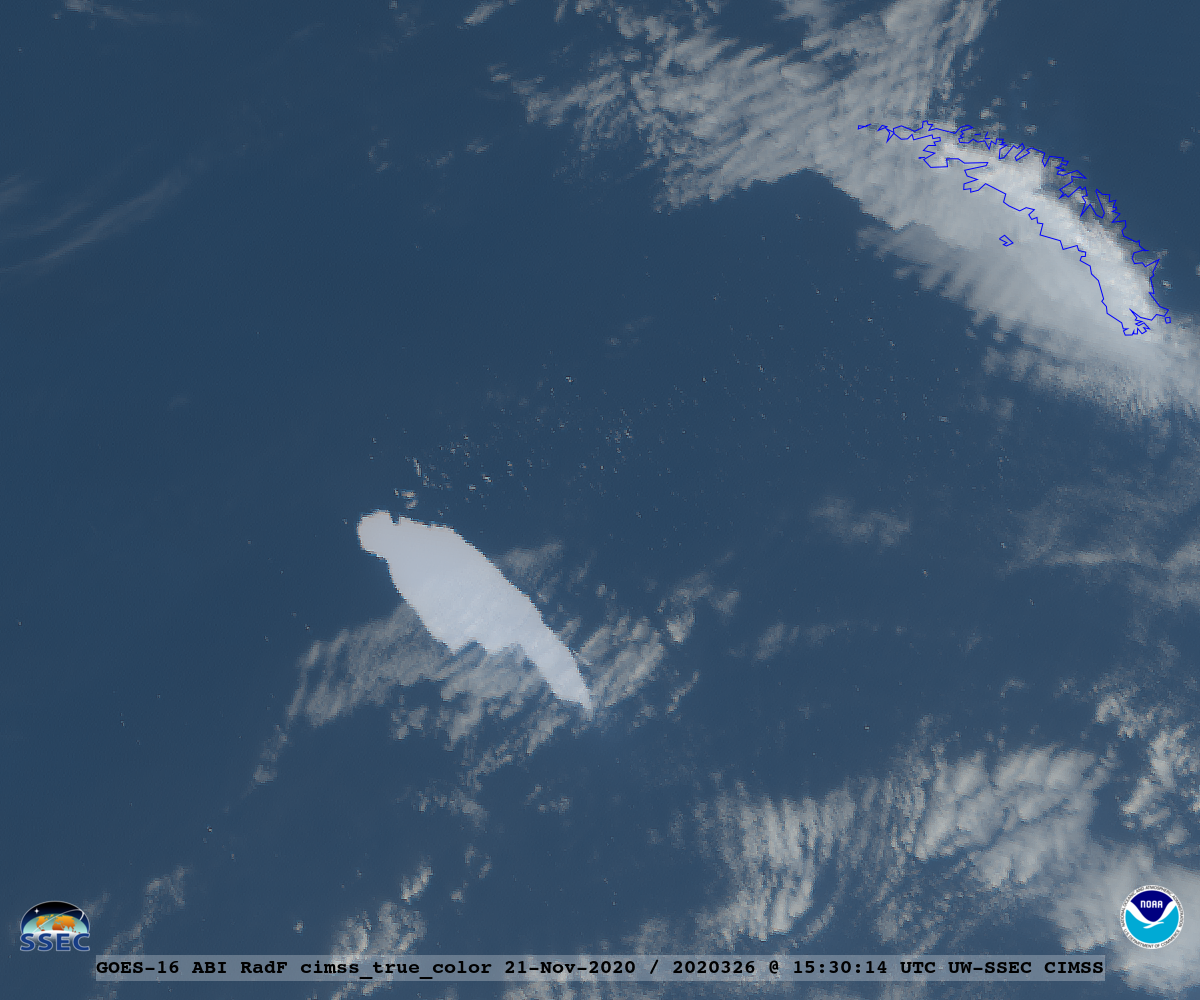
A very large iceberg broke off the Larsen-C Ice Shelf on the Antarctic Peninsula in July 2017 (recall this CIMSS Satellite Blog post, or this more recent post). While NOAA’s GOES-16 ABI visible sensors may not be ideal, they can monitor the iceberg’s location if the cloud cover is not too thick, as shown in the “natural color” animation. A similar loop, in the animated gif format. These composite images include information from ABI “blue” and “red” visible bands, along with the near-infrared “vegetation” band. A sample still image from November 21, 2020. More information can be found in the quick guide.
A GOES-16 natural color animation, using images at 15:30 UTC each day. The first day is November 4, while the last day is December 2, 2020.
Since it was relatively cloud-free for several hours on 02 December, an animation of GOES-16 “Red” Visible (0.64 µm) images is shown below — note the presence of numerous small ice floes that had separated from the edges of A68a, and were circulating within the various ocean currents surrounding the large iceberg as it continued its slow drift toward South Georgia island.
GOES-16 “Red” Visible (0.64 µm) images from 02 December 2020 [click to play animation | MP4]
The geo2grid software was used to generate the images for these animations.
Thanks to a recent tweet by Simon Proud, showing a GOES-16 animation of A68a:
CIMSS provides sectorized VIIRS true-color imagery for each of the five Great Lakes, and for the entire Great Lakes basin at the Direct Broadcast ftp site (ftp://ftp.ssec.wisc.edu/pub/eosdb/j01/viirs/ and ftp://ftp.ssec.wisc.edu/pub/eosdb/npp/viirs for NOAA-20 and Suomi-NPP, respectively). The imagery above shows NOAA-20 images saved from that site and merged together to make an... Read More
Daily true-color images from NOAA-20 VIIRS over Lake Erie, 1-30 November 2020 (Click to animate)
CIMSS provides sectorized VIIRS true-color imagery for each of the five Great Lakes, and for the entire Great Lakes basin at the Direct Broadcast ftp site (ftp://ftp.ssec.wisc.edu/pub/eosdb/j01/viirs/ and ftp://ftp.ssec.wisc.edu/pub/eosdb/npp/viirs for NOAA-20 and Suomi-NPP, respectively). The imagery above shows NOAA-20 images saved from that site and merged together to make an animation (except for 12, 13, 14 November. Mea Culpa) over Lake Erie. Click here to view the animation as an mp4. (Additional animations for the other Great Lakes have also been created: Lake Ontario in animated gif / mp4) Lake Huron in animated gif / mp4 ; Lake Michigan in animated gif / mp4; Lake Superior in animated gif ; mp4)
The daily views allow a user to view slow changes in the Lake’s circulation — when skies are clear. Such was the case on 8, 9 and 10 November, shown below. A slow anticyclonic motion in the widest part of central Lake Erie is apparent.
NOAA-20 VIIRS true-color imagery over Lake Erie on 8, 9, and 10 November 2020 (Click to enlarge)
![GOES-17 “Red” Visible (0.64 µm) and Shortwave Infrared (3.9 µm) images [click to play animation | MP4]](https://cimss.ssec.wisc.edu/satellite-blog/images/2020/12/201203_goes17_shortwaveInfrared_visible_Southern_California_wildfires_anim.gif)
![GOES-17 True Color RGB images [click to play animation | MP4]](https://cimss.ssec.wisc.edu/satellite-blog/images/2020/12/201203_goes17_trueColorRGB_CA_wildfire_smoke_anim.gif)
![Landsat-8 False Color images, 24 November vs 03 December 2020 [click to enlarge]](https://cimss.ssec.wisc.edu/satellite-blog/images/2020/12/201124_201203_landsat8_falseColorRGB_Southern_California_wildfires_anim.gif)

