
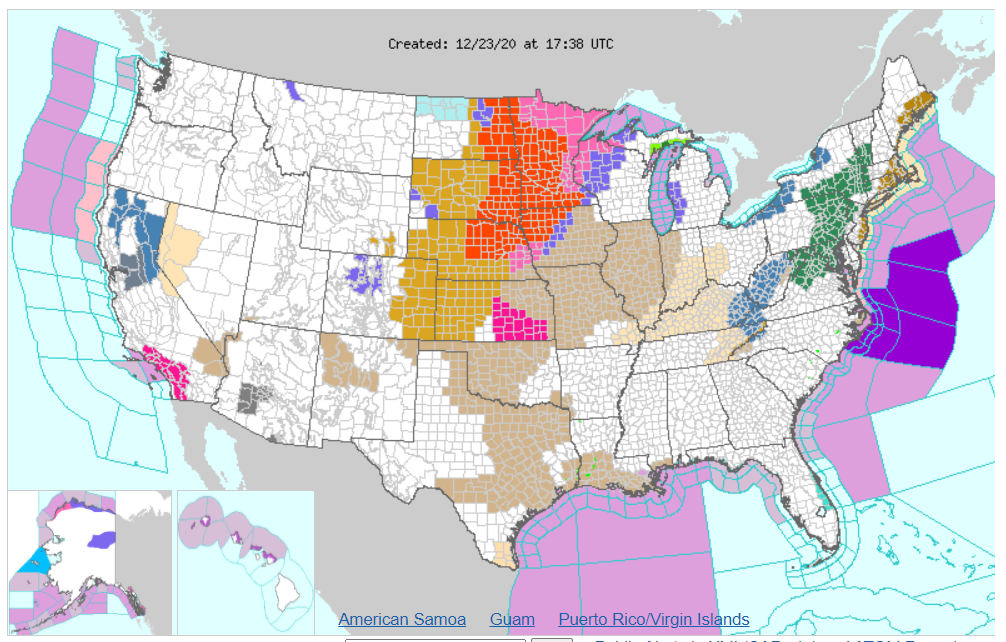
Strong winds behind a storm moving along the United States/Canada border on 23 December 2020 led to blizzard warnings over much of the Northern Plains (link). How easily was the blowing snow detected by satellite? The animation above shows the Day Snow Fog RGB from 1416 through 1751 UTC on 23 December 2020. During this time over North Dakota, low clouds... Read More
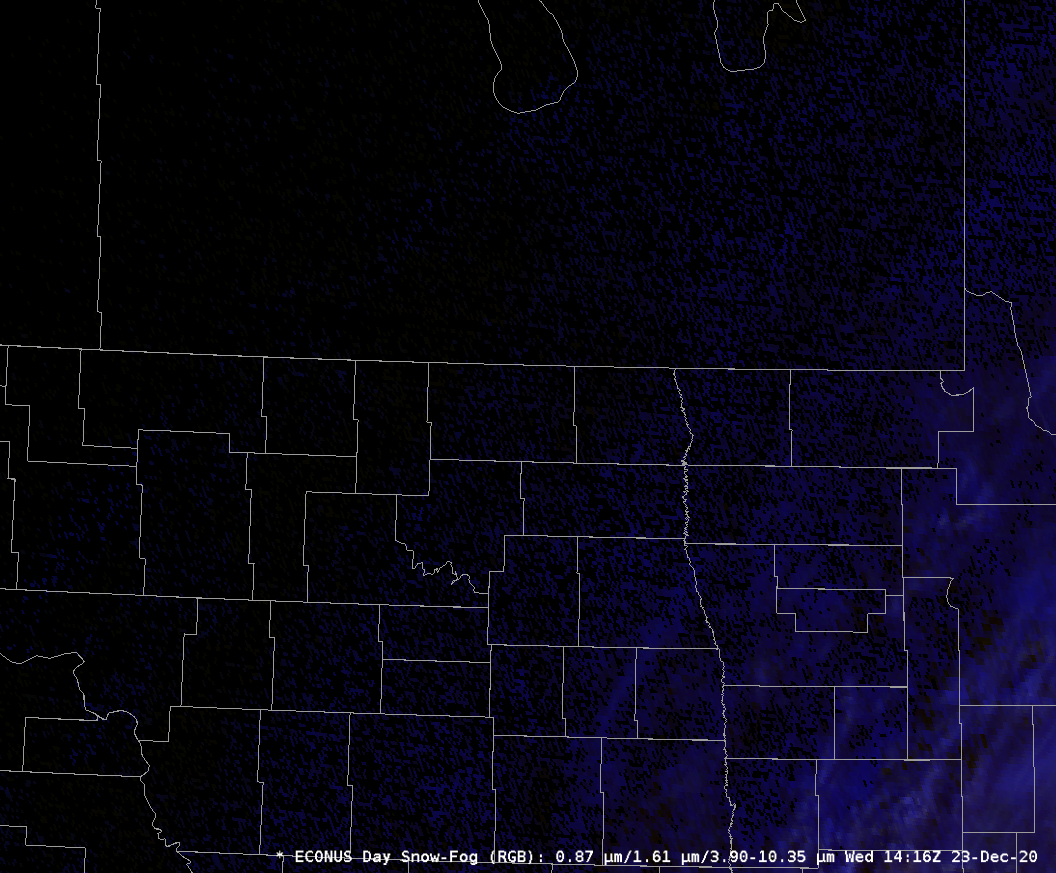
Day Snow Fog RGB, 1416 – 1751 UTC, 23 December 2020 (Click to animate)
Strong winds behind a storm moving along the United States/Canada border on 23 December 2020 led to blizzard warnings over much of the Northern Plains (link). How easily was the blowing snow detected by satellite?
The animation above shows the Day Snow Fog RGB from 1416 through 1751 UTC on 23 December 2020. During this time over North Dakota, low clouds (bright whitish/periwinkle) and mid/high-level clouds (transparent violet) masked the surface from the satellite view. However, blowing snow is suggested to the south of Lake Manitoba. The RGB has a slightly different, brighter color than the adjacent snow-cover — that is red — and the texture in the image, and the linear features aligned with the wind both suggest lofted blowing snow.
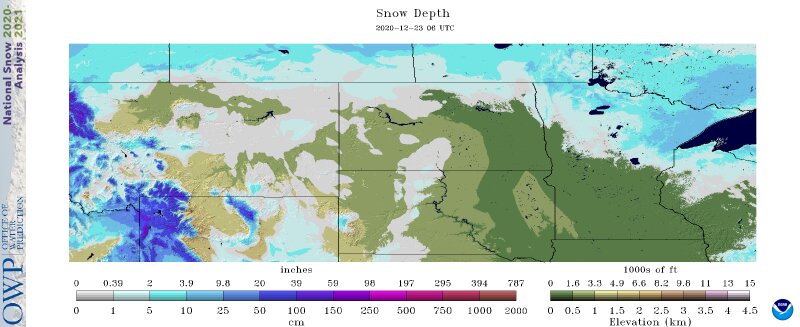
The VIIRS instruments on board Suomi-NPP and NOAA-20 also viewed this scene, once at 1759 UTC (from NOAA-20) and once at 1850 UTC (from Suomi-NPP), with much higher spatial resolution. There is a region of enhanced reflectance (i.e., whiter shades of grey) in the 1.61 µm imagery to the south-southeast of Lake Manitoba in the top center of the image. These are lofted, fractured ice crystals that are more reflective of solar radiation than surrounding snow cover. The signal shows up in the False Color imagery as well, but not in the true color imagery that does not incorporate information from the 1.61 µm channel. A similar signal appears in extreme northeast North Dakota at 1759 UTC. VIIRS imagery does not suggest widespread blowing snow. Indeed, snow depths over North Dakota suggest little snow on the ground to blow around (snow depth analysis, from this site)! Snow depths over Manitoba are a bit larger.
NOAA-20 VIIRS I03 (1.61 µm), False and True Color imagery, 1759 UTC 23 December 2020 (Click to enlarge)
Suomi-NPP VIIRS I03 (1.61 µm), False and True Color imagery, 1850 UTC on 23 December 2020 (Click to enlarge)
The animation from 1751 UTC to 2106 UTC on 23 December, below, which animation includes the times of the VIIRS overpasses above, also captures the snow plume downwind of Lake Manitoba, extending to the North Dakota/Minnesota border and, perhaps, into northwestern Minnesota. However, clouds over Minnesota (and the Red River of the North) make definitive blowing snow detection difficult. Traffic webcams as a supplement to the satellite data source will create a better feel for the horizontal extent of the blowing snow.
Day Snow Fog RGB, 1751 – 2106 UTC, 23 December 2020 (Click to animate)
This 11-minute training video discusses this RGB’s abilities in blowing snow detection in a bit more depth. You can view a longer presentation concerning othis RGB here.
View only this post
Read Less
![GOES-16 “Red” Visible (0.64 µm) images [click to play animation | MP4]](https://cimss.ssec.wisc.edu/satellite-blog/images/2020/12/201214_201226_goes16_visible_IcebergA68a_anim.gif)
![NOAA-20 VIIRS True Color RGB images [click to enlarge]](https://cimss.ssec.wisc.edu/satellite-blog/images/2020/12/201223_201225_noaa20_viirs_trueColorRGB_IcebergA68a_anim.gif)
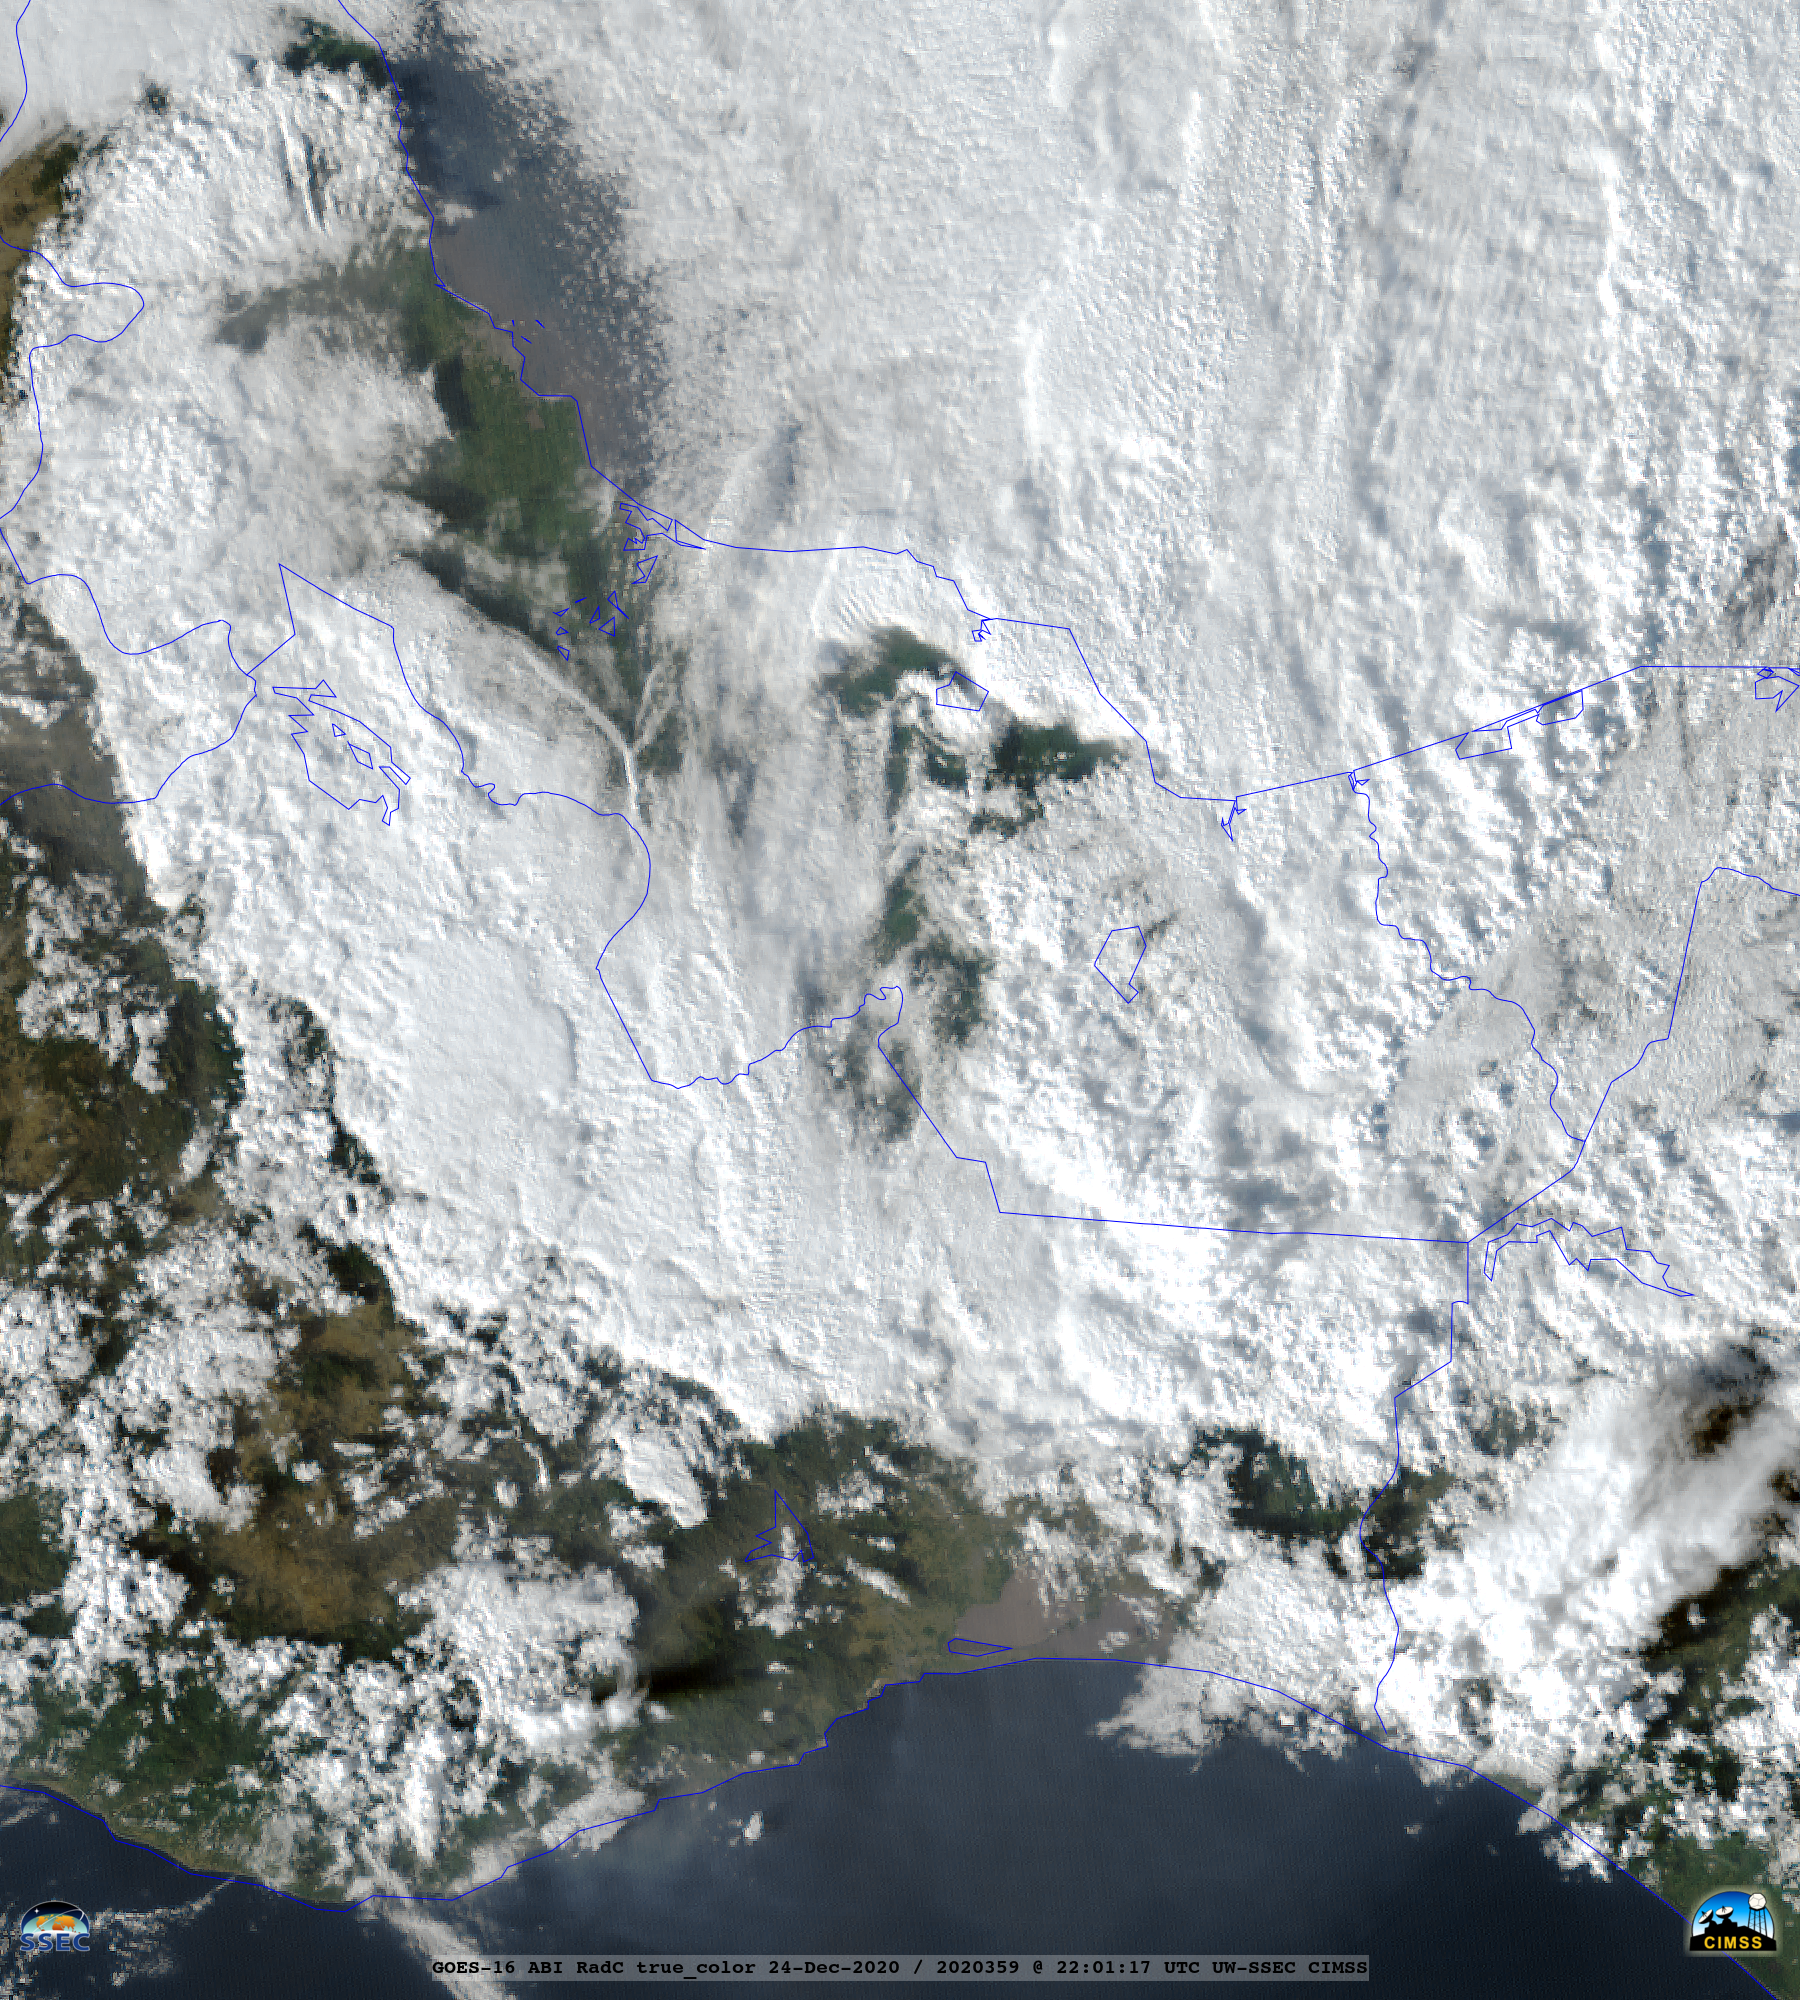
![GOES-16 True Color RGB images [click to play animation | MP4]](https://cimss.ssec.wisc.edu/satellite-blog/images/2020/12/201224_goes16_trueColorGB_Tehuano_anim.gif)
![GOES-16 "Red" Visible (0.64 µm) images [click to play animation | MP4]](https://cimss.ssec.wisc.edu/satellite-blog/images/2020/12/201225_goes16_visible_Tehuano_anim.gif)
![GOES-16 True Color RGB images [click to play animation | MP4]](https://cimss.ssec.wisc.edu/satellite-blog/images/2020/12/201225_goes16_trueColorRGB_Tehuano_anim.gif)
![GOES-17 True Color RGB images [click to play animation | MP4]](https://cimss.ssec.wisc.edu/satellite-blog/images/2020/12/201225_goes17_trueColorRGB_Tehuano_anim.gif)
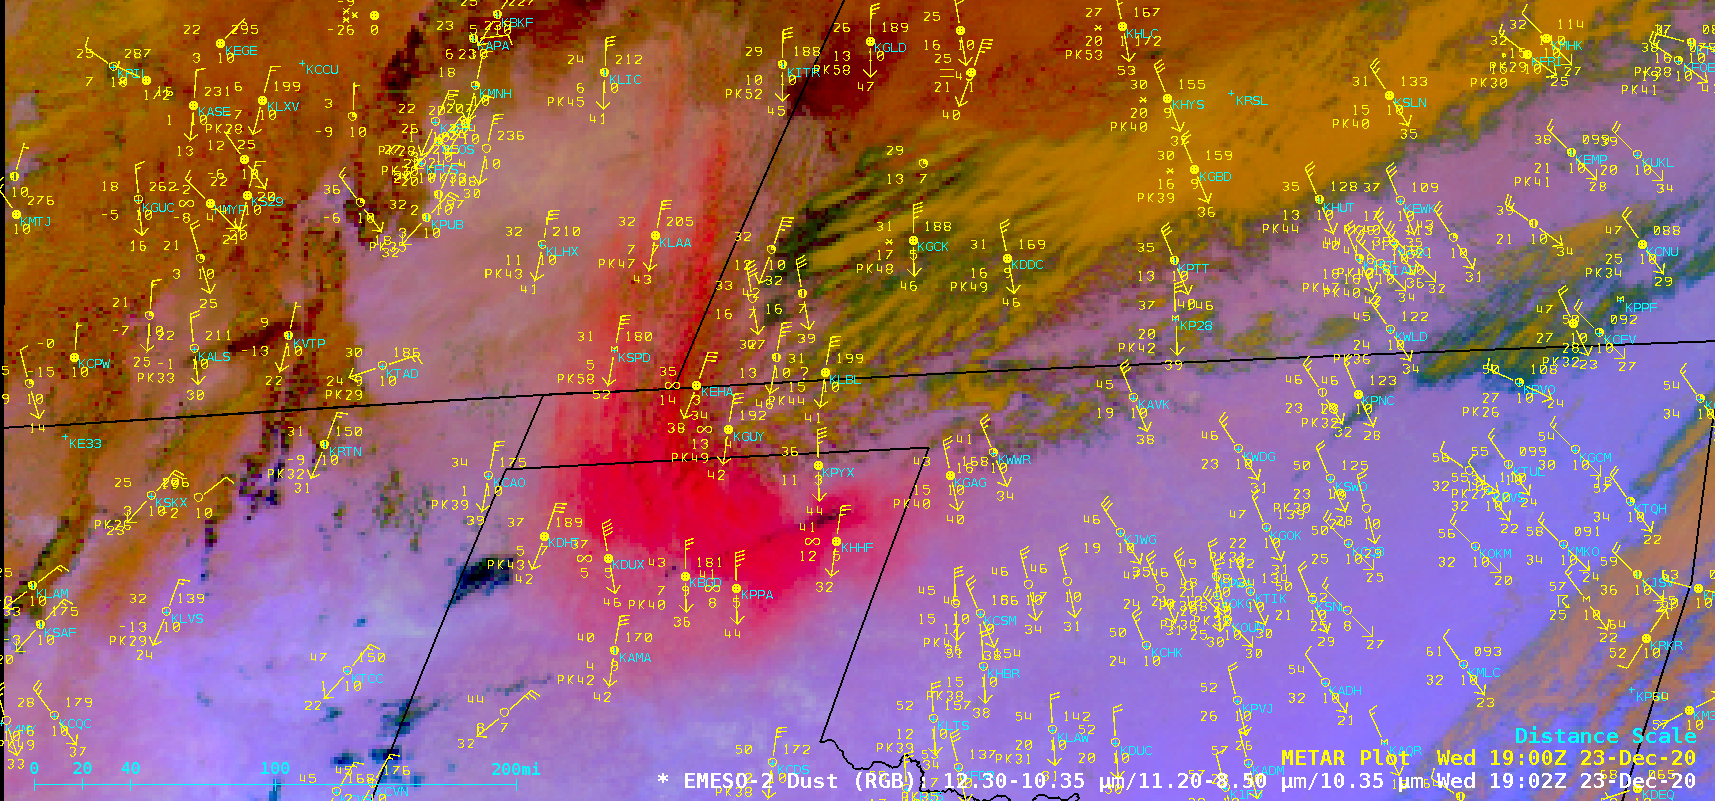
![GOES-16 Dust RGB images [click to play animation | MP4]](https://cimss.ssec.wisc.edu/satellite-blog/images/2020/12/201223_goes16_dustRGB_Plains_blowing_dust_anim.gif)
![GOES-16 True Color RGB images [click to play animation | MP4]](https://cimss.ssec.wisc.edu/satellite-blog/images/2020/12/201223_goes16_trueColorRGB_Plains_blowing_dust_anim.gif)

