GOES-16 (GOES-East) Day Snow-Fog RGB and Land Surface Temperature product images on 01 January 2021 (above) showed a large portion of western and southwestern Texas in the wake of a winter storm that occurred on the previous day. On the RGB images, snow cover appeared as shades of red, with low clouds... Read More
![GOES-16 Day Snow-Fog RGB and Land Surface Temperature product [click to play animation | MP4]](https://cimss.ssec.wisc.edu/satellite-blog/images/2021/01/tx_rgb-20210101_150117.png)
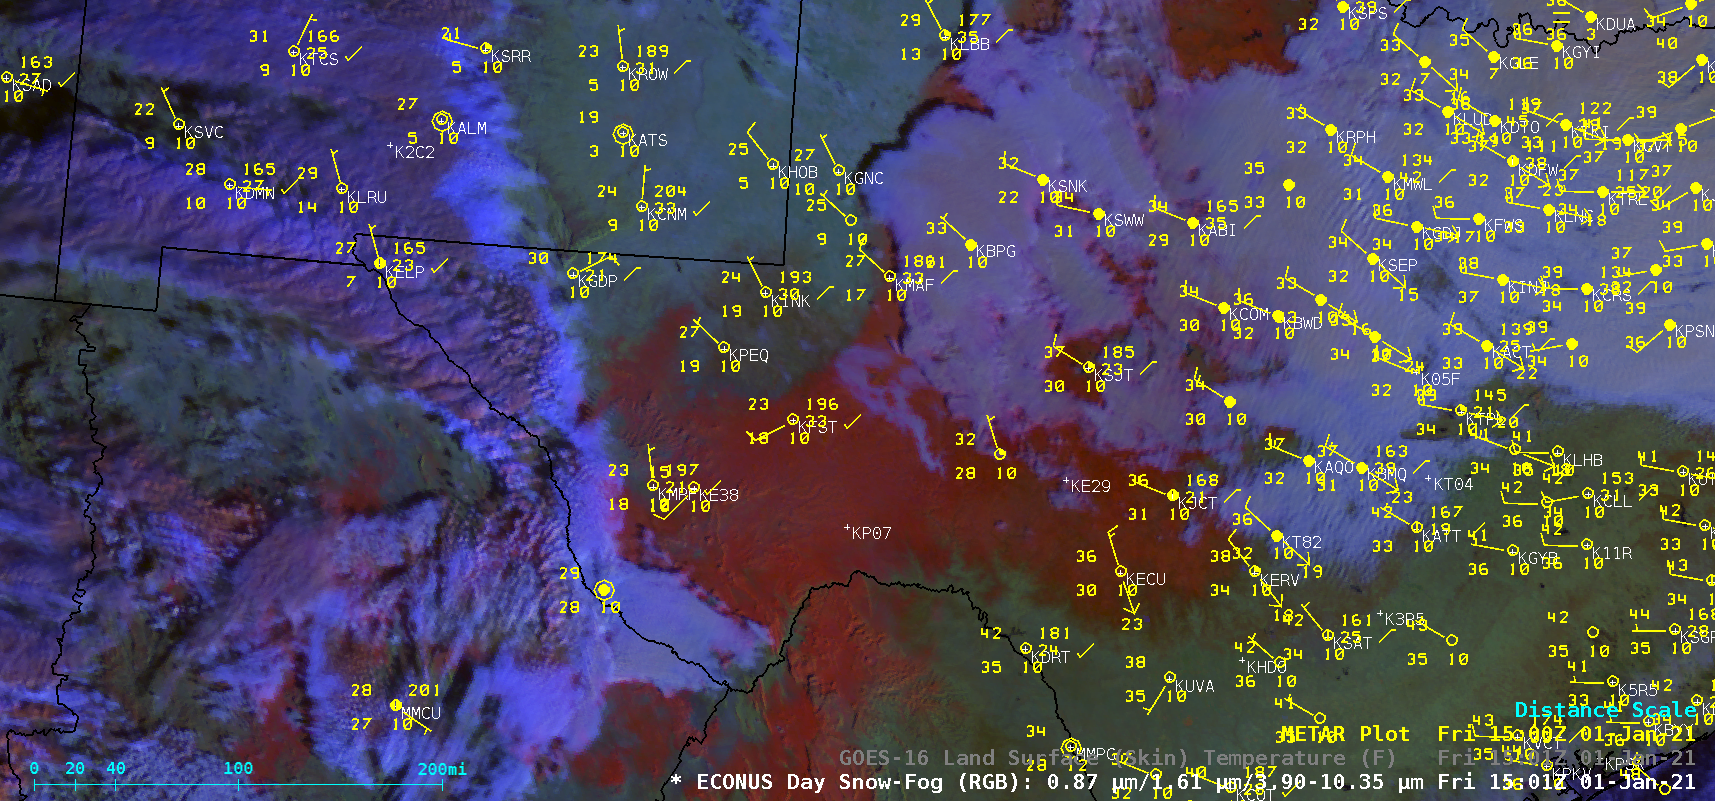
GOES-16 Day Snow-Fog RGB and Land Surface Temperature product [click to play animation | MP4]
GOES-16
(GOES-East) Day Snow-Fog RGB and Land Surface Temperature product images on 01 January 2021
(above) showed a large portion of western and southwestern Texas in the wake of a winter storm that occurred on the previous day. On the RGB images, snow cover appeared as shades of red, with low clouds and fog taking on shades of white (shades of green denoted bare ground).
With some areas receiving storm total accumulations of 8-15 inches, the deep snow cover kept Land Surface Temperature (LST) values from rising past the low-mid 30s F during the day — even at locations such as Fort Stockton (KFST), which remained generally cloud-free during the daytime hours (their daily maximum temperature was only 36ºF). Over adjacent bare ground areas, LST values rose into the 50s and 60s F with a full day of sunshine. Air temperatures — measured by sheltered sensors located about 5 feet above the ground — were sometimes 10-15ºF cooler than LST values over bare ground, but over deep snow cover the air temperatures were generally only 5-8ºF warmer than the LST values.
===== 02 January Update =====
![GOES-16 Day Snow-Fog RGB and Land Surface Temperature product [click to play animation | MP4]](https://cimss.ssec.wisc.edu/satellite-blog/images/2021/01/tx_lst-20210102_230117.png)
GOES-16 Day Snow-Fog RGB and Land Surface Temperature product [click to play animation | MP4]
On the following day, a lack of clouds allowed a good view of the areal coverage of remaining snow cover
(above). During the peak of daytime heating, GOES-16 LST values were held to the middle 30s F over the areas with deeper snow cover — while air temperatures rose into the 40s F (although the daily maximum temperature was only 40 at Big Spring KBPG). Over adjacent areas of bare ground, afternoon air temperatures rising into the 50s and 60s F were seen.
===== 04 January Update =====
![GOES-16 True Color RGB images on 02, 03 and 04 January [click to play animation | MP4]](https://cimss.ssec.wisc.edu/satellite-blog/images/2021/01/GOES-16_ABI_RadC_true_color_2021003_192117Z.png)
GOES-16 True Color RGB images on 02, 03 and 04 January [click to play animation | MP4]
A sequence of GOES-16 True Color RGB images during the period 02-04 January created using
Geo2Grid (above) showed the gradual melting of most of the snow cover across western Texas.
View only this post
Read Less

![GOES-16 “Red” Visible (0.64 µm, left) and “Clean” Infrared Window (10.35 µm, right) images, with SPC Storm Reports plotted in red [click to play animation | MP4]](https://cimss.ssec.wisc.edu/satellite-blog/images/2021/01/210104_goes17_visible_infrared_spcStormReports_CA_anim.gif)
![Suomi NPP VIIRS Visible (0.64 µm) and Infrared Window (11.45 µm) images [click to enlarge]](https://cimss.ssec.wisc.edu/satellite-blog/images/2021/01/210104_2148utc_suomiNPP_viirs_infrared_visible_CA_anim.gif)
![MIMIC Total Precipitable Water images [click to play animation | MP4]](https://cimss.ssec.wisc.edu/satellite-blog/images/2021/01/210102_210104_mimicTPW_East_Pacific_anim.gif)
![GOES-16 Day Snow-Fog RGB and Land Surface Temperature product [click to play animation | MP4]](https://cimss.ssec.wisc.edu/satellite-blog/images/2021/01/210101_goes16_daySnowFogRGB_LandSurfaceTemperature_TX_snow_cover_anim.gif)
![GOES-16 Day Snow-Fog RGB and Land Surface Temperature product [click to play animation | MP4]](https://cimss.ssec.wisc.edu/satellite-blog/images/2021/01/210102_goes16_daySnowFogRGB_LandSurfaceTemperature_TX_snow_cover_anim.gif)
![GOES-16 True Color RGB images on 02, 03 and 04 January [click to play animation | MP4]](https://cimss.ssec.wisc.edu/satellite-blog/images/2021/01/210102_210104_goes16_trueColorRGB_TX_snowcover_anim.gif)
