![Suomi NPP VIIRS Day/Night Band (0.7 µm), Near-Infrared (1.61 µm and 2.25 µm) and Shortwave Infrared (3.74 µm) images (credit: William Straka, CIMSS) [click to enlarge]](https://cimss.ssec.wisc.edu/satellite-blog/images/2020/04/200413_0008utc_suomiNPP_viirs_dayNightBand_nearInfrared_shortwaveInfrared_Chernobyl_wildfires_anim.gif)
Suomi NPP VIIRS Day/Night Band (0.7 µm), Near-Infrared (1.61 µm and 2.25 µm) and Shortwave Infrared (3.74 µm) images (credit: William Straka, CIMSS) [click to enlarge]
View only this post Read Less
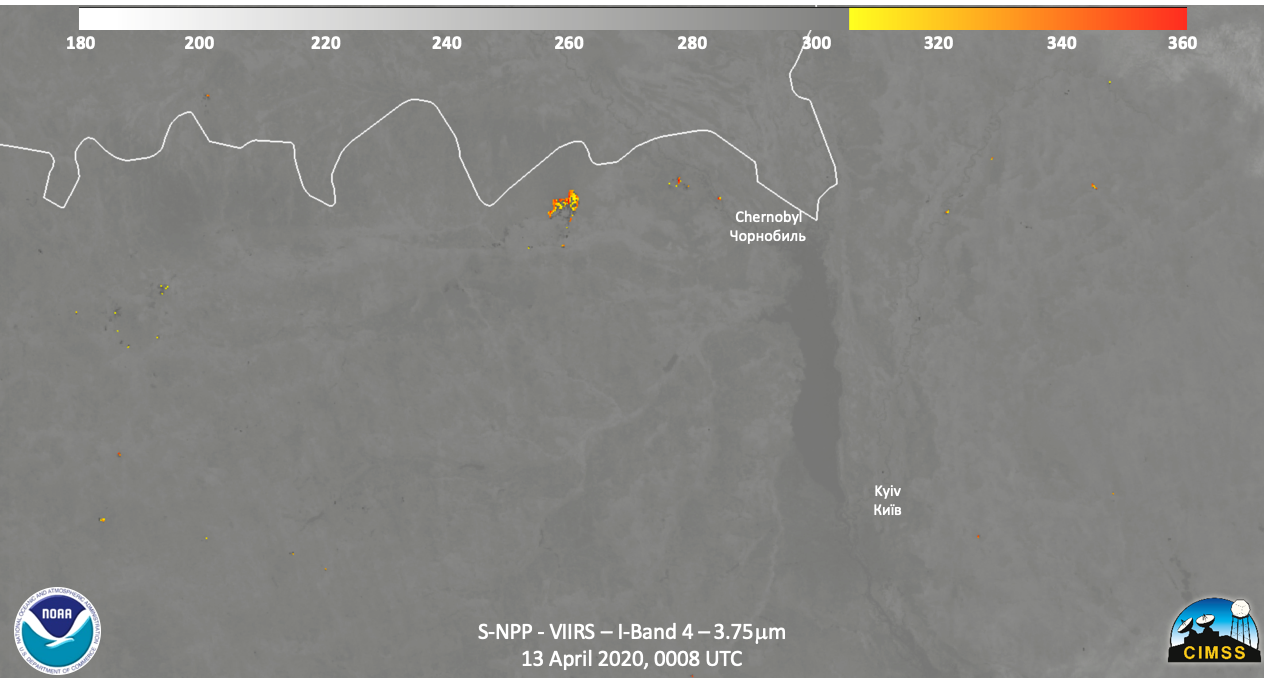
Suomi NPP VIIRS Day/Night Band (0.7 µm), Near-Infrared (1.61 µm and 2.25 µm) and Shortwave Infrared (3.74 µm) images (above) showed visible and thermal signatures of a cluster of wildfires burning west of the abandoned Chernobyl nuclear power plant on 13 April 2020. The fire had reportedly burned about 8600... Read More
Suomi NPP VIIRS Day/Night Band (0.7 µm), Near-Infrared (1.61 µm and 2.25 µm) and Shortwave Infrared (3.74 µm) images (credit: William Straka, CIMSS) [click to enlarge]
View only this post Read Less
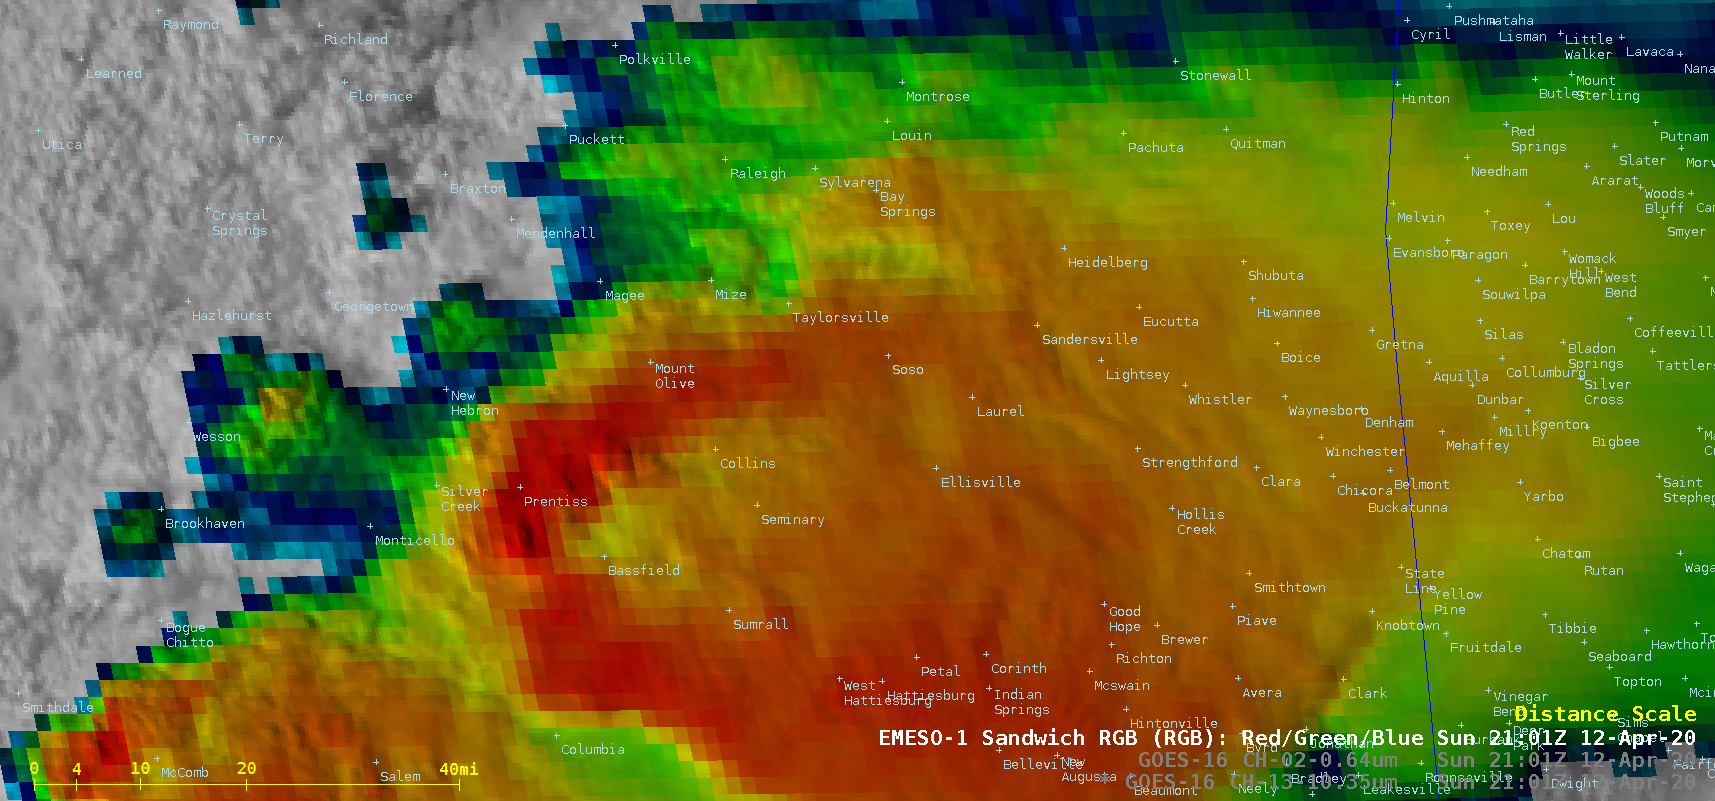
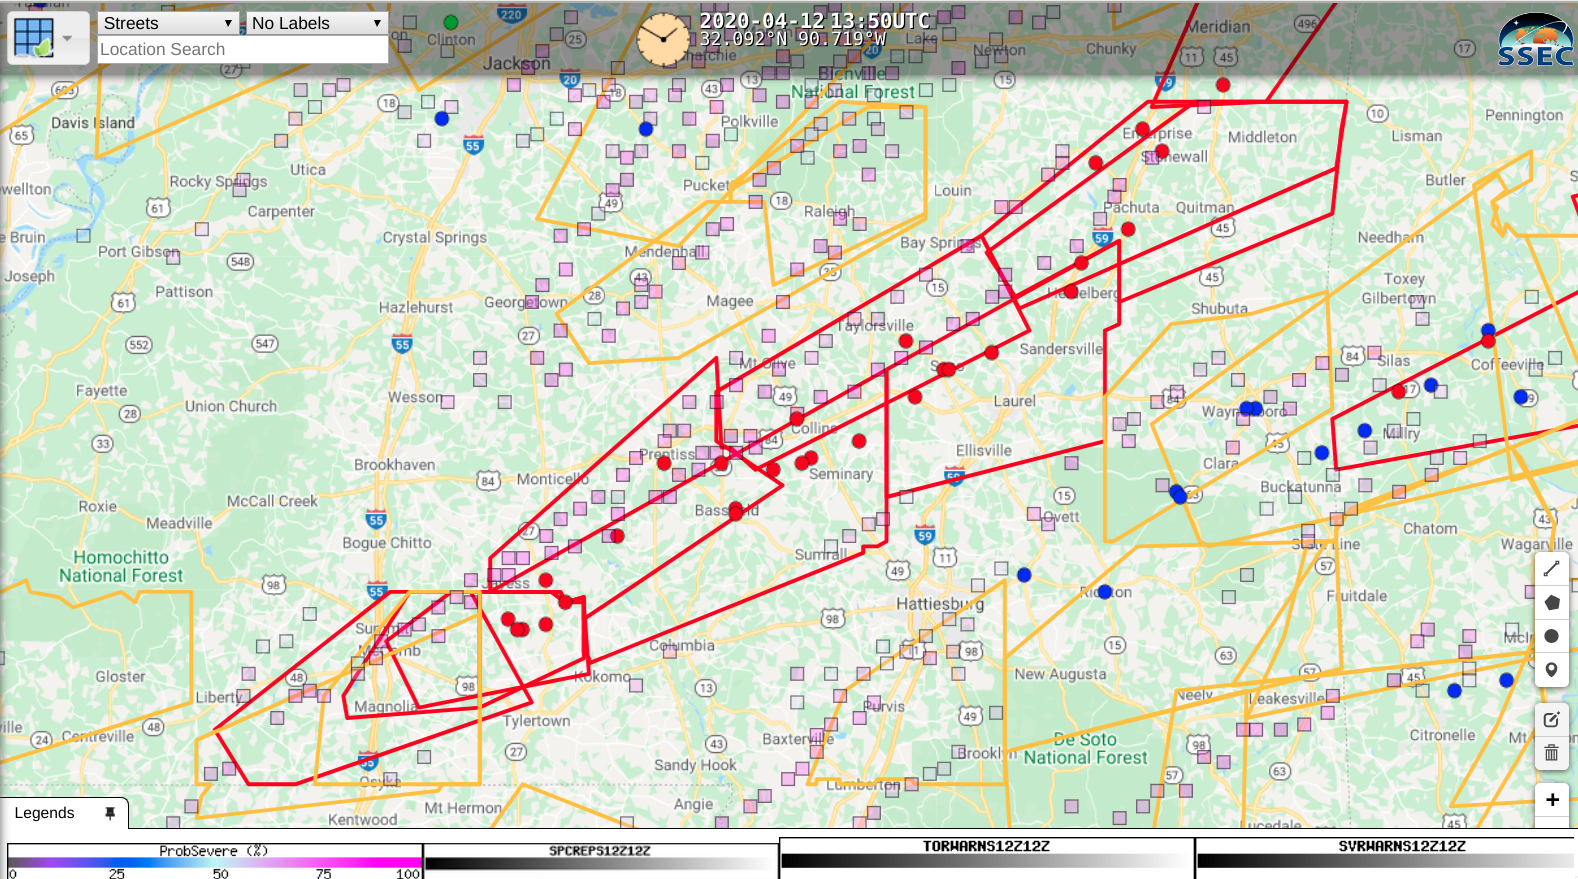
A major outbreak of severe thunderstorms (SPC Storm Reports) occurred across the Deep South on 12 April 2020. 1-minute Mesoscale Domain Sector GOES-16 (GOES-East) “Red” Visible (0.64 µm) images (above) showed the development and propagation of deep convection during the 1200-2359 UTC period. The corresponding GOES-16 “Clean” Infrared Window (10.35 µm) images are shown below.Some of the strongest... Read More
![GOES-16 "Red" Visible (0.64 µm) images [click to play animation | MP4]](https://cimss.ssec.wisc.edu/satellite-blog/images/2020/04/200412_goes16_visible_awips_Deep_South_anim.gif)
GOES-16 “Red” Visible (0.64 µm) images [click to play animation | MP4]

GOES-16 “Clean” Infrared Window (10.35 µm) images [click to play animation | MP4]
![GOES-16 "Red" Visible (0.64 µm ), "Clean" Infrared Window (10.35 µm), and Visible/Infrared Sandwich RGB images [click to play animation | MP4]](https://cimss.ssec.wisc.edu/satellite-blog/images/2020/04/200412_goes16_visible_infrared_sandwichRGB_MS_anim.gif)
GOES-16 “Red” Visible (0.64 µm ), “Clean” Infrared Window (10.35 µm) and Visible/Infrared Sandwich RGB images [click to play animation | MP4]
![GOES-16 "Red" Visible (0.64 µm) images, with time-matched SPC Storm Reports plotted in red [click to play animation | MP4]](https://cimss.ssec.wisc.edu/satellite-blog/images/2020/04/200412_goes16_visible_Deep_South_anim.gif)
GOES-16 “Red” Visible (0.64 µm) images, with time-matched SPC Storm Reports plotted in red [click to play animation | MP4]
![GOES-16 "Clean" Infrared Window (10.35 µm) images, with time-matched SPC Storm Reports plotted in cyan [click to play animation | MP4]](https://cimss.ssec.wisc.edu/satellite-blog/images/2020/04/200412_goes16_infrared_Deep_South_anim.gif)
GOES-16 “Clean” Infrared Window (10.35 µm) images, with time-matched SPC Storm Reports plotted in cyan [click to play animation | MP4]
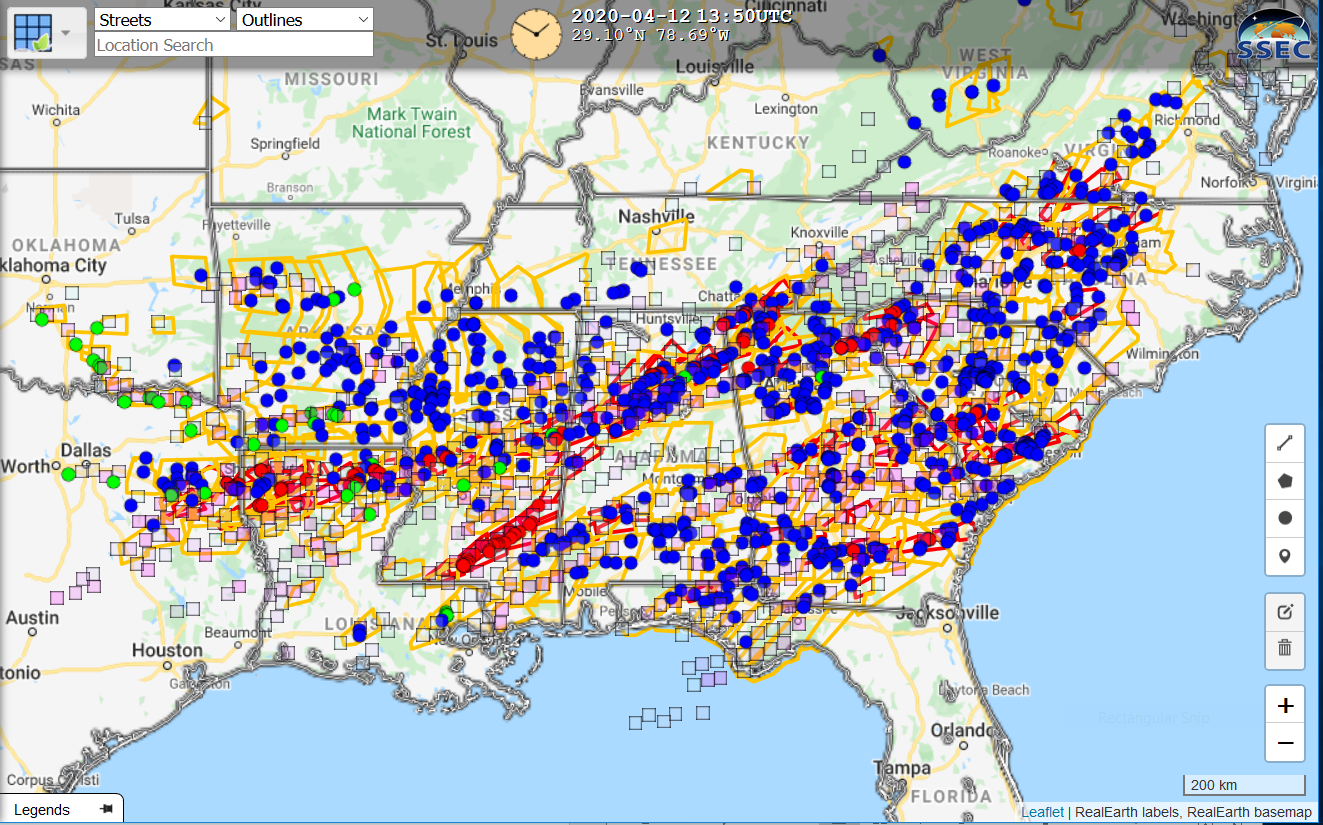
Severe weather reports from 12 April 2020 (Green: Hail; Blue: Wind; Red: Tornado), NWS Warning Polygons and ProbSevere locations (plotted as boxes when ProbSevere exceeded 50% (Click to enlarge)
===== 14 April Update =====
GOES-16 “Red” Visible (0.64 µm) and Normalized Difference Vegetation Index images [click to enlarge]
In a toggle between Aqua MODIS NDVI and Land Surface Temperature (LST) images (below), LST values were 5-10ºF warmer — low 80s F, darker shades of red — within the tornado damage path, compared to areas adjacent to the path.
![Aqua MODIS Normalized Difference Vegetation Index and Land Surface Temperature images [click to enlarge]](https://cimss.ssec.wisc.edu/satellite-blog/images/2020/04/200414_1926utc_aqua_modis_normalizedDifferenceVegetationIndex_landSurfaceTemperature_MS_tornado_damage_paths_anim.gif)
Aqua MODIS Normalized Difference Vegetation Index and Land Surface Temperature images [click to enlarge]
![Aqua MODIS True Color RGB images from 26 March and 14 April [click to enlarge]](https://cimss.ssec.wisc.edu/satellite-blog/images/2020/04/200326_200414_aqua_modis_trueColorRGB_MS_tornado_damage_path_v2_anim.gif)
Aqua MODIS True Color RGB images from 26 March and 14 April [click to enlarge]

True- and False-Color imagery from the afternoon NOAA-20 overpass on 14 April 2020 (Click to enlarge)
NOAA-20 True Color RGB imagery of the Mississippi EF-4 tornado damage path that had a maximum with of 2 miles is shown below, using RealEarth.
![NOAA-20 VIIRS True Color RGB image, including county outlines and map labels [click to enlarge]](https://cimss.ssec.wisc.edu/satellite-blog/images/2020/04/200414_1850utc_noaa20_viirs_trueColorRGB_MS_EF4_tornado_damage_path_anim.gif)
NOAA-20 VIIRS True Color RGB image, including county outlines and map labels [click to enlarge]
A StoryMap of this event in South Carolina, created by the NWS in Columbia SC, is here.
View only this post Read Less
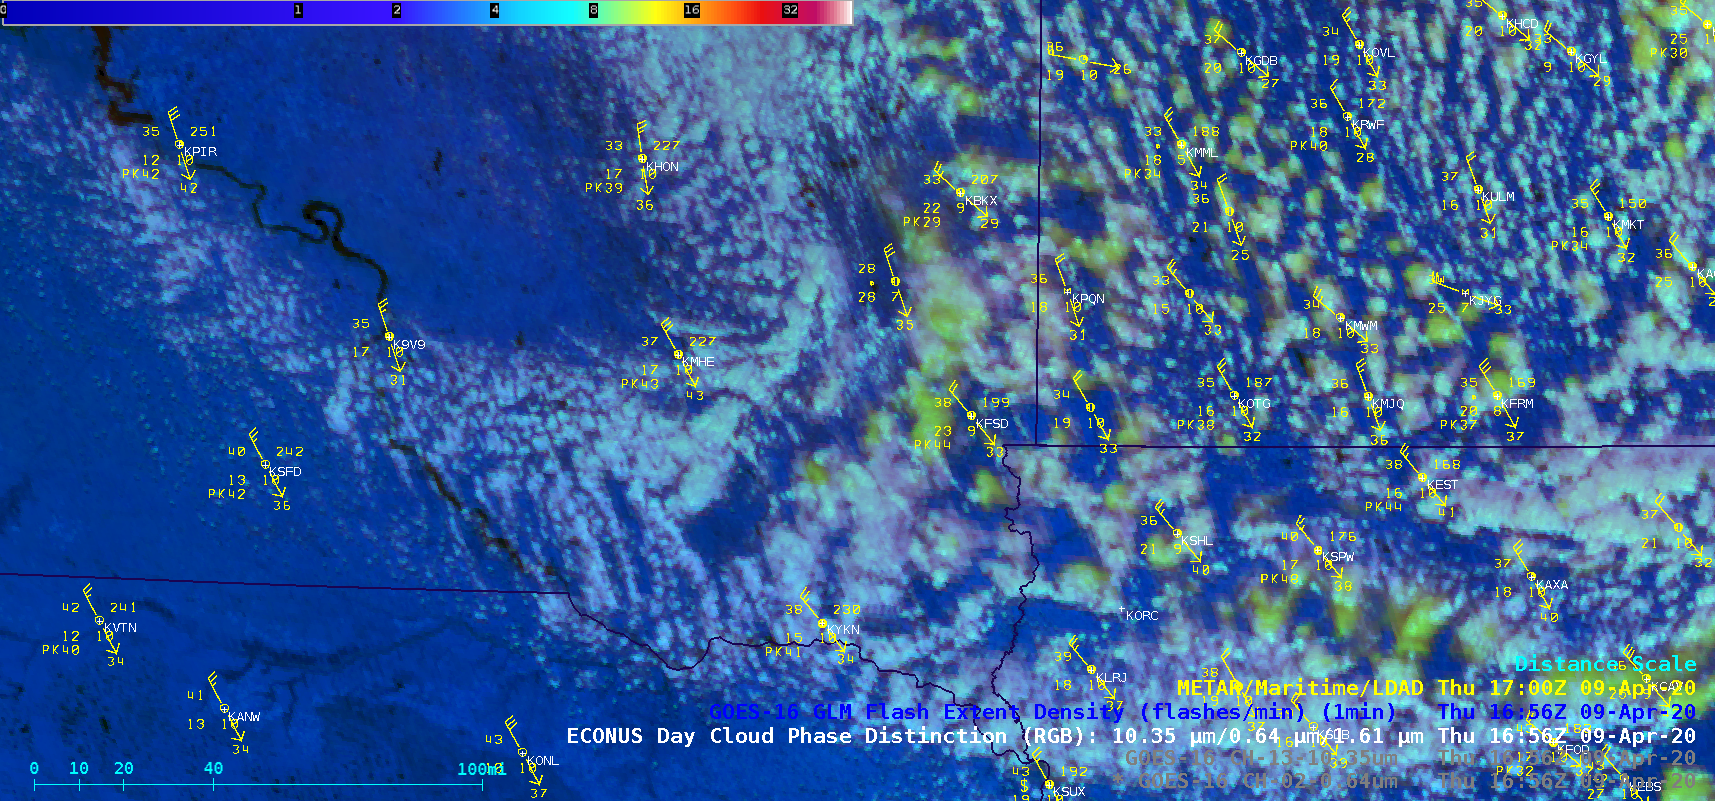
The NWS Aberdeen forecast office issued a Snow Squall Warning on the morning of 09 April 2020 — and a sequence of GOES-16 (GOES-East) “Red” Visible (0.64 µm), “Clean” Infrared Window (10.35 µm) and Day Cloud Phase Distinction Red-Green-Blue (RGB) images (above) showed the southeastward movement of numerous convective cloud features responsible for the snow squalls. Cloud elements whose tops... Read More
GOES-16 “Red” Visible (0.64 µm), “Clean” Infrared Window (10.35 µm) and Day Cloud Phase Distinction RGB images [click to play animation | MP4]
Farther to the south and east, NWS Sioux Falls also issued a Snow Squall Warning — similar signatures of convective elements were seen in the GOES-16 imagery (below), including the glaciation of some of the cloud tops. Snowfall amounts were generally light (around 0.1 inch), but surface visibility was reduced to zero in some of the snow squalls.
![GOES-16 "Red Visible (0.64 µm), "Clean" Infrared Window (10.35 µm) and Day Cloud Phase Distinction RGB images [click to play animation | MP4]](https://cimss.ssec.wisc.edu/satellite-blog/images/2020/04/200409_goes16_visible_infrared_dayCloudPhaseDistinction_FSD_snow_squalls_anim.gif)
GOES-16 “Red” Visible (0.64 µm), “Clean” Infrared Window (10.35 µm) and Day Cloud Phase Distinction RGB images [click to play animation | MP4]
![GOES-16 "Red Visible (0.64 µm), "Clean" Infrared Window (10.35 µm) and Day Cloud Phase Distinction RGB images [click to play animation | MP4]](https://cimss.ssec.wisc.edu/satellite-blog/images/2020/04/200409_goes16_visible_infrared_dayCloudPhaseDistinction_DLH_snow_squalls_anim.gif)
GOES-16 “Red” Visible (0.64 µm), “Clean” Infrared Window (10.35 µm) and Day Cloud Phase Distinction RGB images [click to play animation | MP4]
A snow squall warning continues until 9:45 AM CDT for US-12, US-281 near Aberdeen, SD. pic.twitter.com/Mth1pPxq5d
— NWS Aberdeen (@NWSAberdeen) April 9, 2020
A snow squall warning is in effect until 11:00 AM CDT for I-29, US-14 near Brookings, SD. pic.twitter.com/u0LuYBJ2WR
— NWS Sioux Falls (@NWSSiouxFalls) April 9, 2020
A snow squall warning is in effect until 8:30 AM CDT for I-35 near Cloquet, MN and I-35, I-535, US-2, US-53 near Duluth, MN–WI. pic.twitter.com/mz3R9UBjsy
— NWS Duluth (@NWSduluth) April 9, 2020
![Plots of 12 UTC rawinsonde data from Aberdeen, South Dakota and International Falls, Minnesota [click to enlarge]](https://cimss.ssec.wisc.edu/satellite-blog/images/2020/04/200409_12UTC_KABR_KINL_RAOBS.GIF)
Plots of 12 UTC rawinsonde data from Aberdeen, South Dakota and International Falls, Minnesota [click to enlarge]
View only this post Read Less
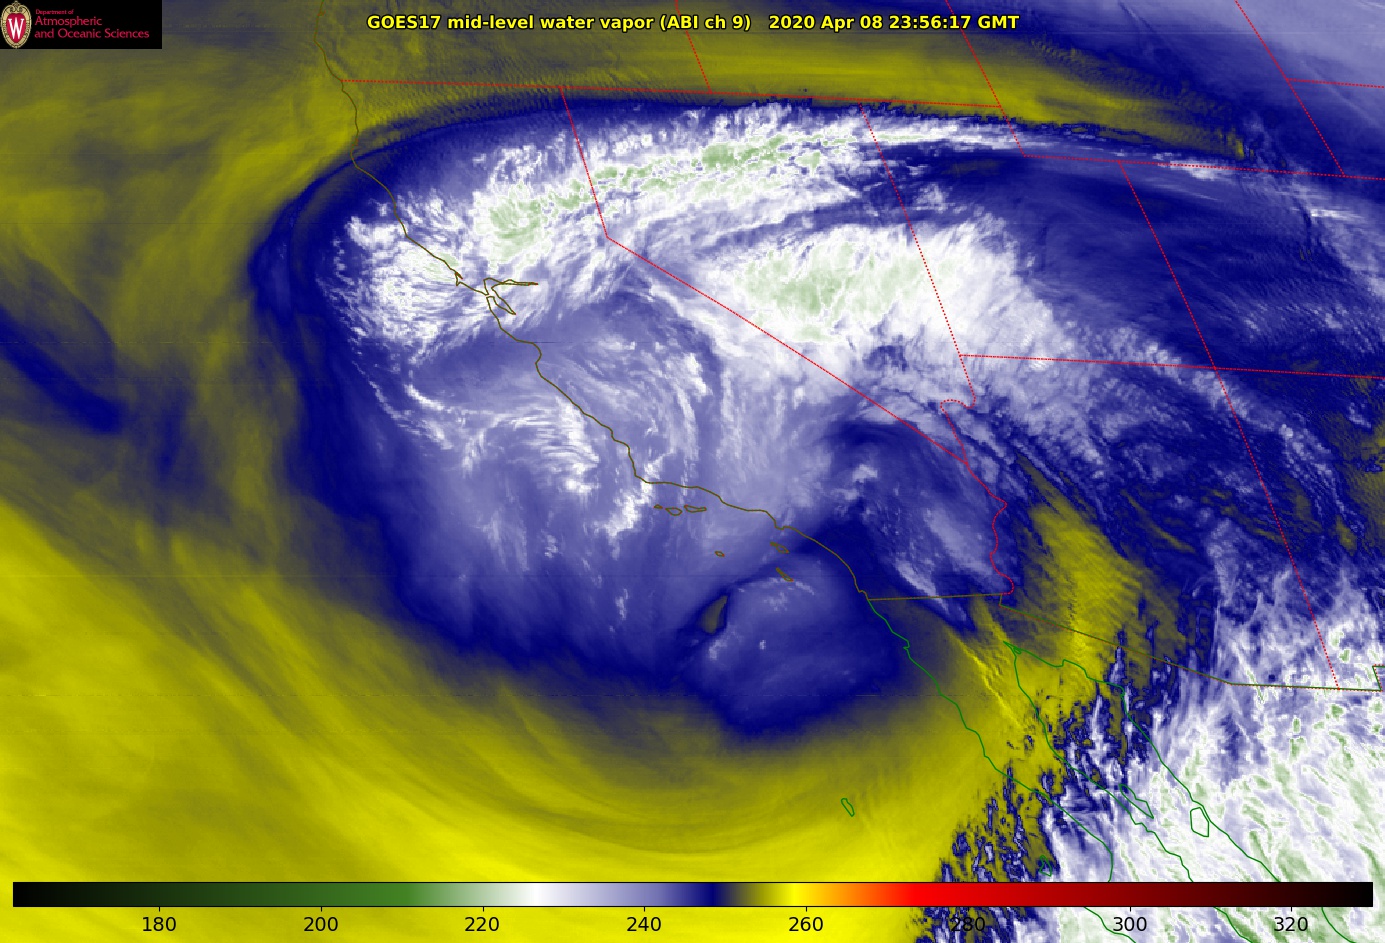
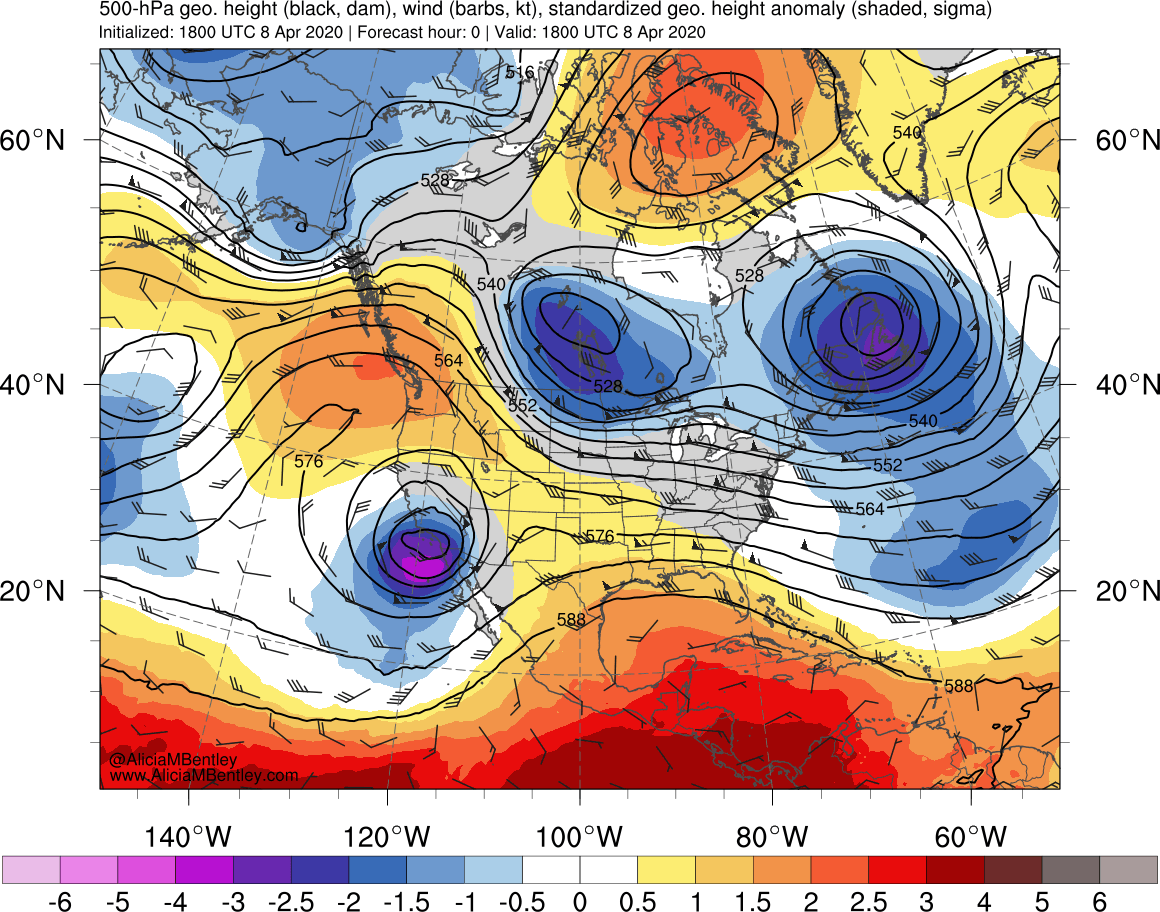
GOES-17 (GOES-West) Mid-level Water Vapor (6.9 µm) images from the AOS site (above) showed the broad circulation around an anomalously-deep middle tropospheric cutoff low centered along the California coast on 08 April 2020. The system was producing record daily rainfall amounts, which in tandem with the clouds kept daily high temperatures at record low... Read More
![GOES-17 Mid-level Water Vapor (6.9 µm) images [click to play animation | MP4]](https://cimss.ssec.wisc.edu/satellite-blog/images/2020/04/200408_goes17_waterVapor_Southwest_US_anim.gif)
GOES-17 Mid-level Water Vapor (6.9 µm) images [click to play animation | MP4]
Overlapping 1-minute Mesoscale Domain Sectors provided GOES-17 “Red” Visible (0.64 µm) images at 30-second intervals (below) — which revealed the southeastward propagation of a compact circulation of clouds west of San Nicholas Island.

GOES-17 “Red” Visible (0.64 µm) images [click to play animation | MP4]
View only this post Read Less
