1-minute Mesoscale Domain Sector GOES-16 (GOES-East) “Red” Visible (0.64 µm) and “Clean” Infrared Window (10.35 µm) images (above) displayed the exposed low-level circulation of Invest 90L, in the Atlantic Ocean (about 150 miles northeast of Bermuda, TXKF) on 21 May 2021.GOES-16 Visible images with plots of Visible Derived Motion Winds (below) revealed a few wind speeds of 50 knots or greater... Read More
![GOES-16 Visible and Infrared images [click to play animation | MP4]](https://cimss.ssec.wisc.edu/satellite-blog/images/2021/05/sts_vis-20210521_203422.png)
GOES-16 “Red” Visible (0.64 µm) and “Clean” Infrared Window (10.35 µm) images [click to play animation | MP4]
1-minute
Mesoscale Domain Sector GOES-16
(GOES-East) “Red” Visible (
0.64 µm) and “Clean” Infrared Window (
10.35 µm) images
(above) displayed the exposed low-level circulation of Invest 90L, in the Atlantic Ocean (about 150 miles northeast of Bermuda, TXKF) on 21 May 2021.
GOES-16 Visible images with plots of Visible Derived Motion Winds (below) revealed a few wind speeds of 50 knots or greater (red wind barbs) within its northwest quadrant — but since no organized and sustained deep convection remained in close proximity to the low-level circulation, Invest 90L was not yet considered to be a tropical cyclone.
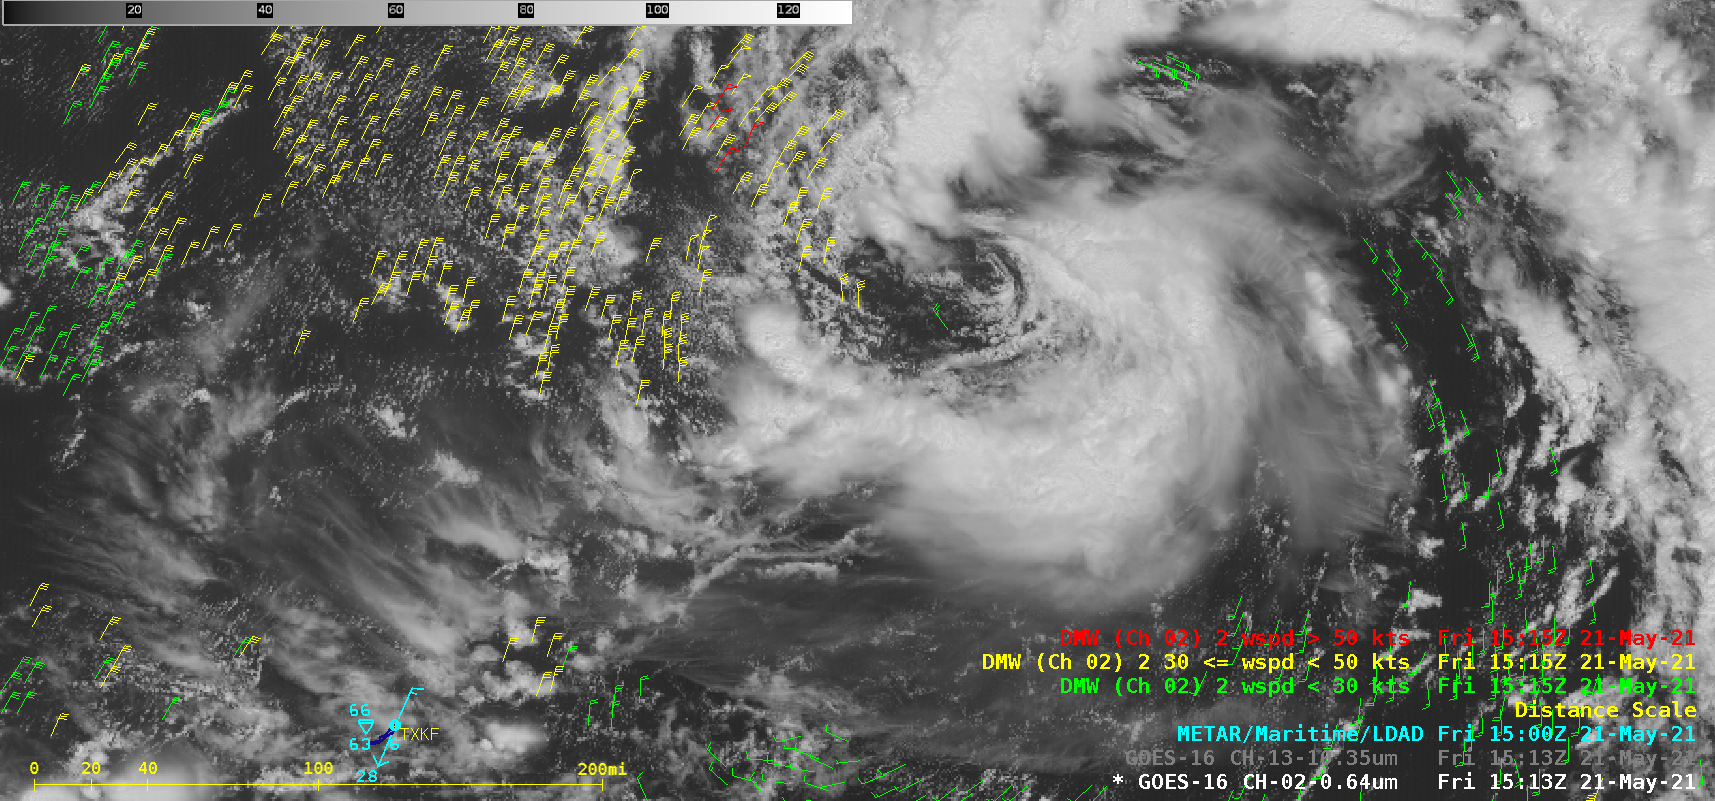
GOES-16 “Red” Visible (0.64 µm) images, with plots of Visible GOES-16 Derived Motion Winds [click to play animation | MP4]
===== 22 May Update =====
![GOES-16 "Clean" Infrared Window (10.35 µm) images [click to play animation | MP4]](https://cimss.ssec.wisc.edu/satellite-blog/images/2021/05/ana_ir-20210522_185121.png)
GOES-16 “Clean” Infrared Window (10.35 µm) images [click to play animation | MP4]
During the overnight hours, convection organized and intensified around the low-level circulation of Invest 90L — and as of 0900 UTC it was classified as
Subtropical Storm Ana. GOES-16 Infrared images of Ana are shown above.
A closer view of GOES-16 Visible images (below) indicated that the center of Ana eventually stopped moving southwestward toward Bermuda, performed a counterclockwise loop, then began moving to the northeast.
![GOES-16 "Red" Visible (0.64 µm) images [click to play animation | MP4]](https://cimss.ssec.wisc.edu/satellite-blog/images/2021/05/G16_VIS_STS_ANA_22MAY2021_B2_2021142_170921_GOES-16_0001PANEL_FRAME0000490.GIF)
GOES-16 “Red” Visible (0.64 µm) images [click to play animation | MP4]
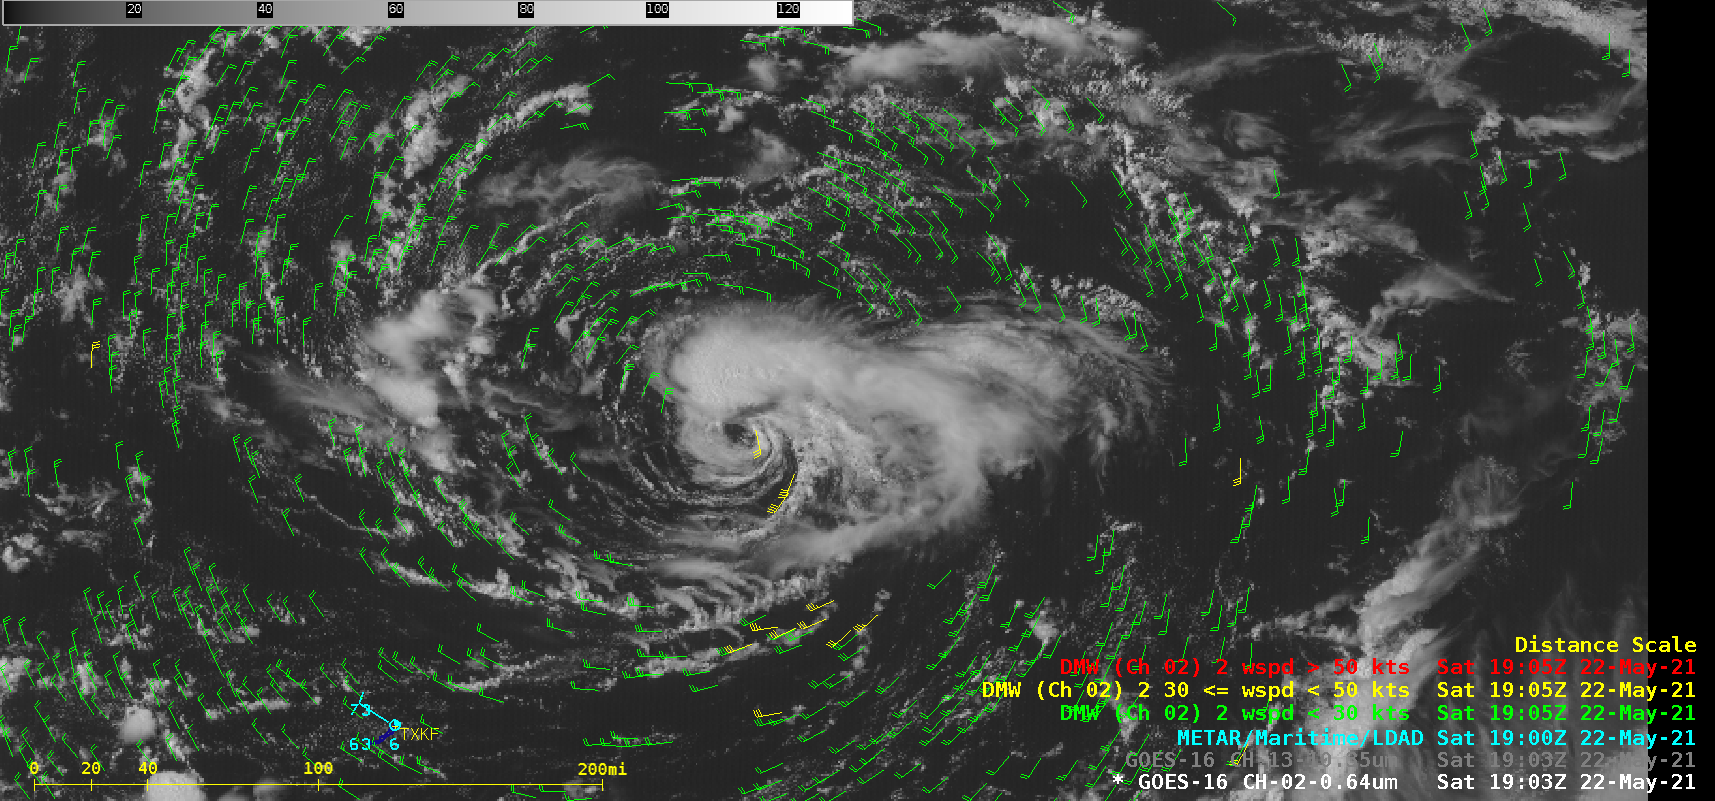
GOES-16 Visible images with plots of Derived Motion Winds
(below) indicated that the maximum near-surface wind speeds were 39 knots.
![GOES-16 "Red" Visible (0.64 µm) images, with plots of Derived Motion Winds [click to play animation | MP4]](https://cimss.ssec.wisc.edu/satellite-blog/images/2021/05/ana_winds-20210522_190321.png)
GOES-16 “Red” Visible (0.64 µm) images, with plots of Visible GOES-16 Derived Motion Winds [click to play animation | MP4]
![GOES-16 "Red" Visible (0.64 µm) images, with plots of Metop-A ASCAT winds [click to enlarge]](https://cimss.ssec.wisc.edu/satellite-blog/images/2021/05/210522_g16_vis_ascat_STS_Ana.png)
GOES-16 “Red” Visible (0.64 µm) image at 1219 UTC, with plots of Metop-A ASCAT winds [click to enlarge]
An overpass of Metop-A at 1219 UTC provided ASCAT surface scatterometer winds centered on Ana
(above), with a maximum speed value of 31 knots just northwest of the storm center. In general, Visible GOES-16 Derived Motion Wind speed values were around 5 knots faster than nearby ASCAT winds
(below) — since the former are computed by tracking cloud targets that are above the surface, where winds speeds are greater (due to a lack of surface friction).
![GOES-16 "Red" Visible (0.64 µm) image at 1219 UTC, with plots of Visible GOES-16 Derived Motion Winds and Metop-A ASCAT winds [click to enlarge]](https://cimss.ssec.wisc.edu/satellite-blog/images/2021/05/210522_1219utc_goes16_visible_dmw_ascat_STS_Ana.png)
GOES-16 “Red” Visible (0.64 µm) image at 1219 UTC, with plots of Visible GOES-16 Derived Motion Winds and Metop-A ASCAT winds [click to enlarge]
View only this post
Read Less

![GOES-16 Split Window Difference images, with plots of wind barbs and gusts [click to play animation | MP4]](https://cimss.ssec.wisc.edu/satellite-blog/images/2021/05/210524_goes16_splitWndowDifferencewinds_ND_MN_anim.gif)
![GOES-16 Split Window Difference images, with plots of surface visibility [click to play animation | MP4]](https://cimss.ssec.wisc.edu/satellite-blog/images/2021/05/210524_goes16_splitWindowDifference_visiblity_ND_MN_anim.gif)
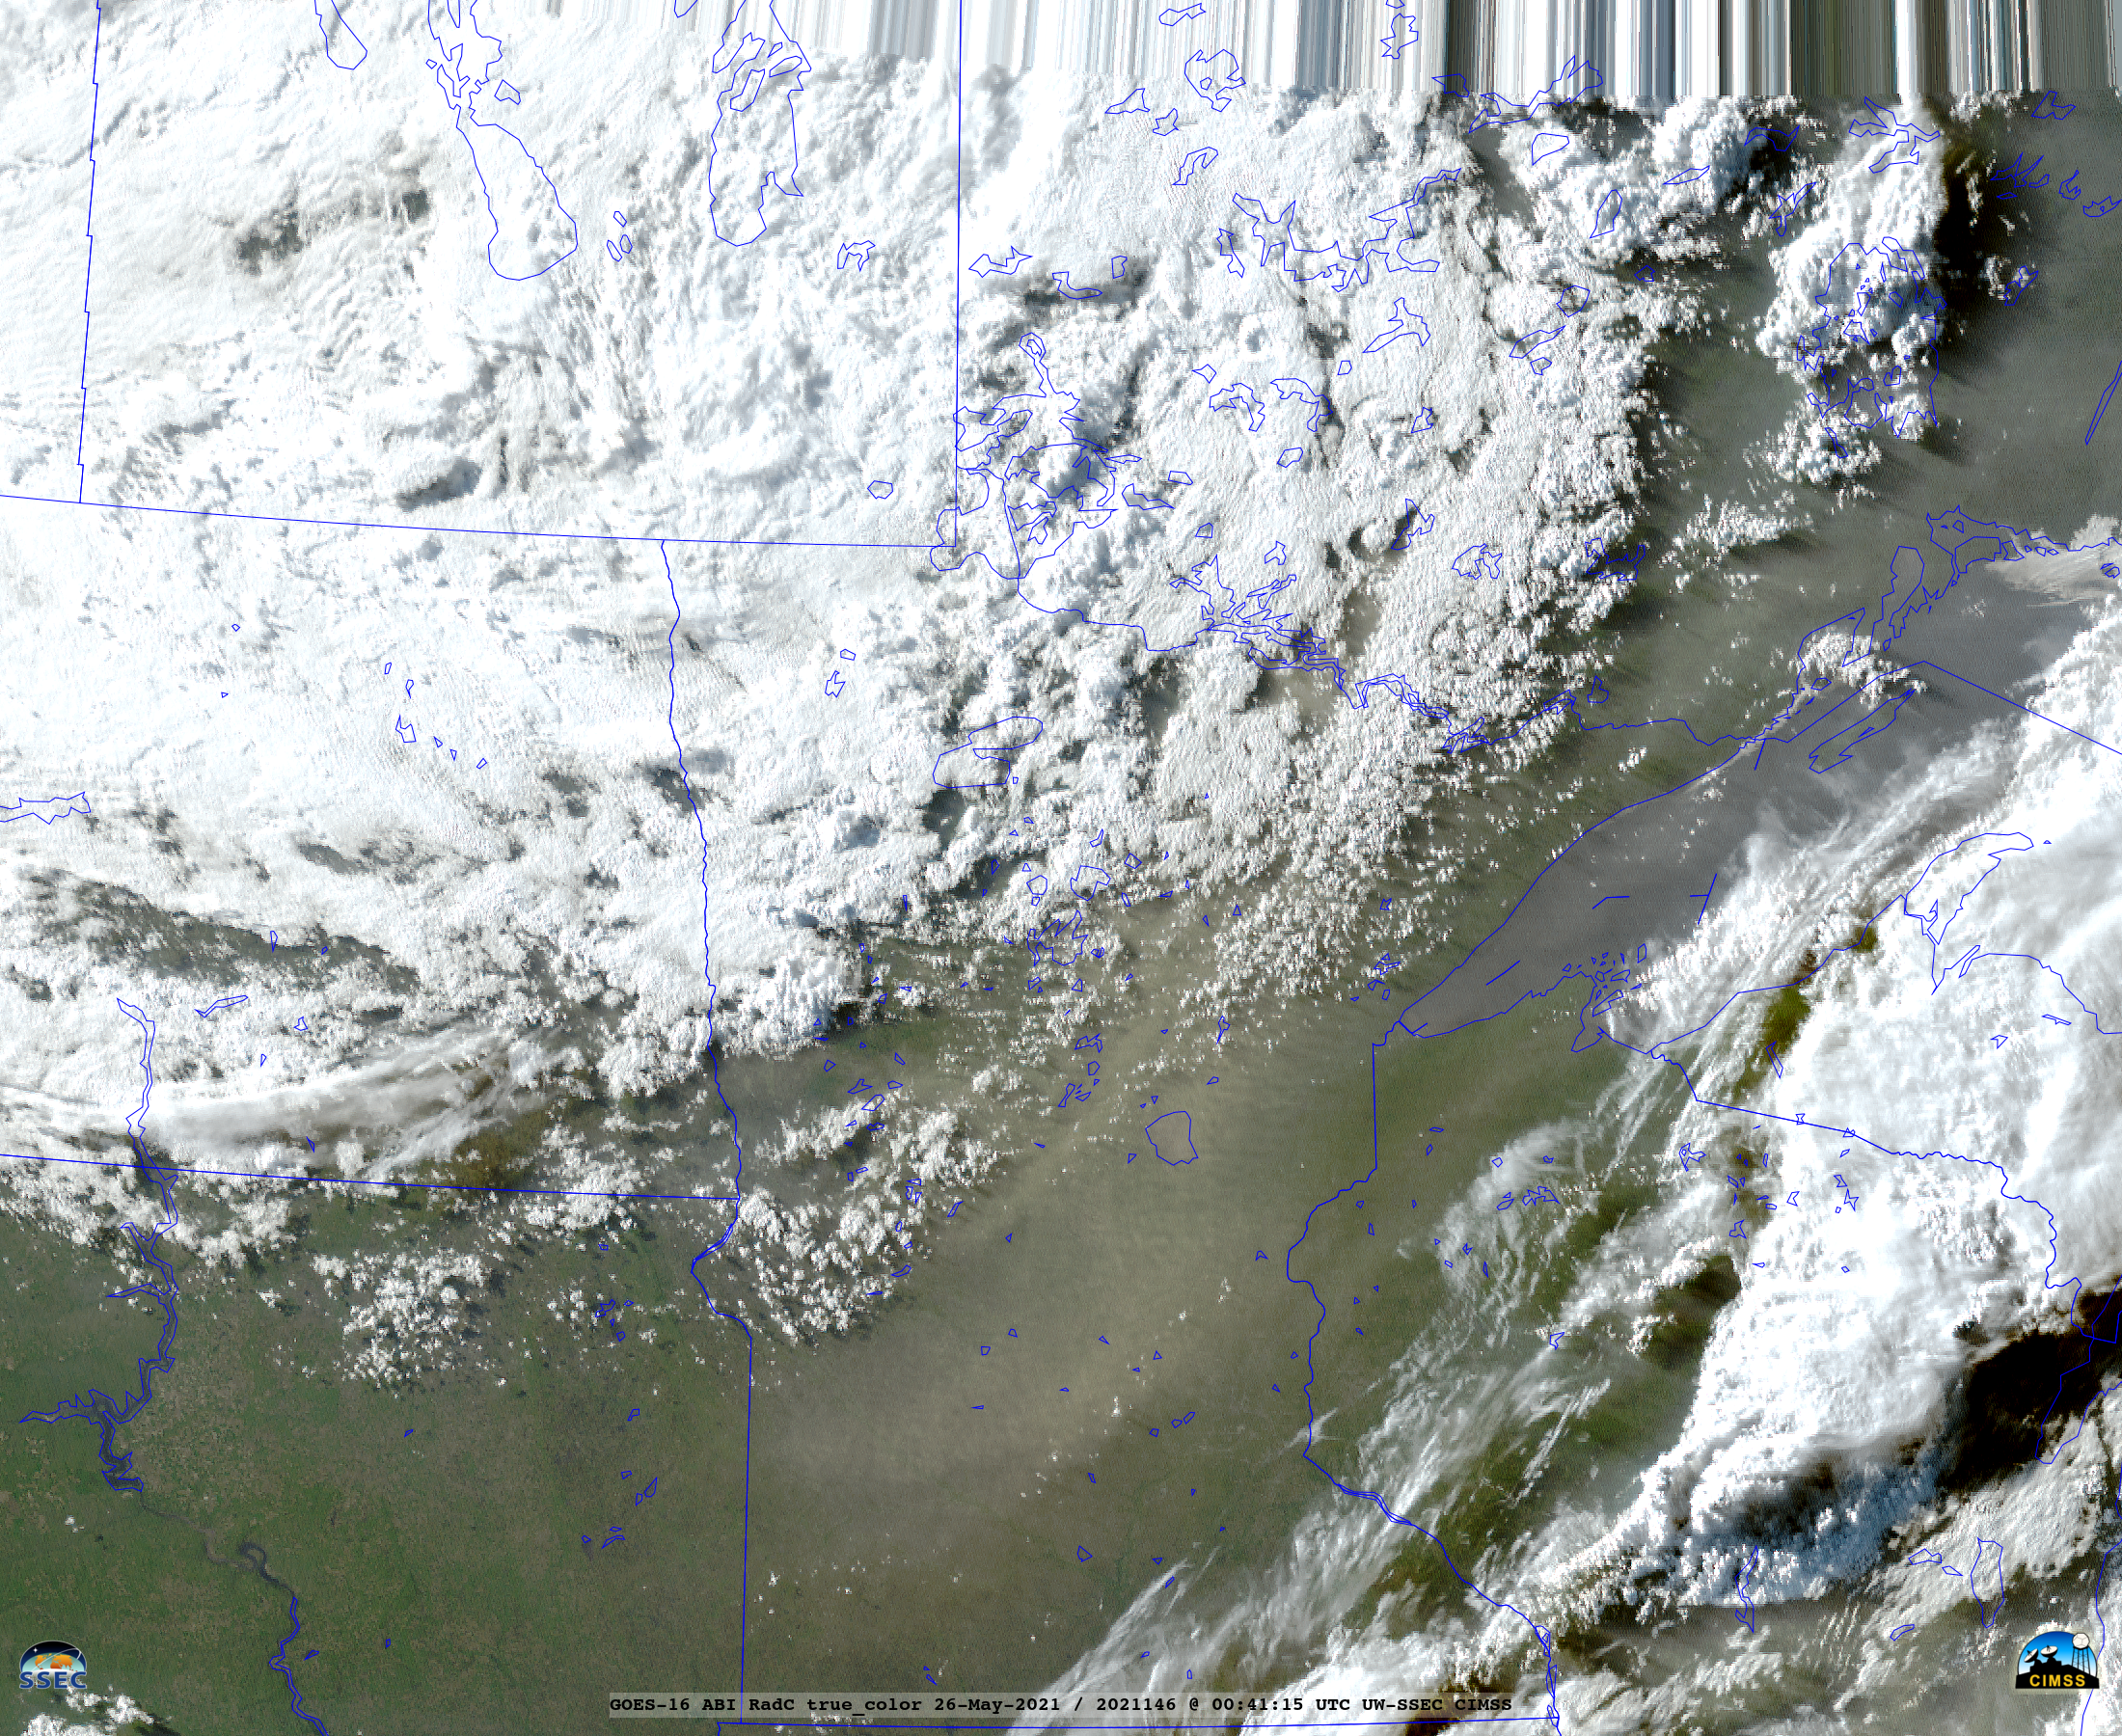
![GOES-16 True Color RGB images [click to play animation | MP4]](https://cimss.ssec.wisc.edu/satellite-blog/images/2021/05/210524_goes16_trueColorRGB_ND_MN_blowing_dust_anim.gif)
![GOES-16 Dust RGB images, with and without plots of surface reports [click to play animation | MP4]](https://cimss.ssec.wisc.edu/satellite-blog/images/2021/05/210525_goes16_dustRGB_ND_MN_blowing_dust_anim.gif)
![GOES-16 True Color RGB images [click to play animation | MP4]](https://cimss.ssec.wisc.edu/satellite-blog/images/2021/05/210525_goes16_trueColorRGB_ND_SD_MN_blowing_dust_anim.gif)
![GOES-16 Visible and Infrared images [click to play animation | MP4]](https://cimss.ssec.wisc.edu/satellite-blog/images/2021/05/210521_goes16_visible_infrared_Invest90L_anim.gif)
![GOES-16 "Clean" Infrared Window (10.35 µm) images [click to play animation | MP4]](https://cimss.ssec.wisc.edu/satellite-blog/images/2021/05/210522_goes16_infrared_STS_Ana_anim.gif)
![GOES-16 "Red" Visible (0.64 µm) images [click to play animation | MP4]](https://cimss.ssec.wisc.edu/satellite-blog/images/2021/05/210522_goes16_visible_STS_Ana_anim.gif)
![GOES-16 "Red" Visible (0.64 µm) images, with plots of Derived Motion Winds [click to play animation | MP4]](https://cimss.ssec.wisc.edu/satellite-blog/images/2021/05/210522_goes16_visible_derivedMotionWinds_STS_Ana_anim.gif)
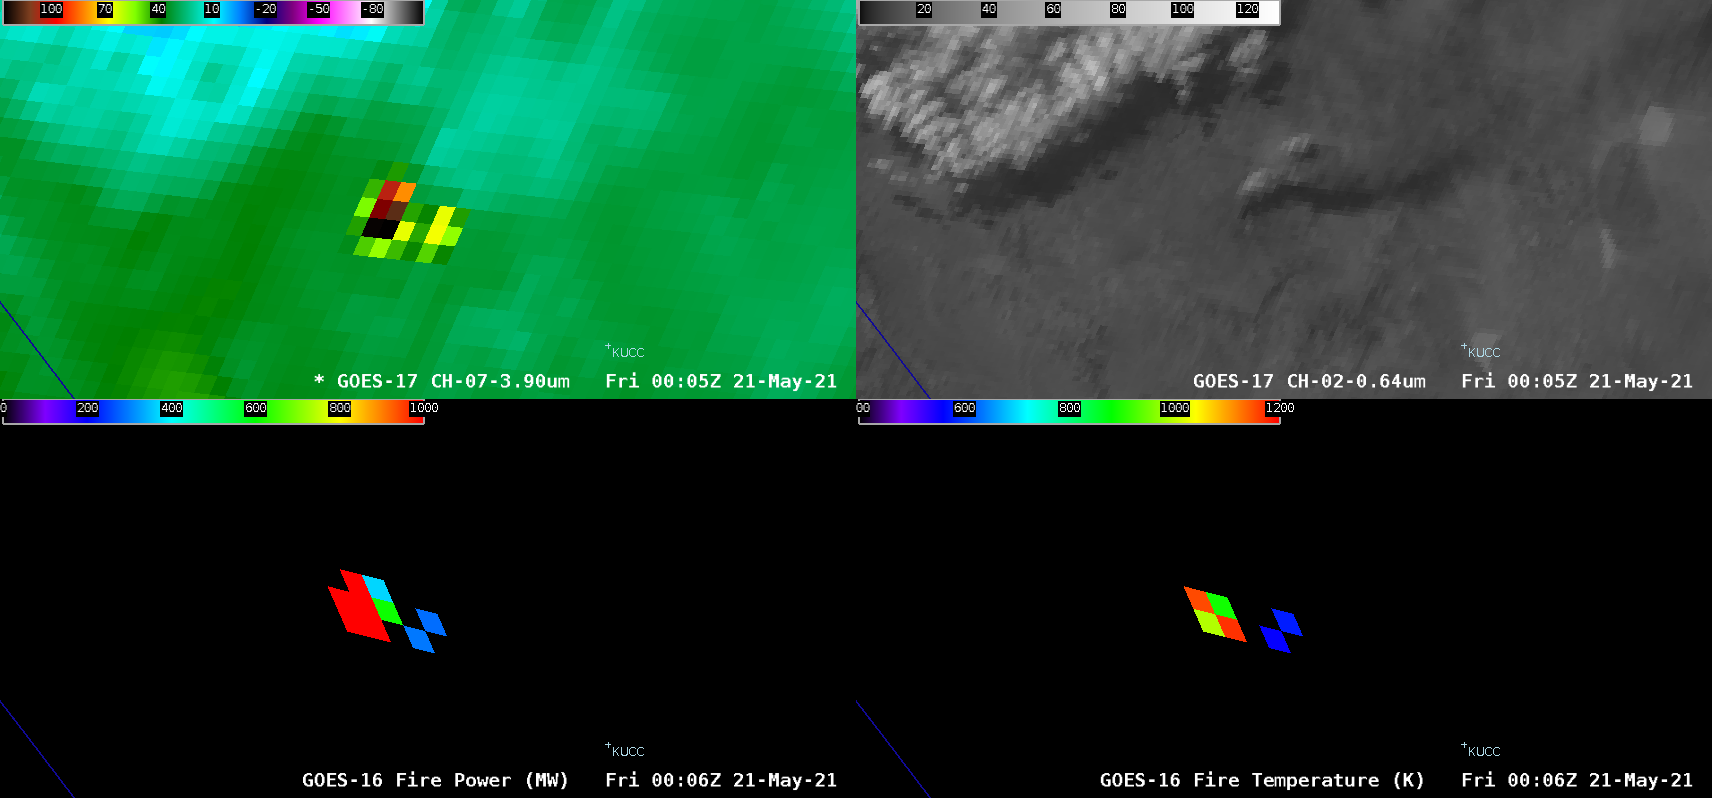

![NOAA-20 VIIRS Shortwave Infrared (3.74 µm) and True Color RGB images at 2014 UTC [click to enlarge]](https://cimss.ssec.wisc.edu/satellite-blog/images/2021/05/210520_2014utc_noaa20_viirs_shortwaveInfrared_trueColorRGB_NV_fire_anim.gif)
