This website works best with a newer web browser such as Chrome, Firefox, Safari or Microsoft
Edge. Internet Explorer is not supported by this website.
5-minute CONUS Sector GOES-19 (GOES-East) Visible images (above) showed a rapidly intensifying Hurricane Force Low (surface analyses) that was approaching Atlantic Canada on 04 November 2025.Two examples of Metop ASCAT surface scatterometer winds having speed values greater than Category 1 hurricane intensity are shown below. 5-minute GOES-19 Water Vapor images (below) depicted a mid-tropospheric... Read More
GOES-19 Visible images with plots of surface reports (yellow), buoy reports (cyan), surface pressure (beige) and surface fronts (violet), from 1051-2001 UTC on 04 November [click to play MP4 animation]
5-minute CONUS Sector GOES-19 (GOES-East) Visible images (above) showed a rapidly intensifying Hurricane Force Low (surface analyses) that was approaching Atlantic Canada on 04 November 2025.
Two examples of Metop ASCAT surface scatterometer winds having speed values greater than Category 1 hurricane intensity are shown below.
GOES-19 Visible image at 1321 UTC, with a cursor sample of a Metop ASCAT wind vector having a speed value of 68 kts [click to enlarge]
GOES-19 Visible image at 1416 UTC, with a cursor sample of a Metop ASCAT wind vector having a speed value of 72 kts [click to enlarge]
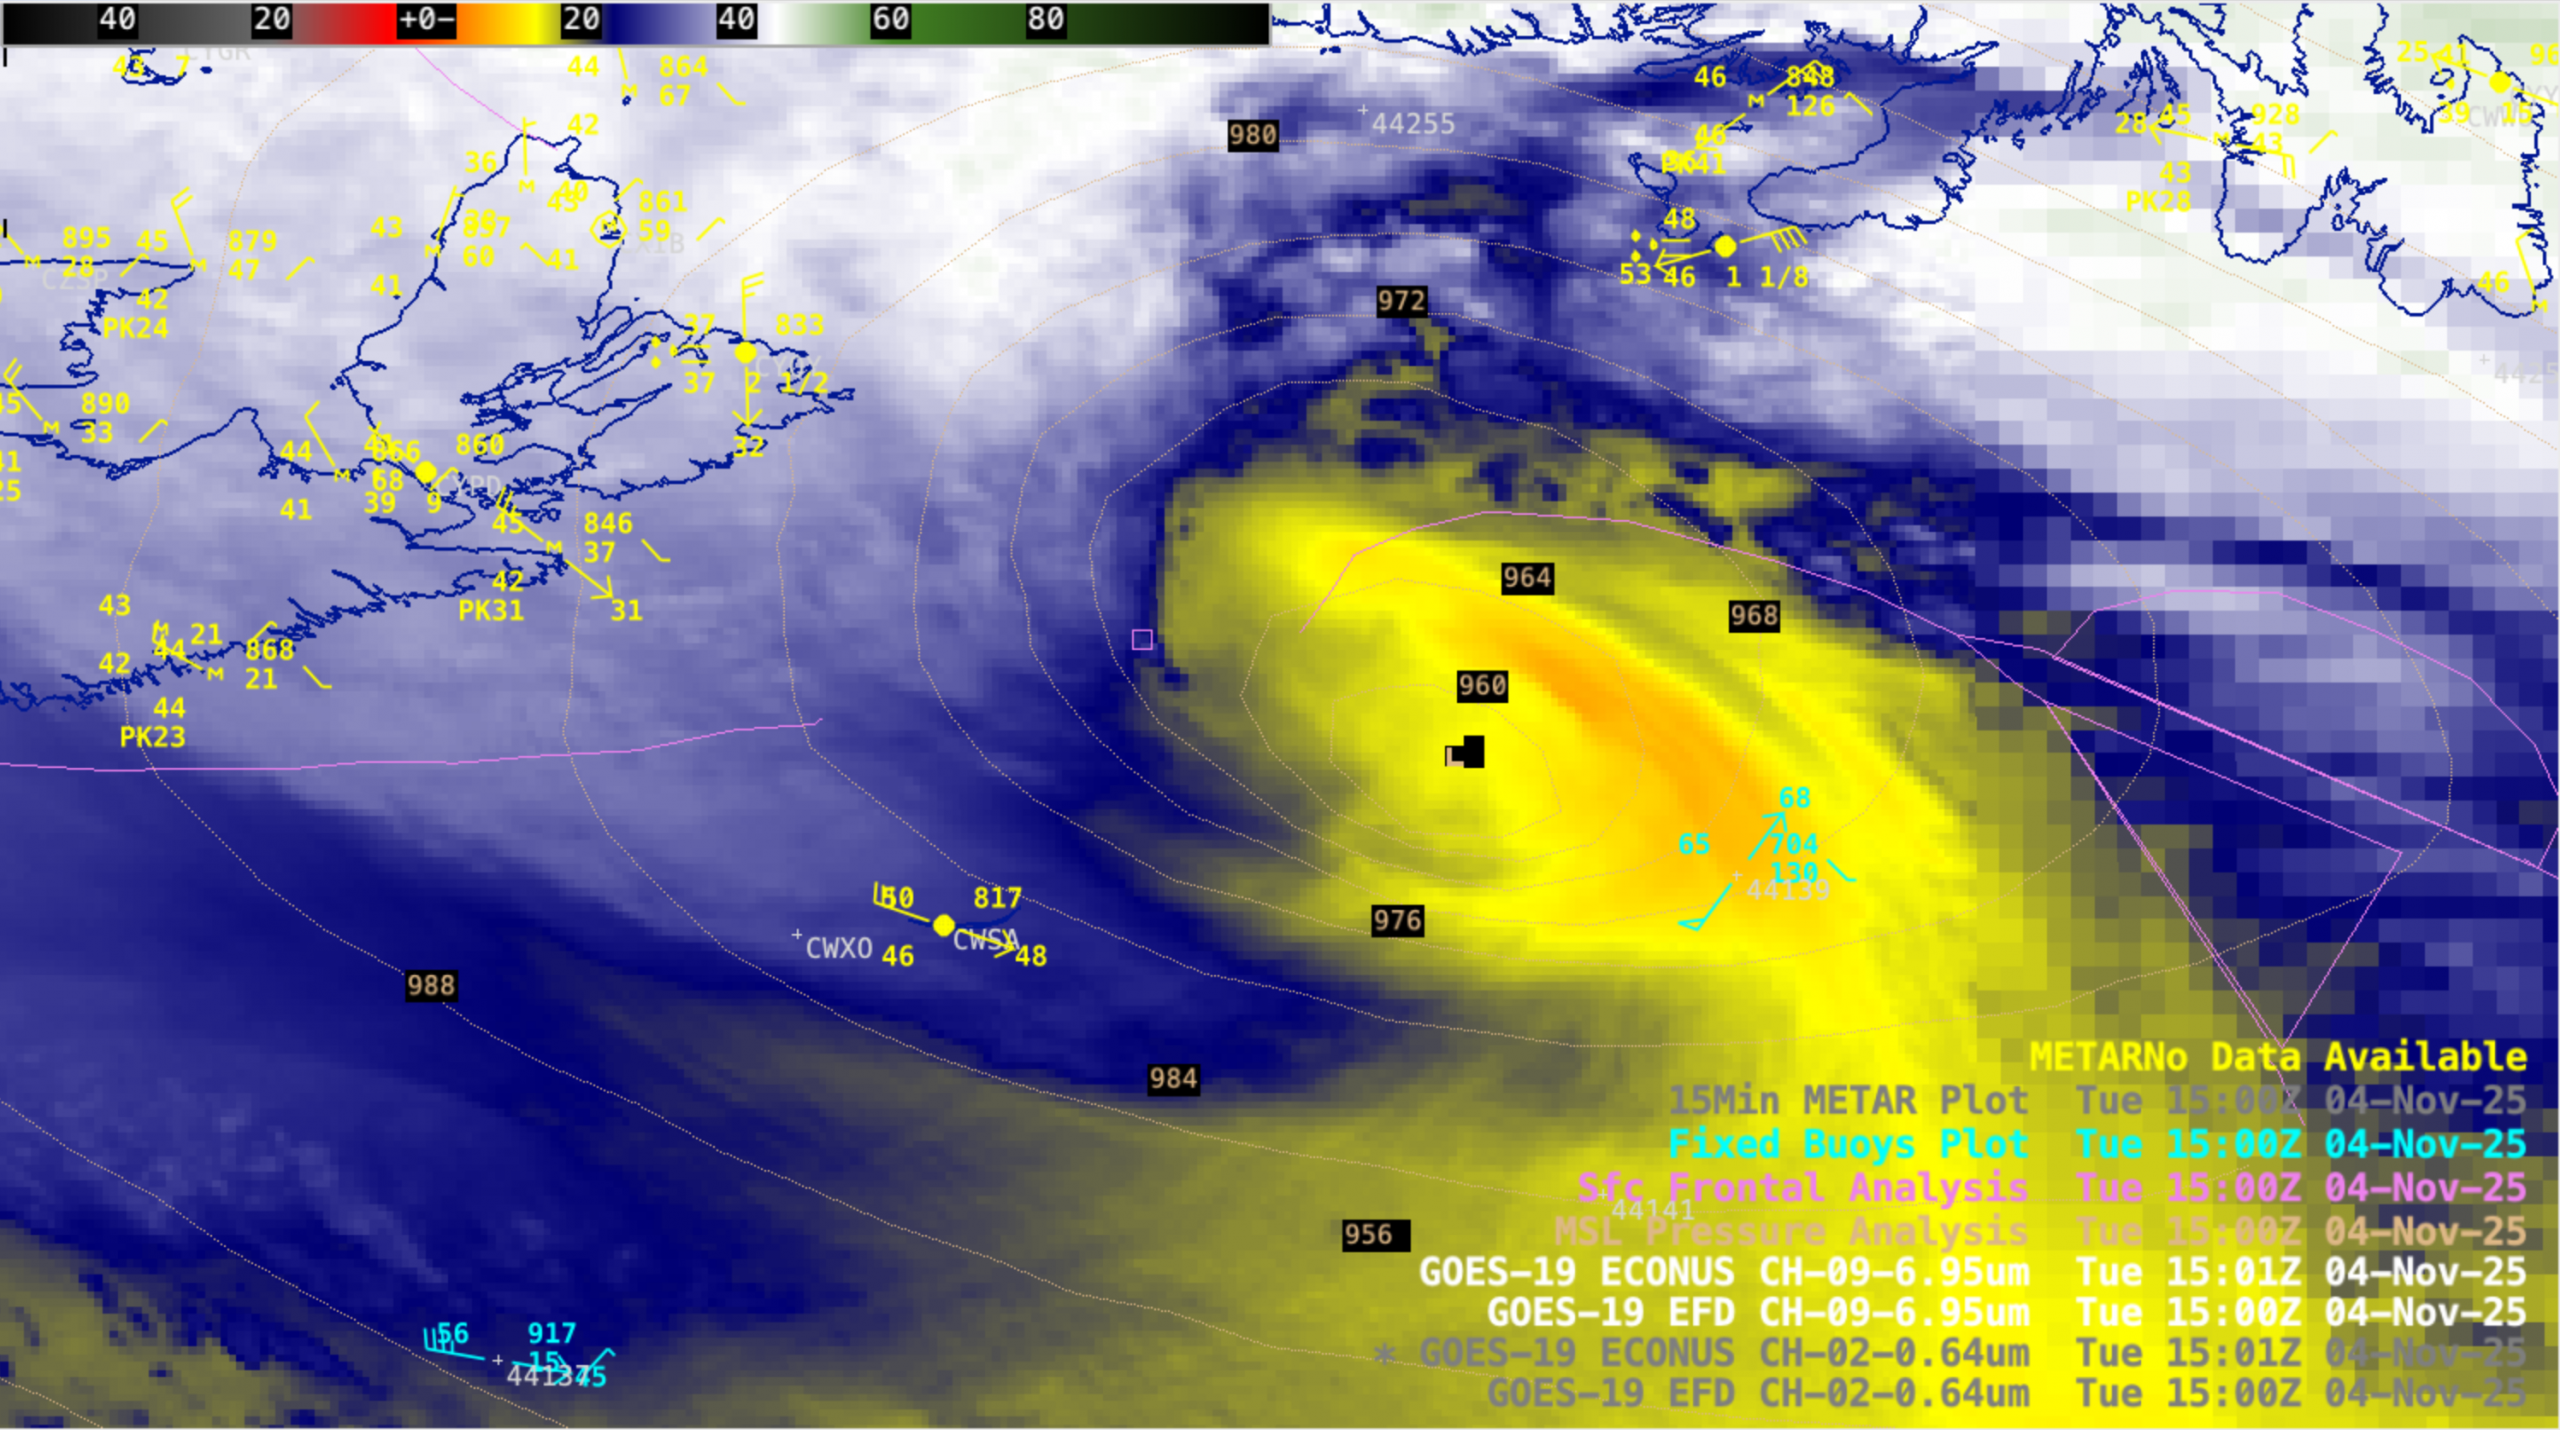
5-minute GOES-19 Water Vapor images (below) depicted a mid-tropospheric filament of dry air (shades of yellow to orange) that wrapped into the circulation of the storm. Peak wind gusts at METAR sites along the southern coast of Newfoundland included 83 kts at Sagona Island.
GOES-19 Water Vapor images with plots of surface reports (yellow), buoy reports (cyan), surface pressure (beige) and surface fronts (violet), from 0936-2201 UTC on 04 November [click to play MP4 animation]
A NUCAPS profile within the dry filament showed the depth of very dry air throughout the troposphere (below).
GOES-19 Water Vapor image at 1631 UTC on 04 November, with the location of a NUCAPS profile within the dry filament circled in black [click to enlarge]
NUCAPS profile of temperature (red) and dew point (green) at the black circled location within the dry filament in GOES-19 Water Vapor imagery [click to enlarge]
10-minute GOES-19 True Color RGB images (below) revealed an area of water that exhibited a hazy appearance — this was due to enhanced scattering of light off of highly-agitated seas with large waves and abundant sea spray (caused by a localized area of very strong winds).
GOES-19 True Color RGB images [click to play MP4 animation]
At 1501 UTC (Visible image | True Color RGB image) this area of hazy-appearing water was located just SSE of Buoy 44139 — where the peak wind gust was 68 kts, the maximum wave height was 31 ft and upwelling (caused by significant wind/wave action) cooled the water temperature by 6.5 degrees F in 6 hours (below).
Plots of wind speed (blue), wind gusts (red) and air pressure (green) at Buoy 44139 on 04 November
Plot of wave height at Buoy 44139 on 04 November
Plot of water temperature at Buoy 44139 on 04 November
A Synthetic Aperture Radar (SAR) image (source) from RCM-1 (below) showed the strong winds (shades of red) around the periphery of the storm center as it was located just south of the Newfoundland coast at 2132 UTC. Note the light wind speeds (shades of cyan to blue) in the vicinity of the storm center.
RCM-1 Synthetic Aperture Radar image at 2132 UTC on 04 November [click to enlarge]
Long-time residents of the Great Lakes region know the significant impact that the lakes can have on the local weather. One of the most familiar effects is the lake breeze. Because it takes a long time for the lakes to warm up after winter while the land heats up comparatively... Read More
Long-time residents of the Great Lakes region know the significant impact that the lakes can have on the local weather. One of the most familiar effects is the lake breeze. Because it takes a long time for the lakes to warm up after winter while the land heats up comparatively quickly, during the spring and early summer the lakes are much cooler than the surrounding land. This creates a density gradient which forces a baroclinic circulation, resulting in a cool breeze blowing from the lake to the land.
However, in the fall the opposite can happen. Just as it takes the lakes a long time to warm up in the spring, it takes a long time for them to cool down in the fall. At the same time, the land cools off quickly, especially at night. This creates a similar gradient as the springtime lake breeze, but this time the gradient is reversed. As a result, an offshore flow of cool air flows toward the lake.
An example of this can be seen in the GOES-19 satellite imagery over Lake Michigan on the morning of October 30 2025. Overnight, the outer edges of a midlatitude cyclone centered over the southeast continental United States pushed moisture and cloudiness westward across Lake Michigan. Earlier in the evening, the eastward motion was able to propagate unabated cross the lake and into Wisconsin. However, as the night grew longer, the land breeze developed and served as a counterbalancing force, creating an edge to the cloudiness that persisted until sunrise.
The following animation shows this process in detail. It begins at 2130 UTC (3:30 PM local time) on the 29th and depicts both the GOES-19 Band 13 (10.3 micron) brightness temperature and the surface weather observations. Given the fact that this event transitions from day to night and back to day again, looking at a single-channel infrared loop allows us to use the same product for the entire period. A visible product is not usable at night, and many RGB products rely on shortwave channels and thus cannot be easily interpreted for both day and night scenes.
Note that at the beginning of the loop, the air temperature recorded by the buoy in the middle of the lake is not that different from the air temperatures from sites in western Wisconsin. At 0230 UTC (9:30 PM local time) the central lake buoy records an air temperature of 54 F with a northeasterly wind. Racine, Wisconsin, shows an air temperature of 52 F at the same time, with the same northeasterly wind. However, as the sun sets, the temperature difference grows as the night continues. By 0530 UTC (12:30 AM local time) the situation has significantly changed. The buoy is in a location with very little nocturnal cooling: it has drooped one degree to 51 F. However, Racine has cooled substantially and is now reporting a temperature of 45 F. Furthermore, the buoy wind is still northeasterly while the wind at Racine is now northwesterly. This flip in the wind direction indicates that the land breeze has formed.
At 10 UTC the temperature gradient has gotten even stronger: 50 F for the lake air and 40 F for the terrestrial air, and by 1100 UTC (6:00 AM local time) the lake breeze is visible on the satellite as an edge to the cloudiness over the lake running roughly parallel to the lake’s western shore. Cloud were forming over the lake as the relatively warm and moist lake surface was able to create convection in the cooler air lying higher up. However, the advancing land breeze stabilized the air and inhibited convection where it advanced. This boundary is clearly visible on the night microphysics RGB. (Note also the large regions of fog throughout many parts of Wisconsin. These are identifiable as the areas of light green. The valley fogs forming in the river valleys of western Wisconsin are particularly notable).
As the sun rises, however, the temperature gradient breaks down. The land near the shore is able to heat up much more quickly than the lake is. By 1400 UTC (9:00 AM local time) the lake is only 6 degrees warmer than the land stations. The larger-scale synoptic winds are able to overcome the land breeze and push the clouds ashore. This animation from CSPP Geosphere shows the night to day transition.
Note that the land breeze front is better maintained in the northern part of the lake. There are a couple of reasons for this. First, it is colder up there. Overnight, terrestrial air temperatures dropped to the mid 30s F while the lake air temperatures remained around 50 F. Second, the presence of fog near shore means that less solar energy is available to change the temperature of the land due to reflection and latent heating. Thus, the gradient persists longer and the lake breeze is still able to inhibit convection over the western part of Lake Michigan.
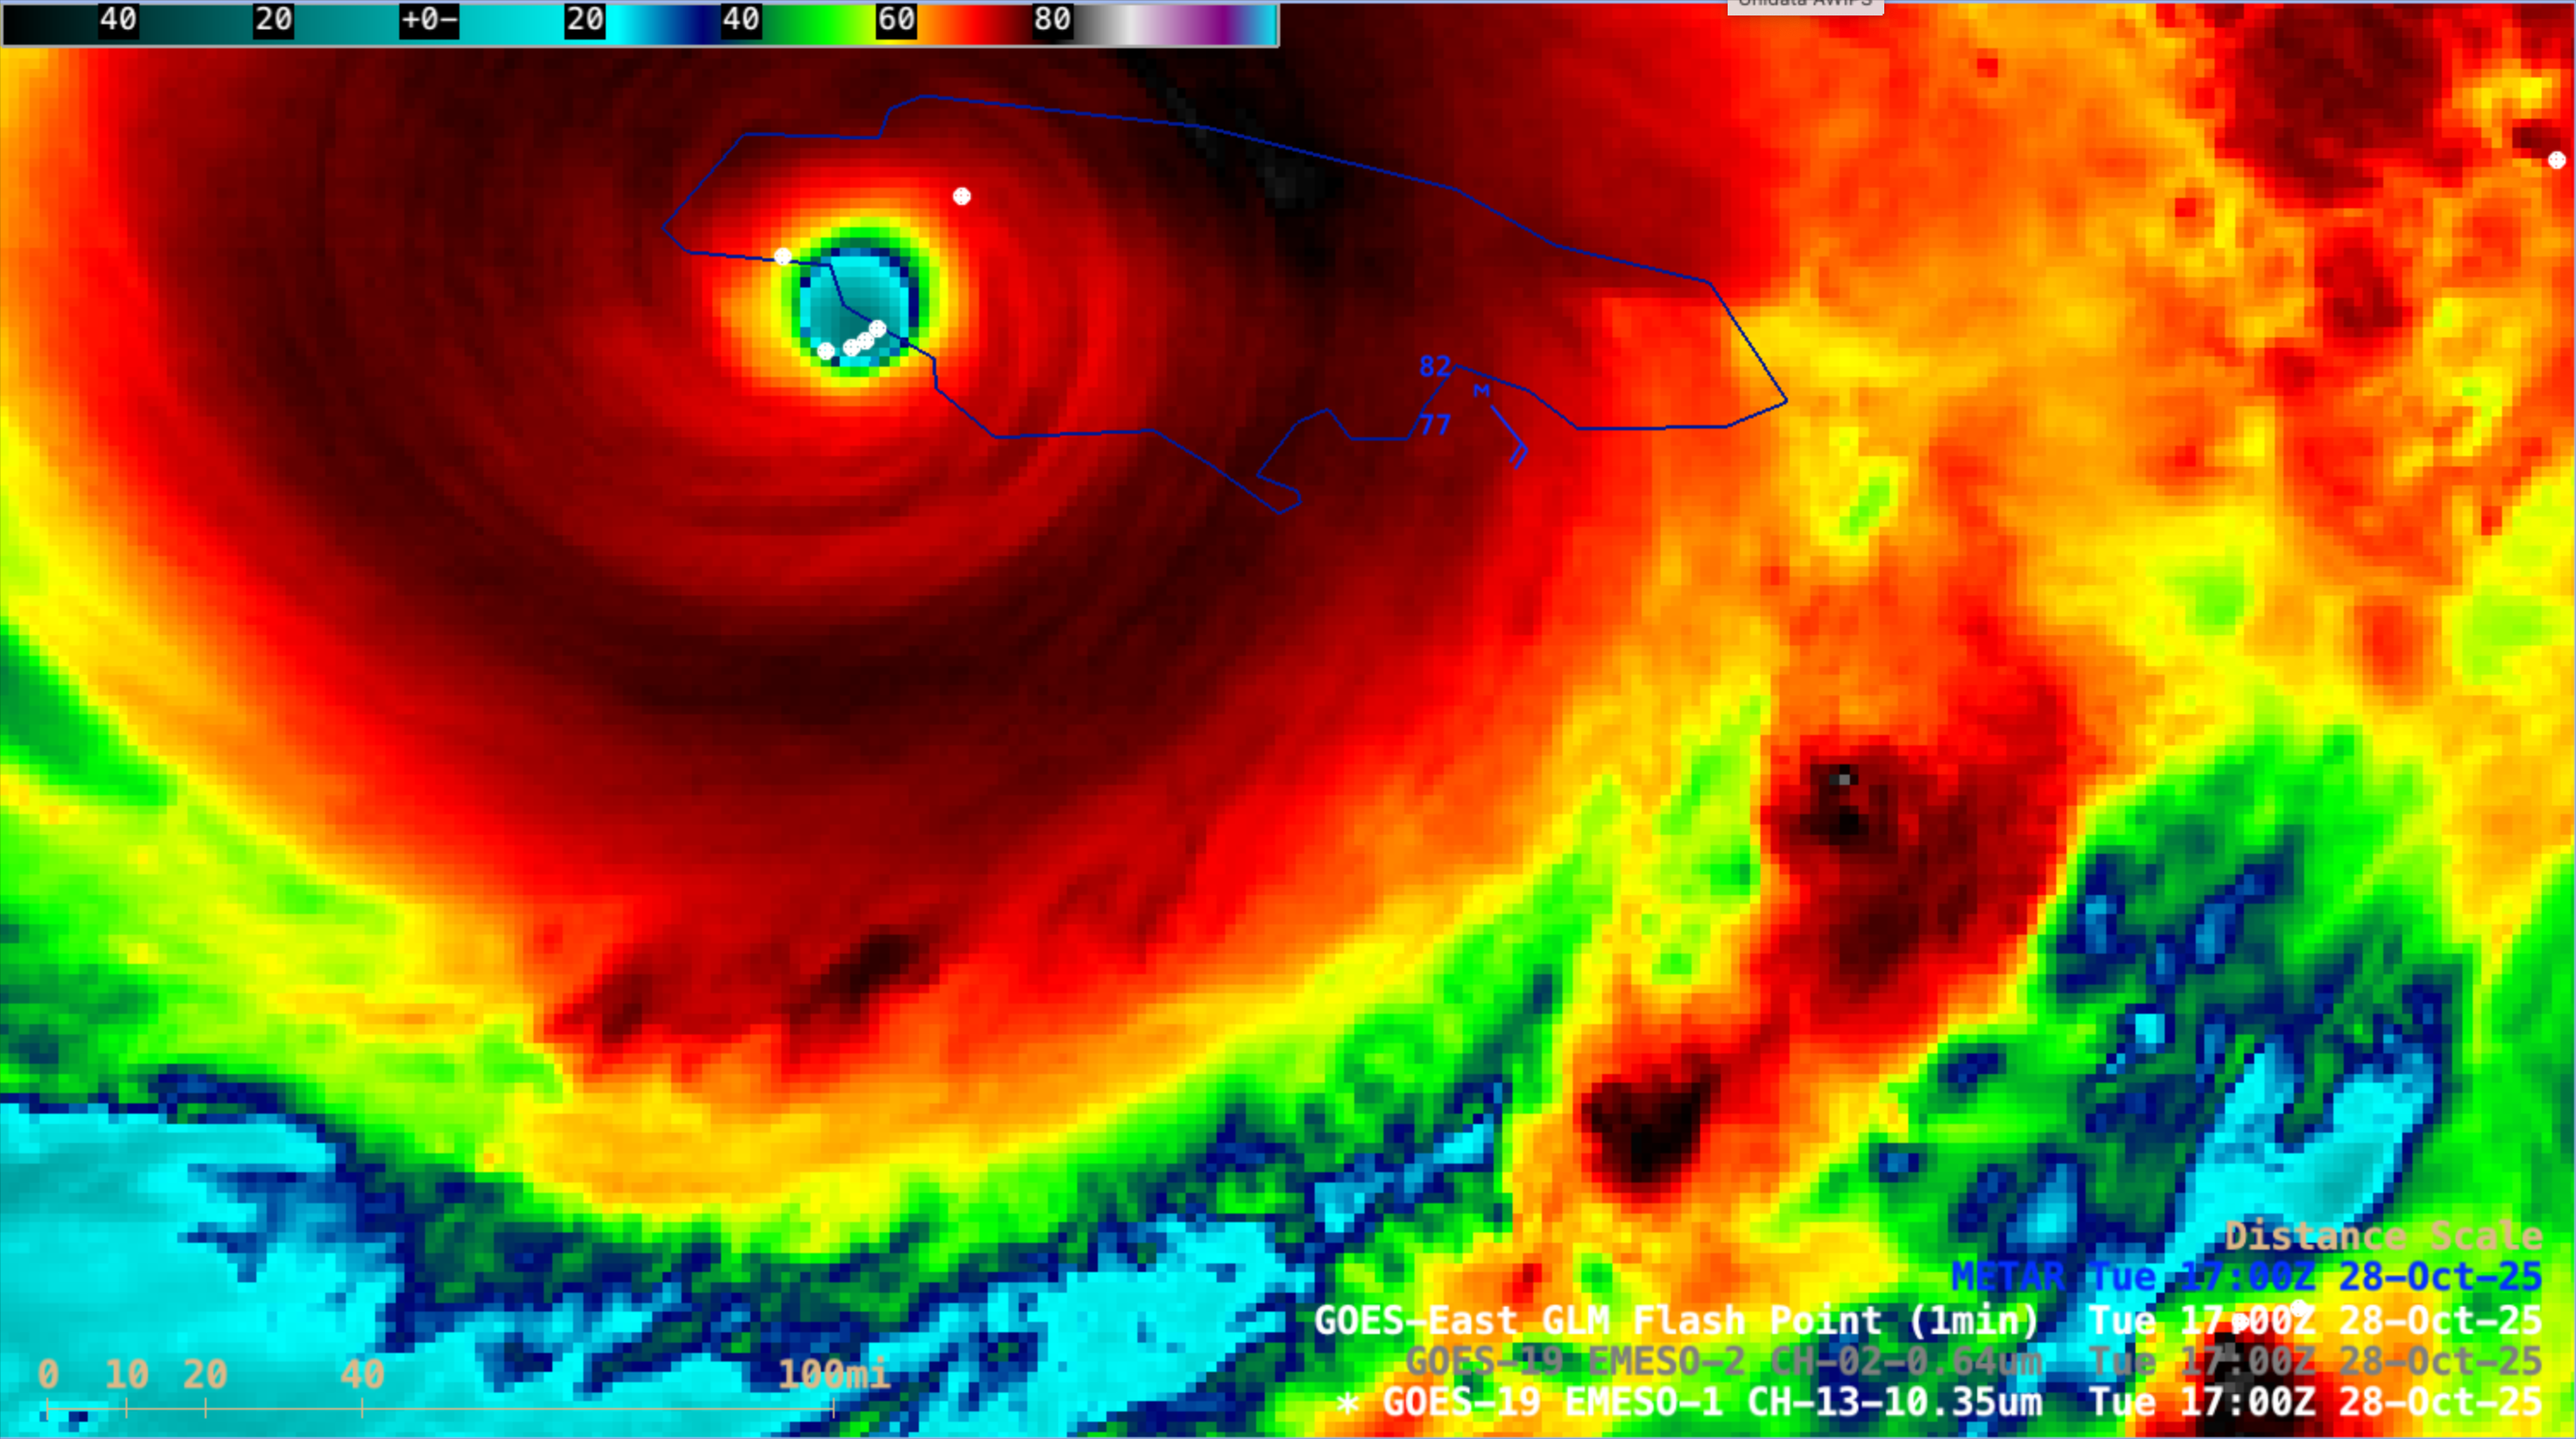
1-minute Mesoscale Domain Sector GOES-19 (GOES-East) Visible and Infrared images (above) showed Category 5 Hurricane Melissa as it made landfall along the far southwest coast of Jamaica around 1700 UTC on 28 October 2025. Low-altitude mesovortices were evident within the eye — and GLM Flash Points revealed abundant lightning activity within the inner... Read More
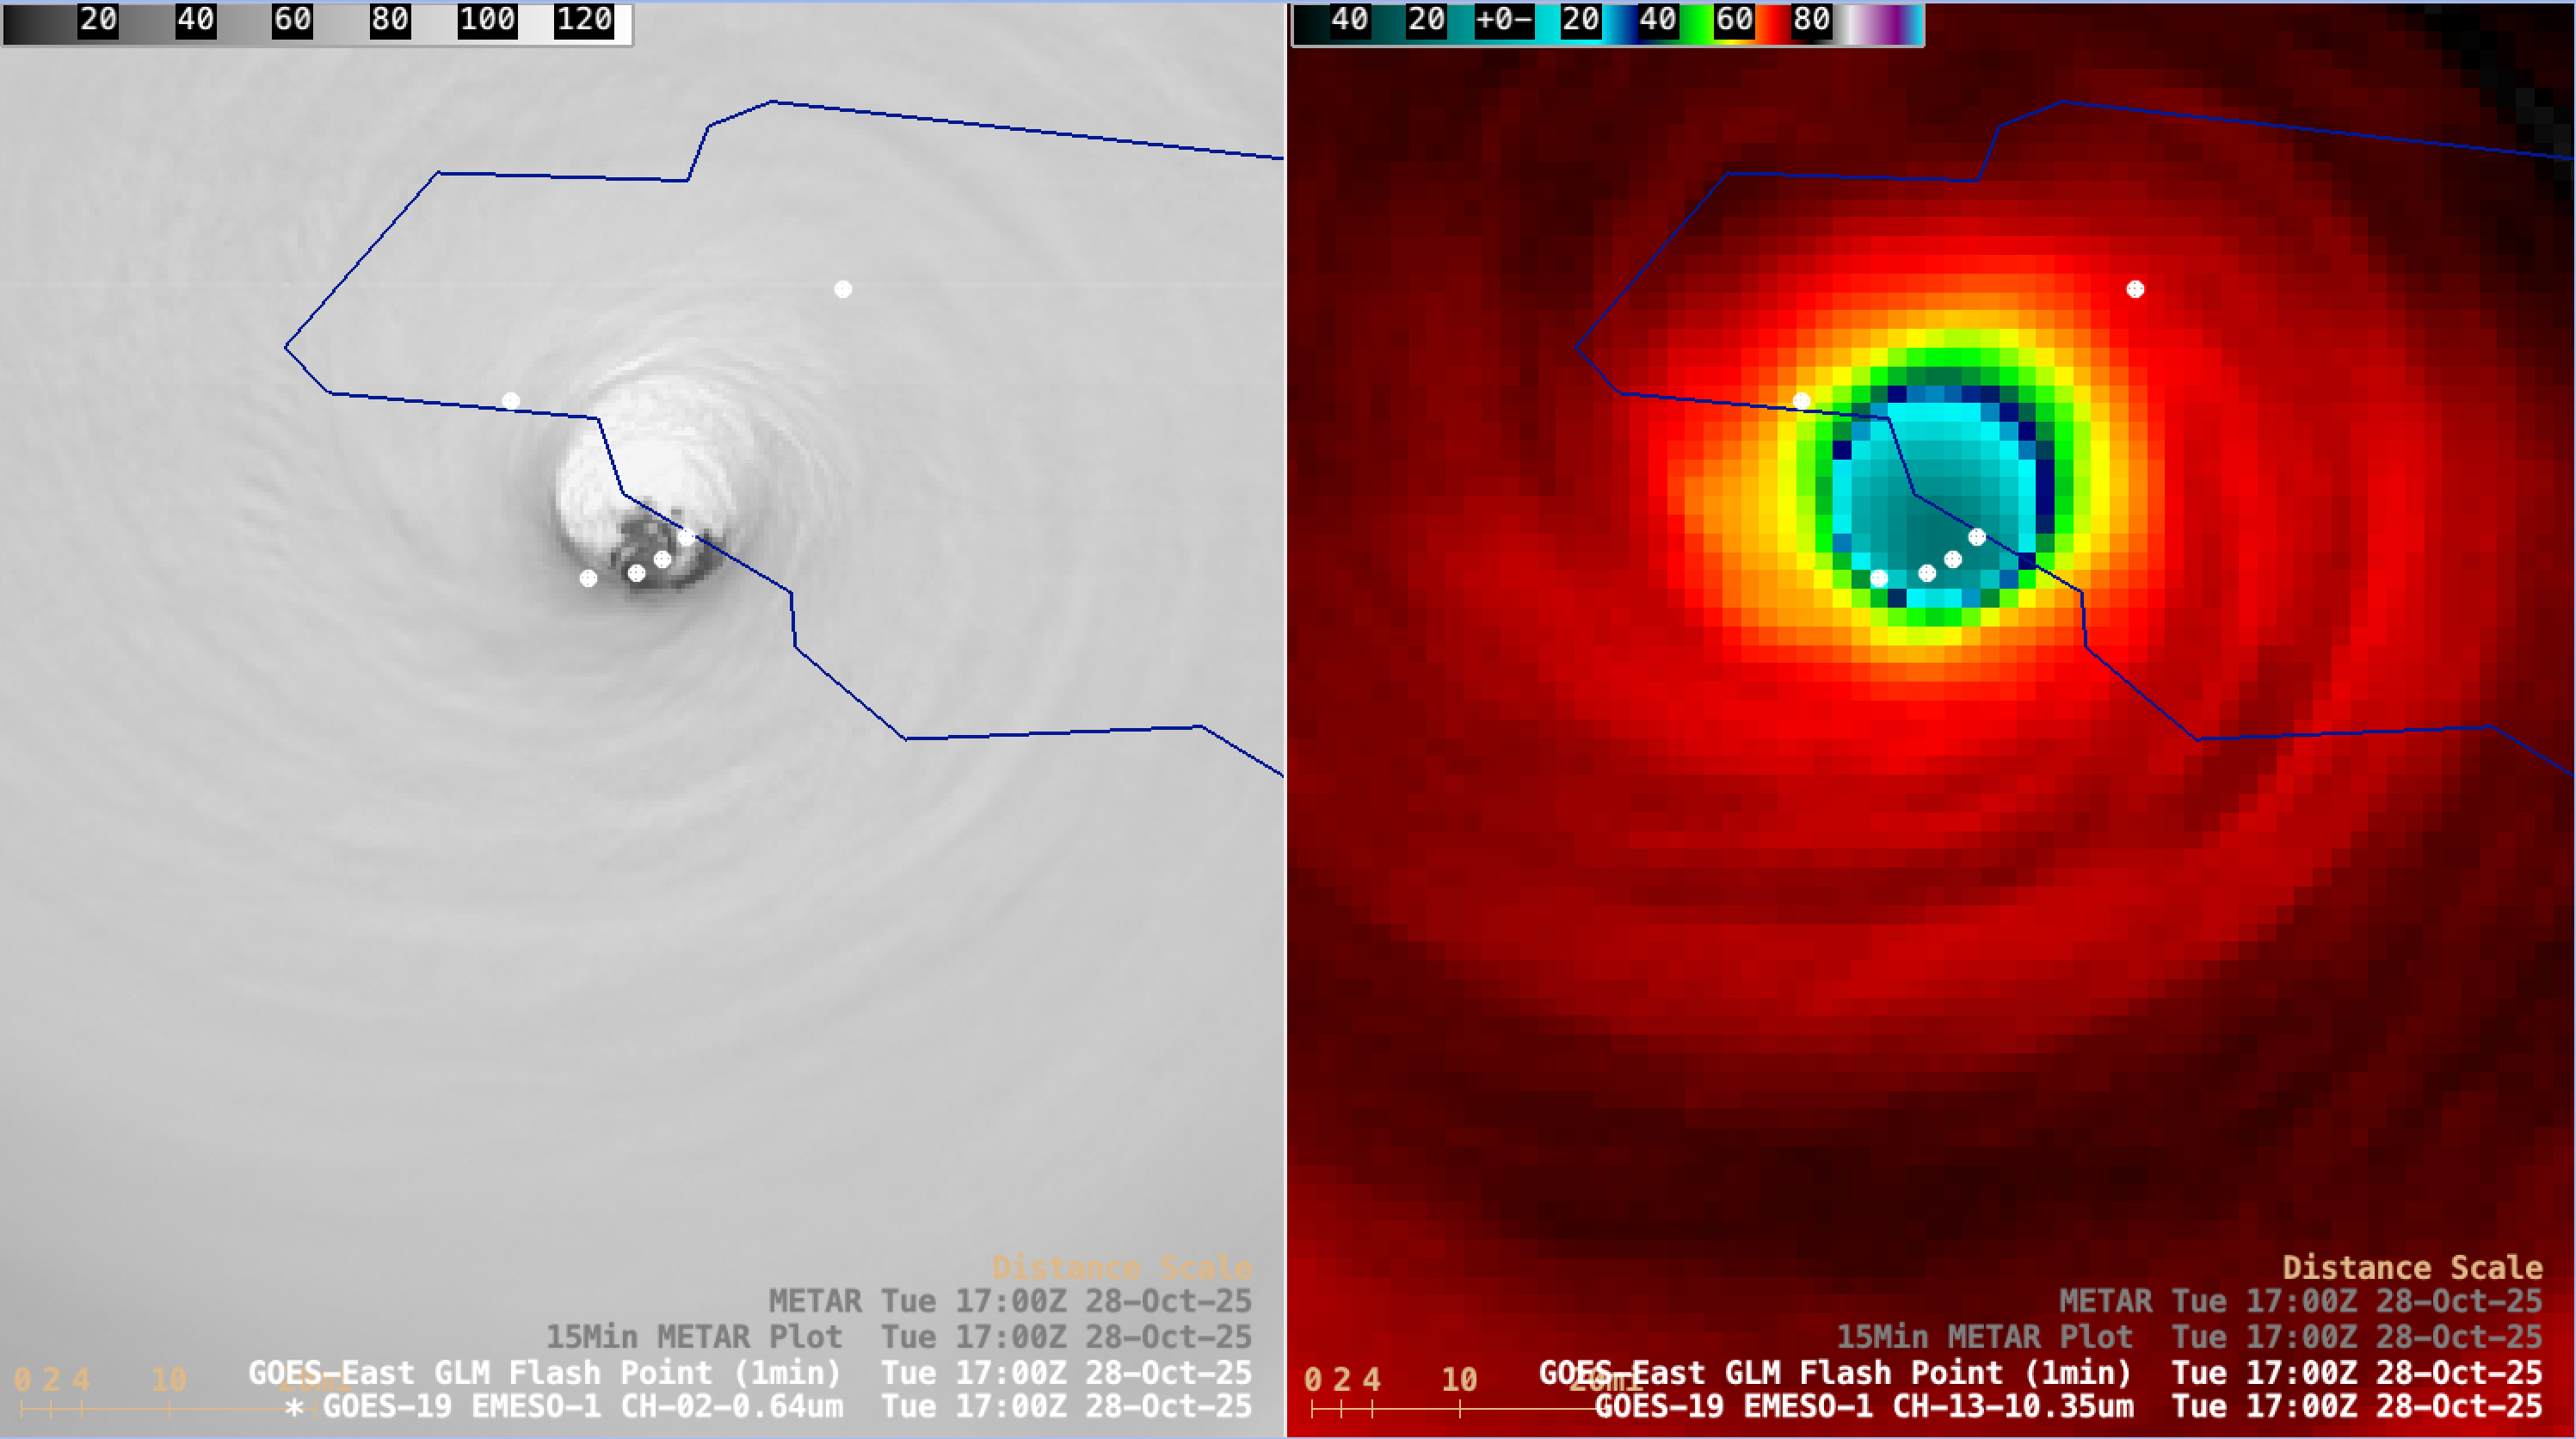
1-minute GOES-19 Visible images (left) and Infrared images (right) with plots of 1-minute GOES-19 GLM Flash Points, from 1131-1800 UTC on 28 October [click to play MP4 animation]
1-minute Mesoscale Domain Sector GOES-19 (GOES-East) Visible and Infrared images (above) showed Category 5 Hurricane Melissa as it made landfall along the far southwest coast of Jamaica around 1700 UTC on 28 October 2025. Low-altitude mesovortices were evident within the eye — and GLM Flash Points revealed abundant lightning activity within the inner eyewall region.
1-minute GOES-19 Infrared images displayed using RealEarth(below) indicated that the center of the eye of Melissa passed over White House, Jamaica during landfall — with the right-front quadrant of the inner eyewall (where wind damage and storm surge is often highest) passing over Black River.
1-minute GOES-19 Infrared images displayed with Google Maps labels of cities and roads, from 1500-2100 UTC on 28 October [click to play MP4 animation]
Shortly after Melissa made landfall, the eye quickly became cloud-filled as the hurricane moved inland and interacted with topography across the western part of Jamaica (below).
1-minute GOES-19 Visible images (left) and Topography+Visible images (right) with plots of GLM Flash Points, from 1451-1900 UTC on 28 October [click to play MP4 animation]
A larger-scale view of GOES-19 CIMSS True Color RGB images created using Geo2Grid(below) indicated that after landfall, the eye of Melissa remained cloud-filled as the hurricane finished crossing the island and eventually emerged over water north of Jamaica around 2100 UTC.
1-minute CIMSS True Color RGB images, from 1131-2159 UTC on 28 October (courtesy Dave Stettner, CIMSS) [click to play MP4 animation]
A larger-scale view of 1-minute GOES-19 Infrared images during the 5 hours leading up to landfall is shown below — which revealed a continual series of cloud-top gravity waves propagating radially outward from the eye of Melissa. The radius of hurricane-force winds appeared to be rather small, since surface wind speeds at the Kingston METAR site in eastern Jamaica were only in the 20-40 kt range during that time period.
1-minute GOES-19 Infrared images with plots of 1-minute GOES-19 GLM Flash Points, from 1401-1900 UTC on 28 October [click to play MP4 animation]
A GMI Microwave image (below) displayed the compact eye and eyewall of Melissa about 3 hours prior to landfall.
GMI Microwave image at 1406 UTC on 28 October
Just prior to landfall, Melissa was moving through an environment characterized by fairly low values of deep-layer wind shear(below).
GOES-19 Infrared images, with an overlay of contours and streamlines of deep-layer wind shear at 1600 UTC on 28 October
A Synthetic Aperture Radar (SAR) image (source) at 1110 UTC (below) retrieved a maximum wind velocity value of 143 kts in the NW quadrant of Melissa.
RADARSAT-2 Synthetic Aperture Radar (SAR) image at 1110 UTC on 28 October [click to enlarge]
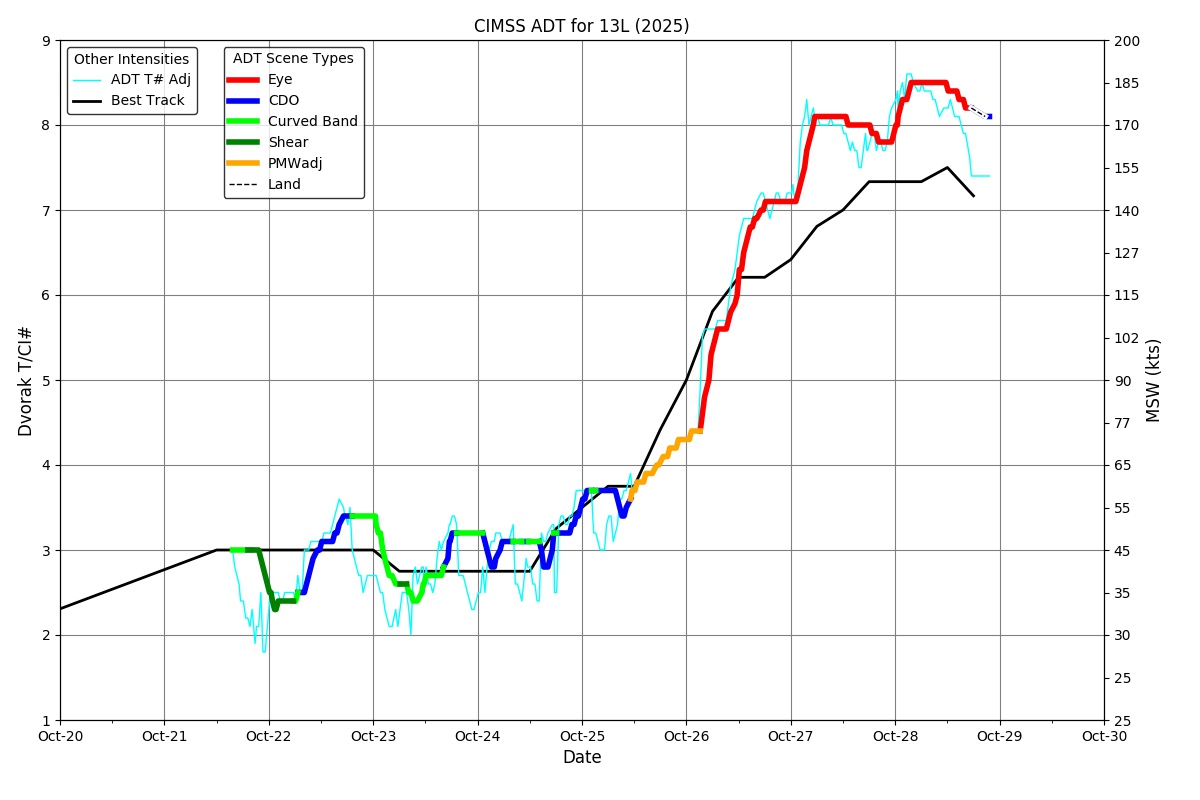
It is noteworthy that the Advanced Dvorak Technique (ADT) satellite-derived intensity estimate peaked at 185 kts for Melissa (below) — which according to the developer at CIMSS is the highest value on record for any tropical cyclone since the ADT was implemented.
Plot of Advanced Dvorak Technique (ADT) values for Melissa [click to enlarge]
219-kt peak wind would be the highest wind value a dropsonde has ever recorded, ahead of 215-kt value in Super Typhoon Megi in 2010 & the 210 kt recorded just yesterday in #Hurricane #Melissa.Still needs to be validated… so this data is preliminary.
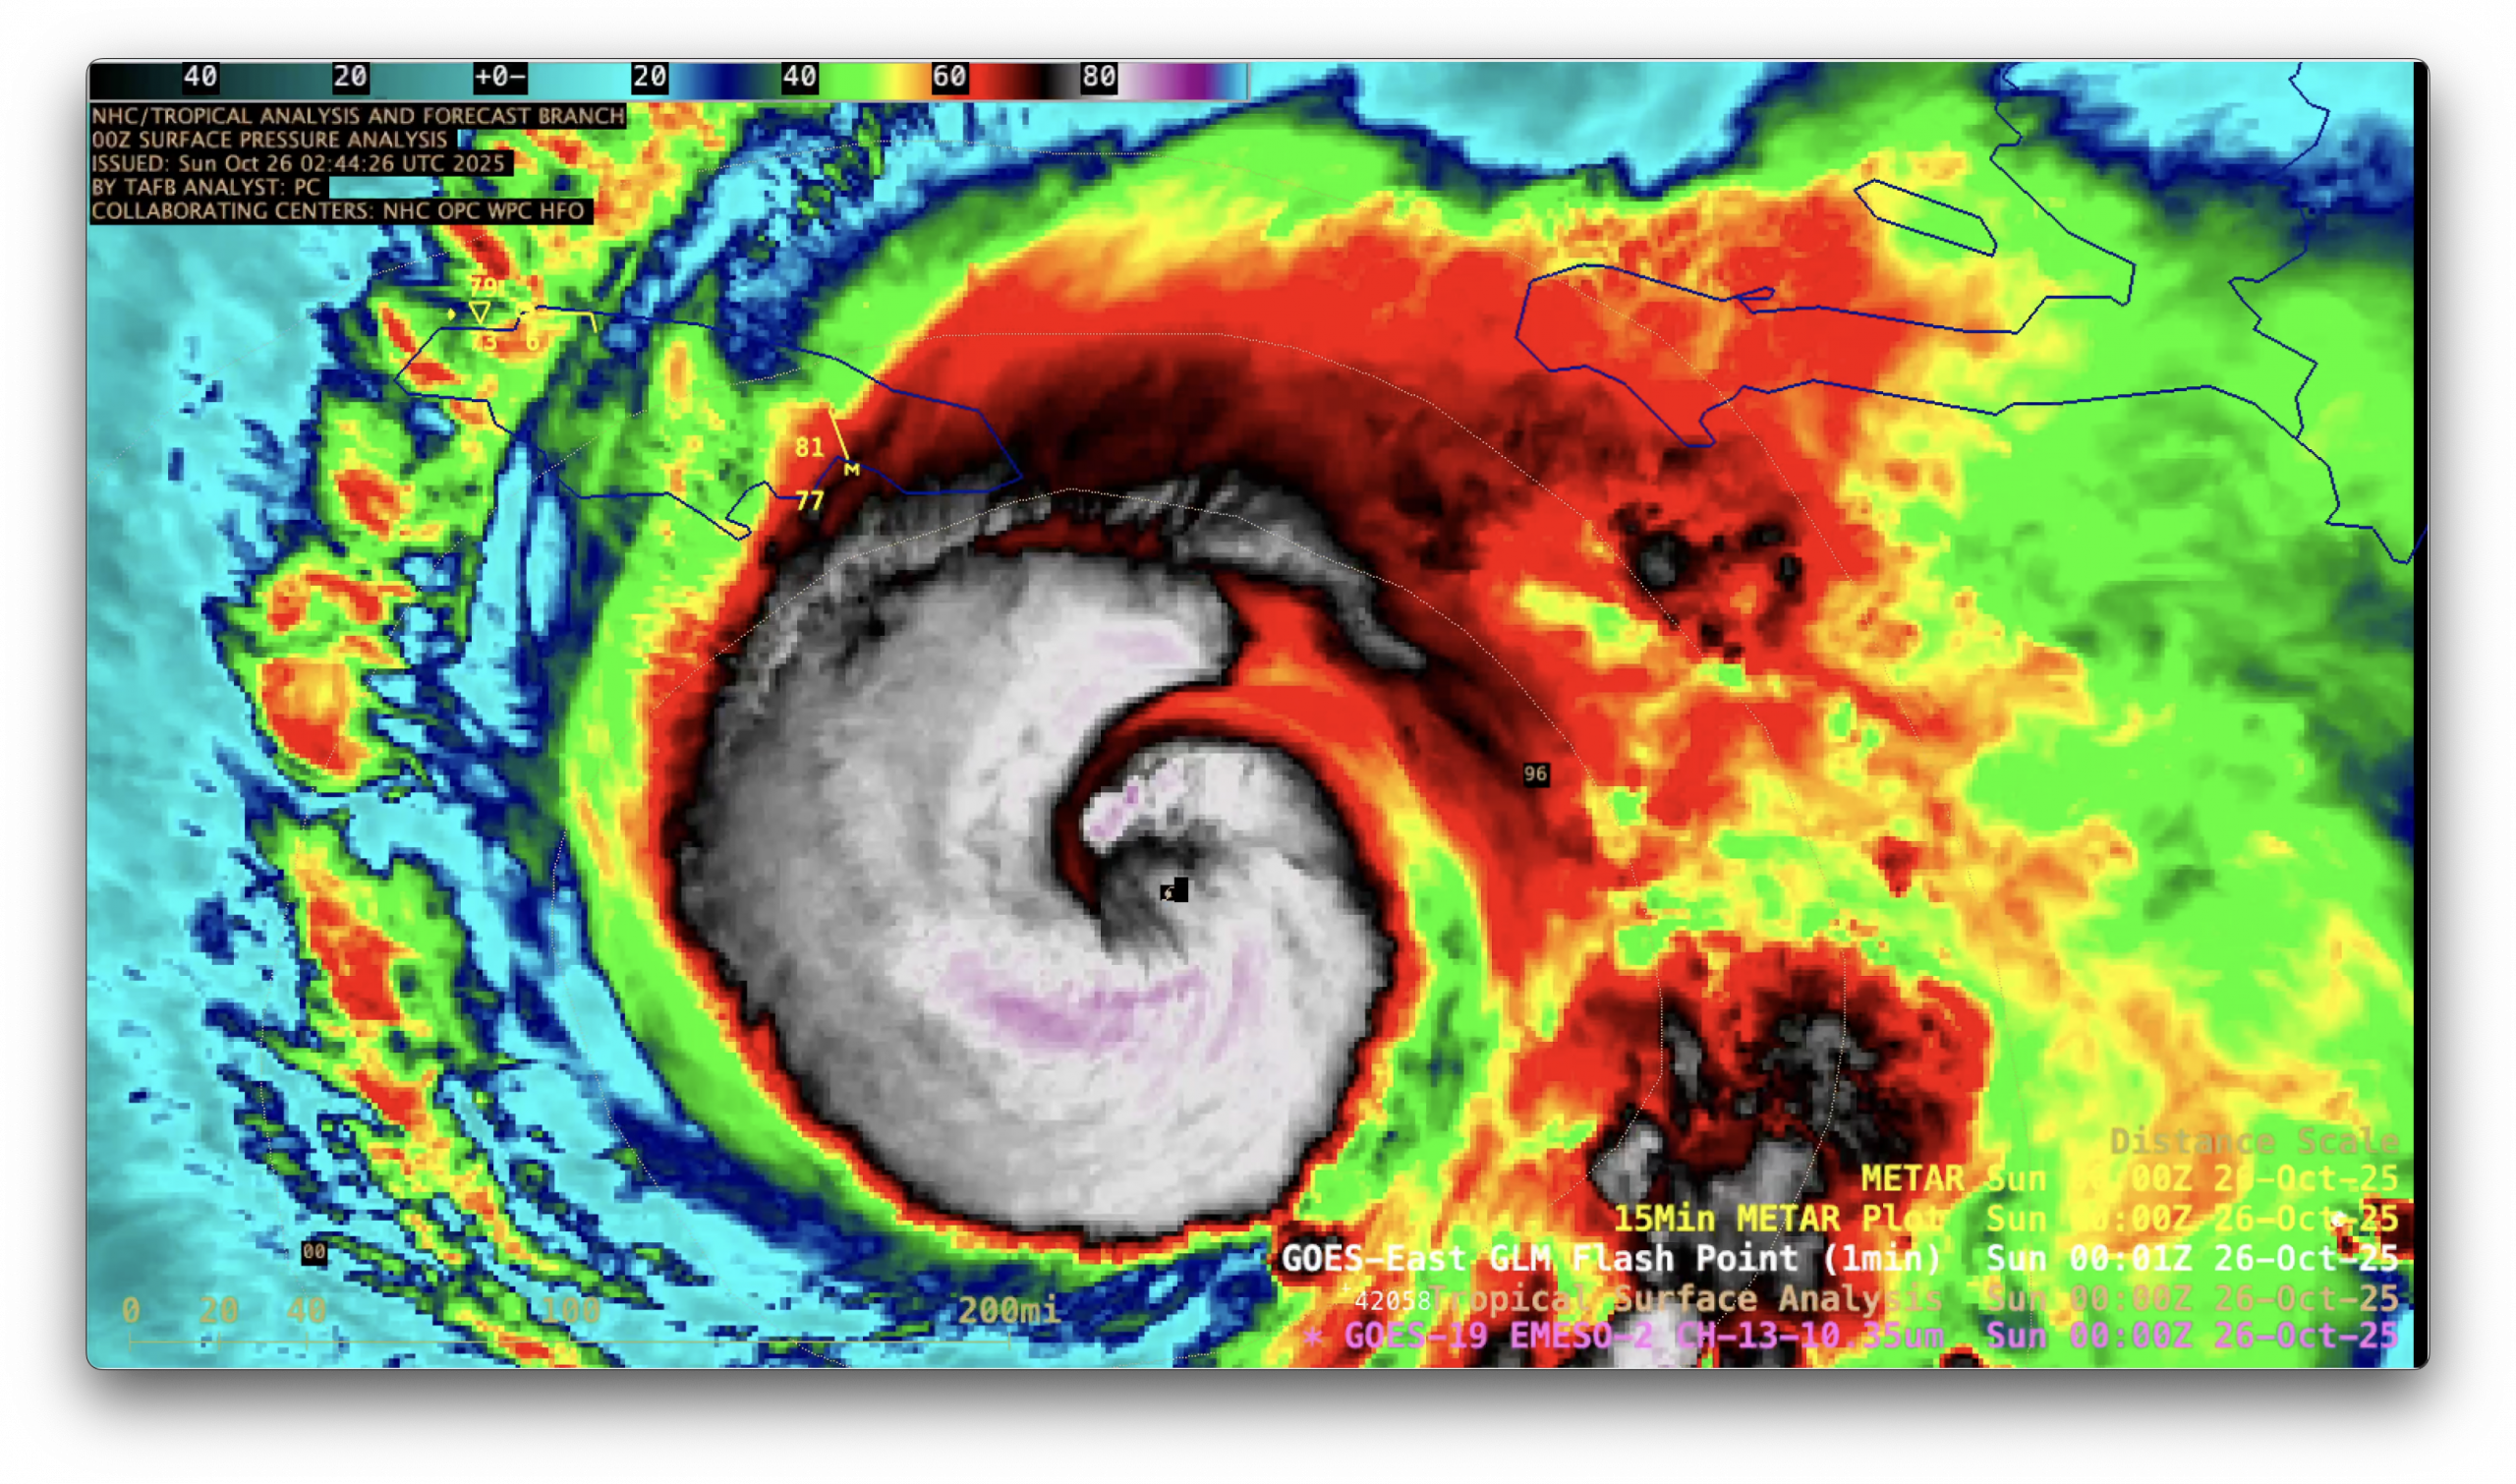
1-minute Mesoscale Domain Sector GOES-19 (GOES-East) Infrared images (above) showed Tropical Storm Melissa in the Caribbean Sea as it began to rapidly intensify during the afternoon and evening hours on 25 October 2025 — reaching Category 1 intensity at 1800 UTC on 25 October and Category 3 intensity at 0300 UTC... Read More
1-minute GOES-19 Infrared images with plots of GLM Flash Points, from 1201 UTC on 25 October to 0300 UTC on 26 October [click to play MP4 animation]
1-minute Mesoscale Domain Sector GOES-19 (GOES-East) Infrared images (above) showed Tropical Storm Melissa in the Caribbean Sea as it began to rapidly intensify during the afternoon and evening hours on 25 October 2025 — reaching Category 1 intensity at 1800 UTC on 25 October and Category 3 intensity at 0300 UTC on 26 October. A series of convective bursts (exhibiting cloud-top infrared brightness temperatures as cold as -90 to -96C, denoted by darker shades of purple) rotated around the storm center — and GLM Flash Points highlighted intermittent lightning activity within some of those convective bursts. Some semblance of a ragged eye occasionally appeared as Melissa neared and attained Category 3 intensity, but an eye was never well organized in the infrared imagery.
Melissa then reached Category 4 intensity south of Jamaica at 1200 UTC on 26 October — and by that time the eye was well defined in both Infrared and Visible imagery (below). Low-altitude mesovortices were apparent within the eye in the Visible images.
1-minute GOES-19 Infrared images with plots of GLM Flash Points, from 1200 -2100 UTC on 26 October [click to play MP4 animation]
1-minute GOES-19 Visible images with plots of GLM Flash Points, from 1200-2100 UTC on 26 October [click to play MP4 animation]
The eye of Category 4 Melissa was exhibiting a “stadium effect”, with a small surface eye having walls that sloped outward with height (below).
GOES-19 Visible and Infrared images at 2057 UTC on 26 October, with plots of GLM Flash Points [click to enlarge]
Melissa was moving through an environment of relatively light deep-layer wind shear, and was traversing warm water — two factors that favored intensification (below).
GOES-19 Infrared images, with an overlay of contours and streamlines of deep-layer wind shear at 1500 UTC on 26 October
Sea Surface Temperature and Ocean Heat Content, with the track of Melissa ending at 1200 UTC on 26 October
===== 27 October Update =====
1-minute GOES-19 Visible and Infrared images with plots of 1-minute GOES-19 GLM Flash Points, from 1131-2200 UTC on 27 October [click to play MP4 animation]
Post-sunrise 1-minute GOES-19 Visible and Infrared images on 27 October (above) again showed a nice “stadium effect” with the eye of Melissa, which reached Category 5 intensity south of Jamaica at 0900 UTC. Visible images continued to display low-altitude mesovortices within the 10-mile diameter eye — and GLM Flash Points highlighted abundant lightning activity within the inner eyewall.
The maximum sustained wind speed of Melissa was increased to 150 kts at 2100 UTC (SATCON | ADT).


