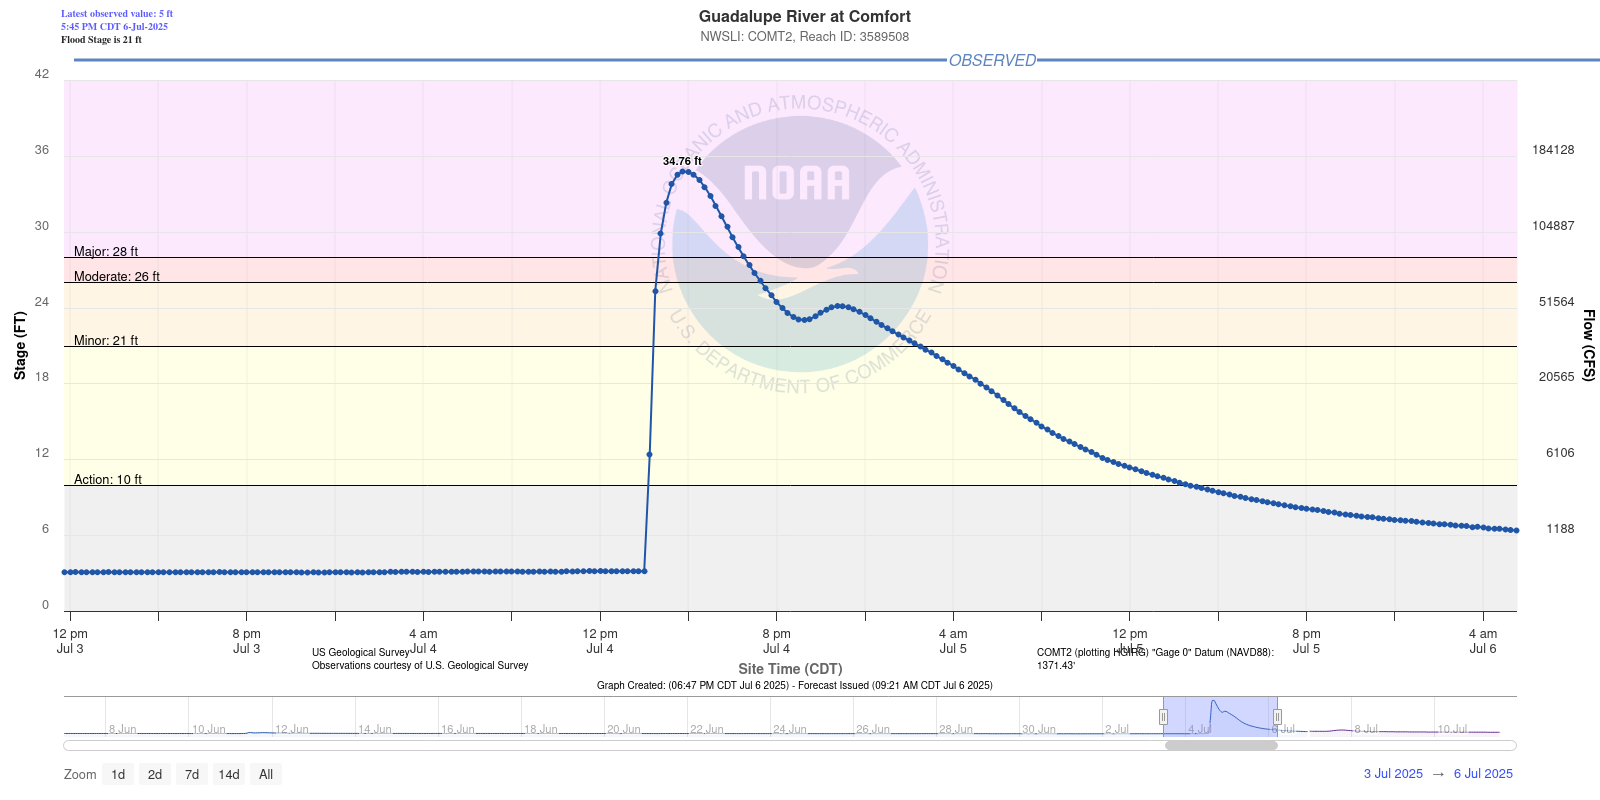
Catastrophic flash flooding event in the Hill Country of Texas responsible for at least 130 fatalities
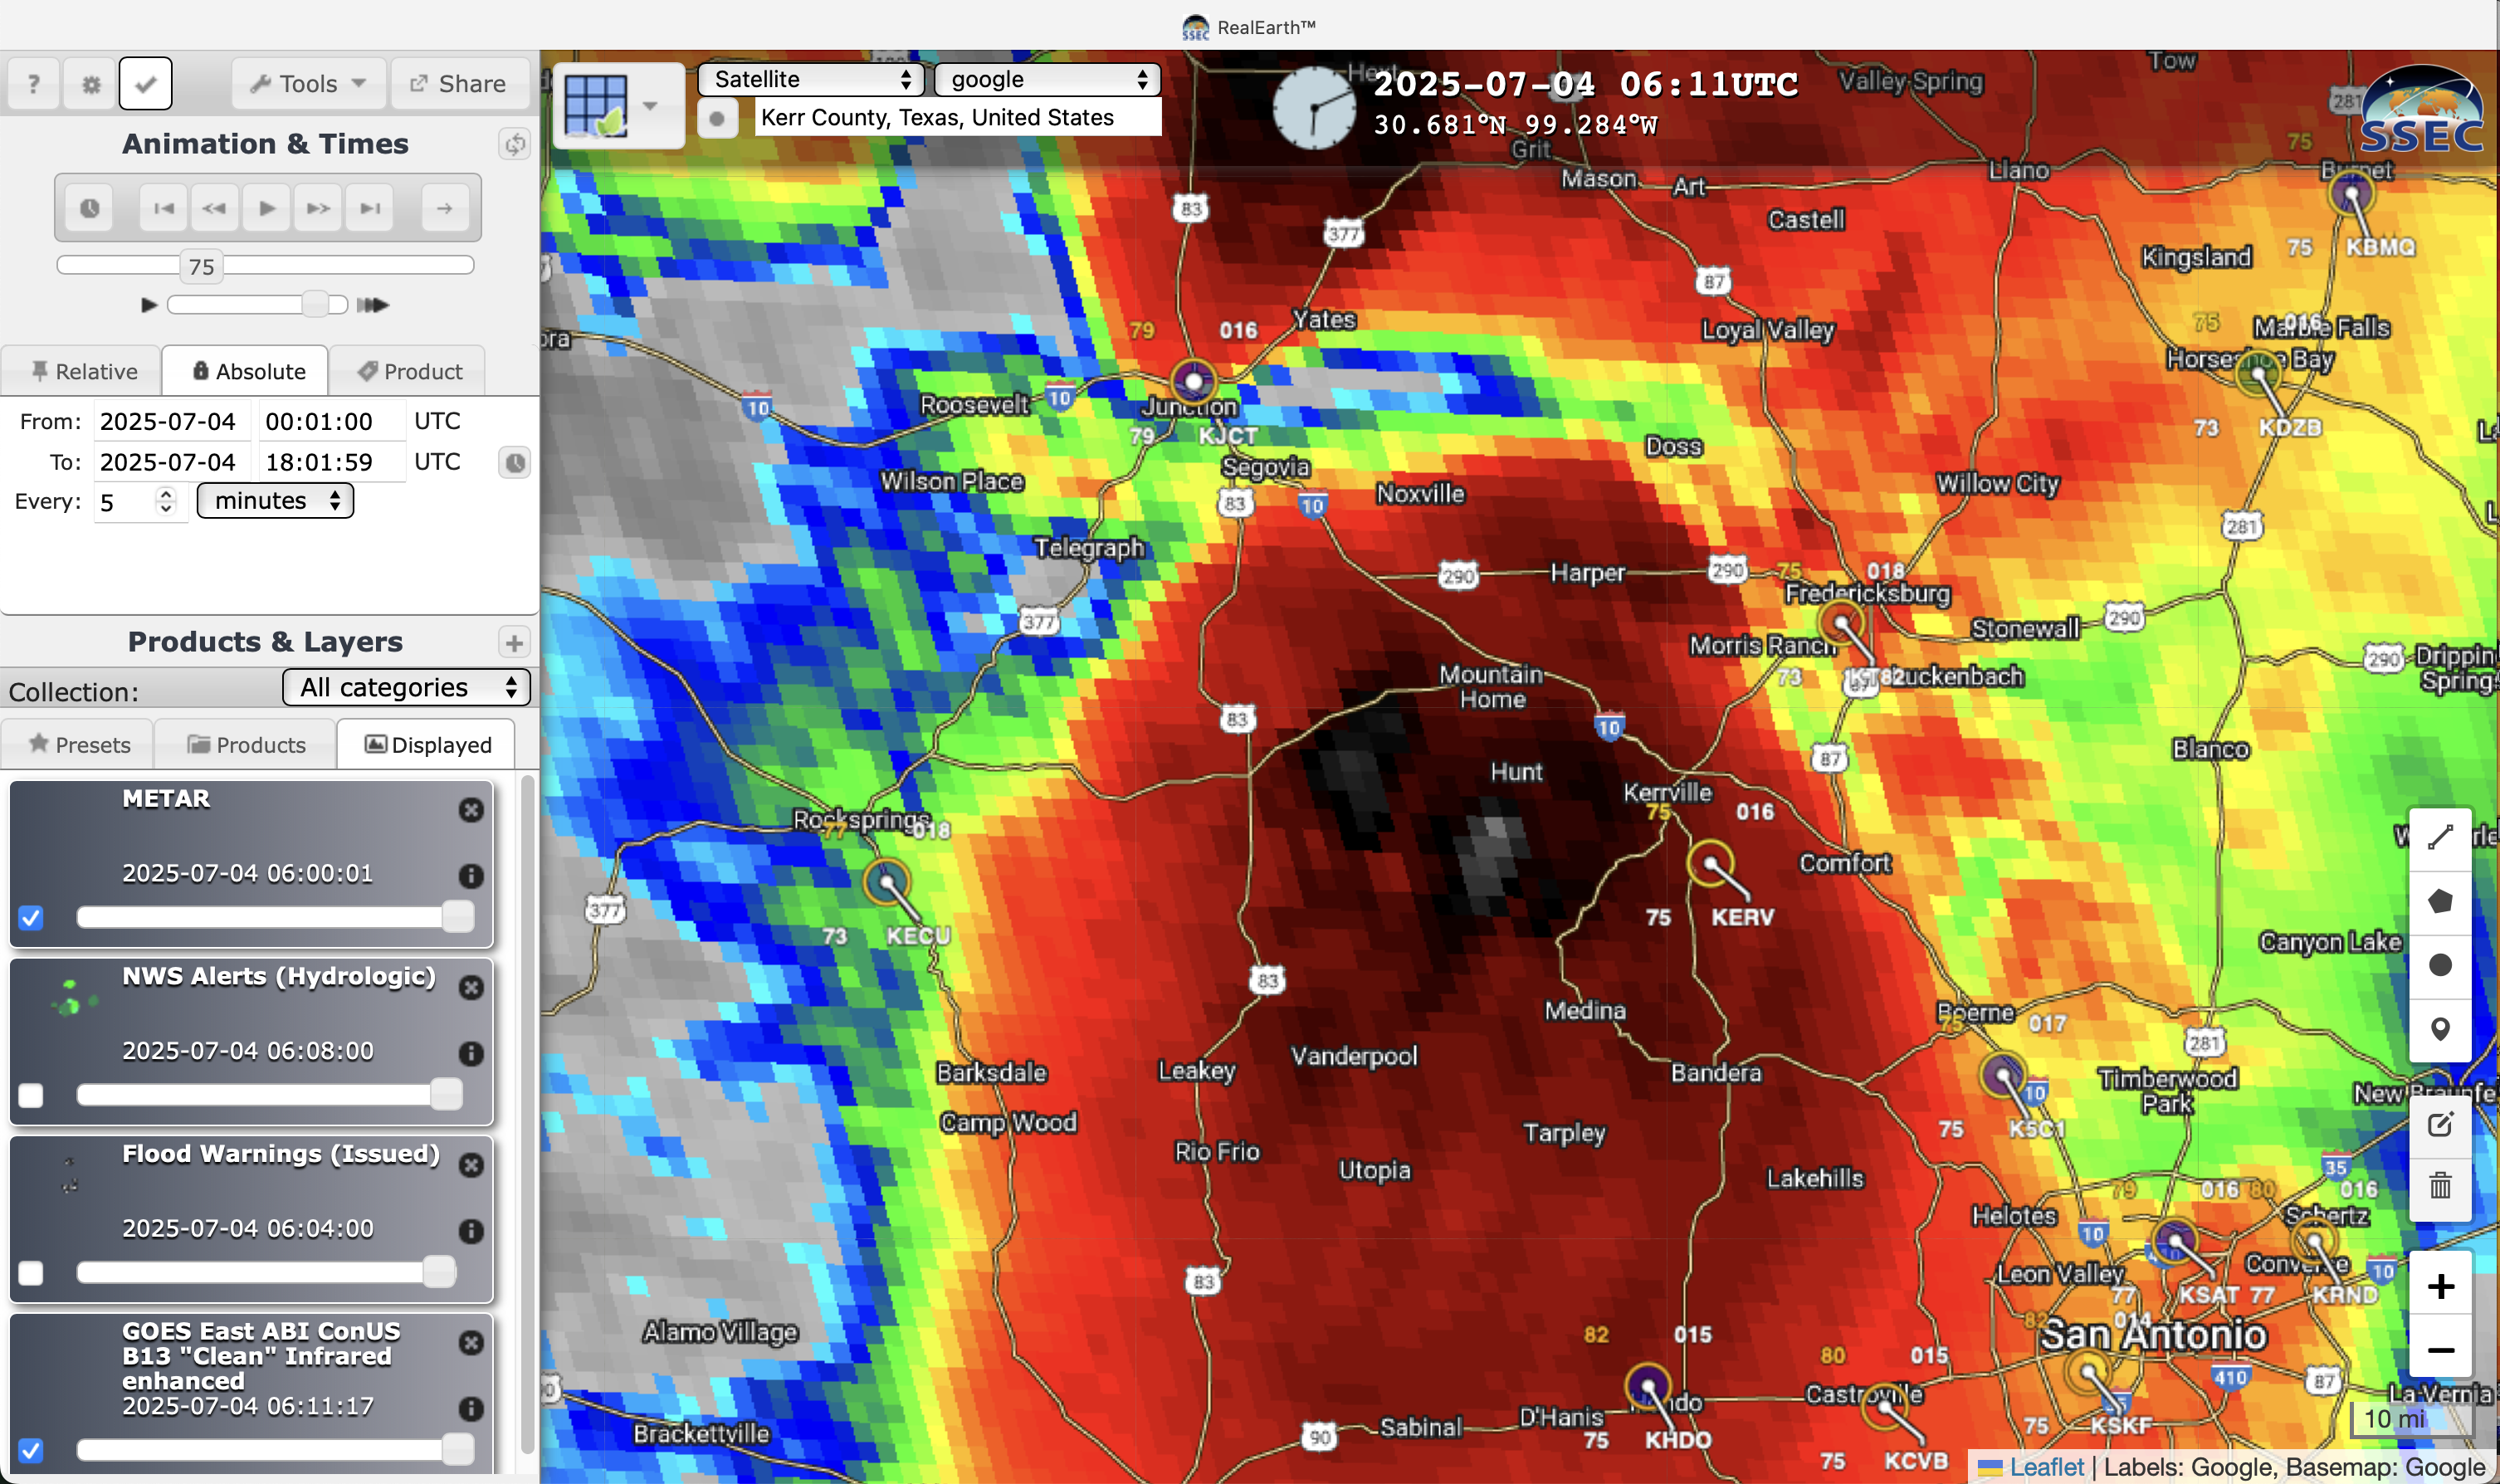
5-minute GOES-19 Infrared (10.3 µm) images centered on Kerr County, Texas from 0001-1801 UTC on 04 July — along with plots of 15-minute METAR surface reports [click to play MP4 animation]
The same sequence of 5-minute GOES-19 Infrared images is shown below — but on a map of County outlines, and including plots of the numerous Flood Advisories, Flood Warnings and Flash Flood Warnings that were issued during that 18-hour period.
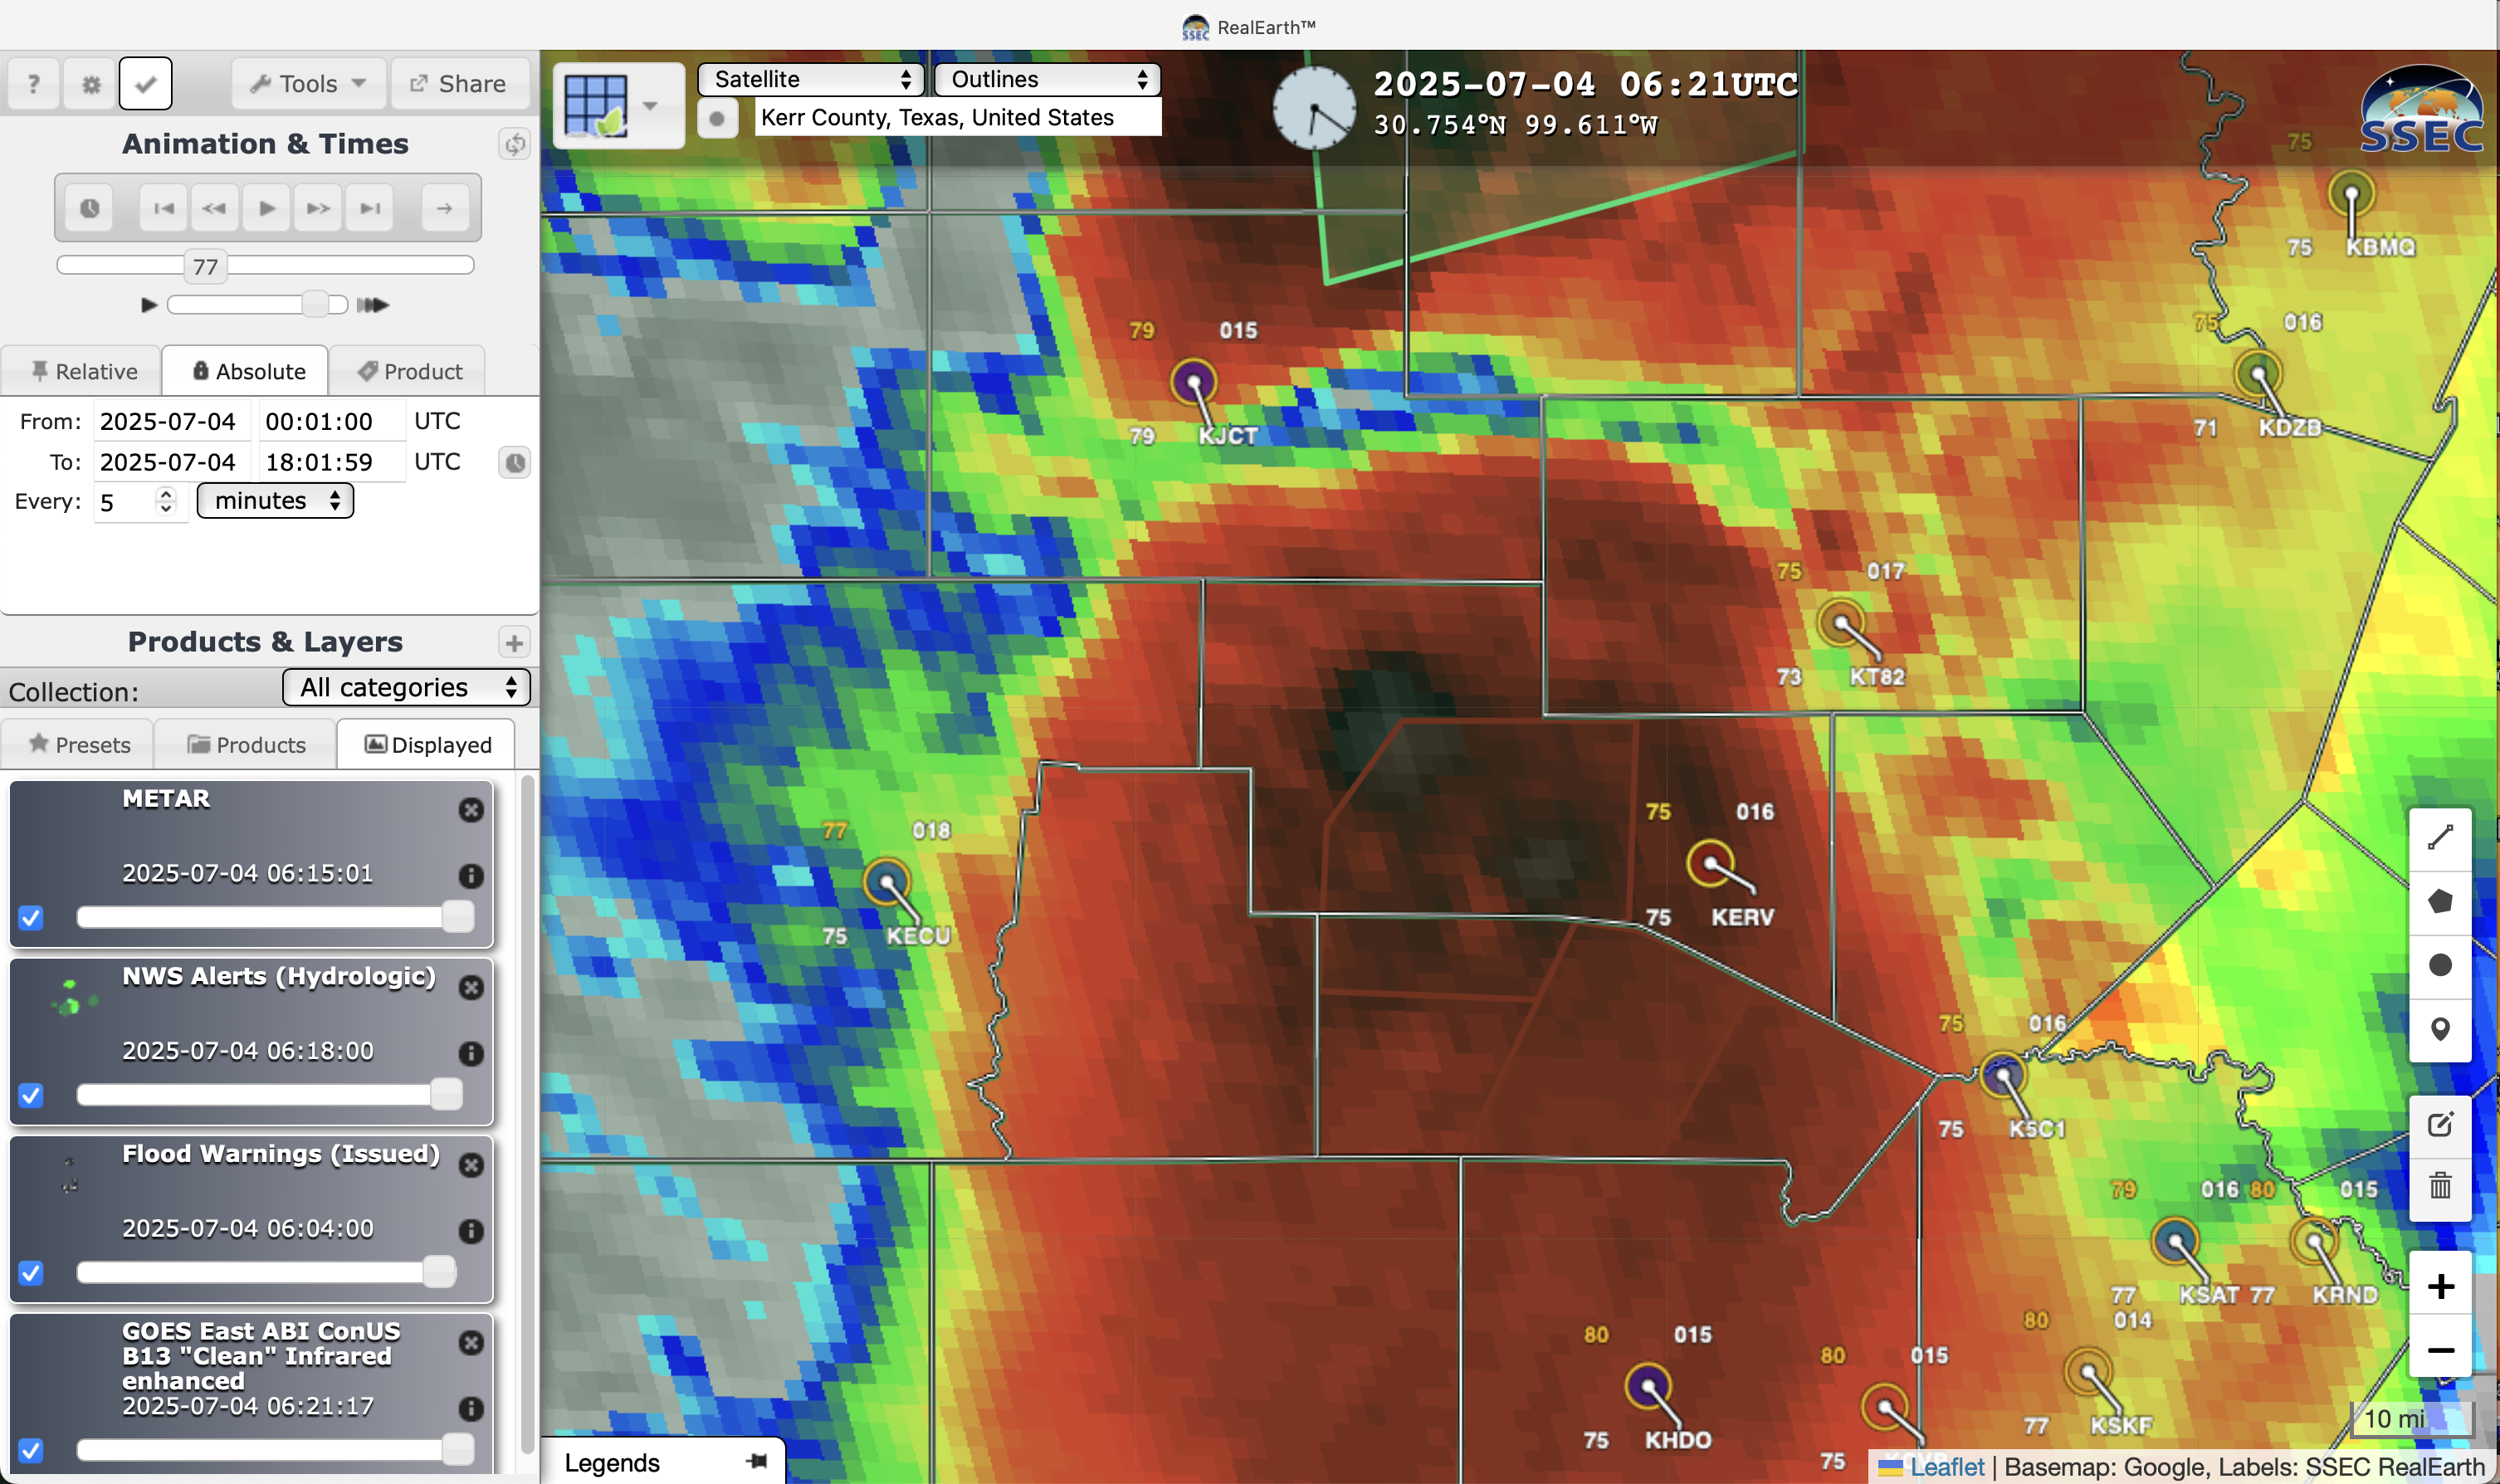
5-minute GOES-19 Infrared (10.3 µm) images centered on Kerr County, Texas from 0001-1801 UTC on 04 July, with plots of Flood Advisories (green polygons), Flood Warnings (brighter/solid green polygons) and Flash Flood Warnings (red polygons) against County outlines — along with plots of 15-minute METAR surface reports [click to play MP4 animation]
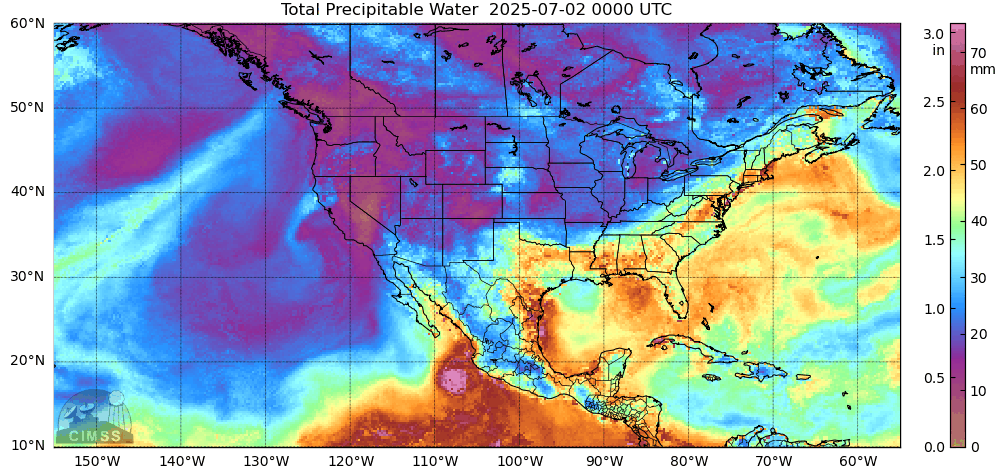
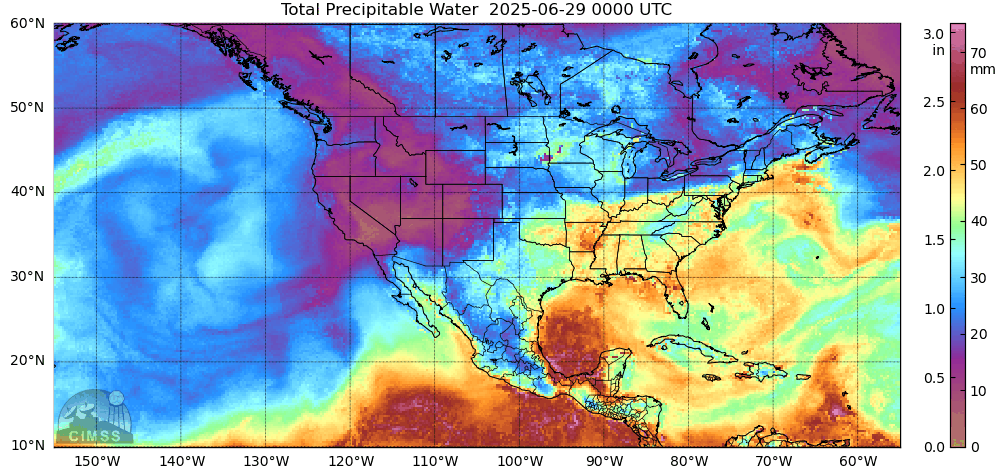
Hourly MIMIC Total Precipitable Water product, from 0000 UTC on 02 July to 1900 UTC on 04 July
The Precipitable Water (PW) value derived from rawinsonde data at Del Rio, Texas at 0000 UTC on 04 July was 2.34″ — just 0.09″ below the climatological maximum of 2.43″ for all Del Rio soundings on 04 July at 0000 UTC (below).
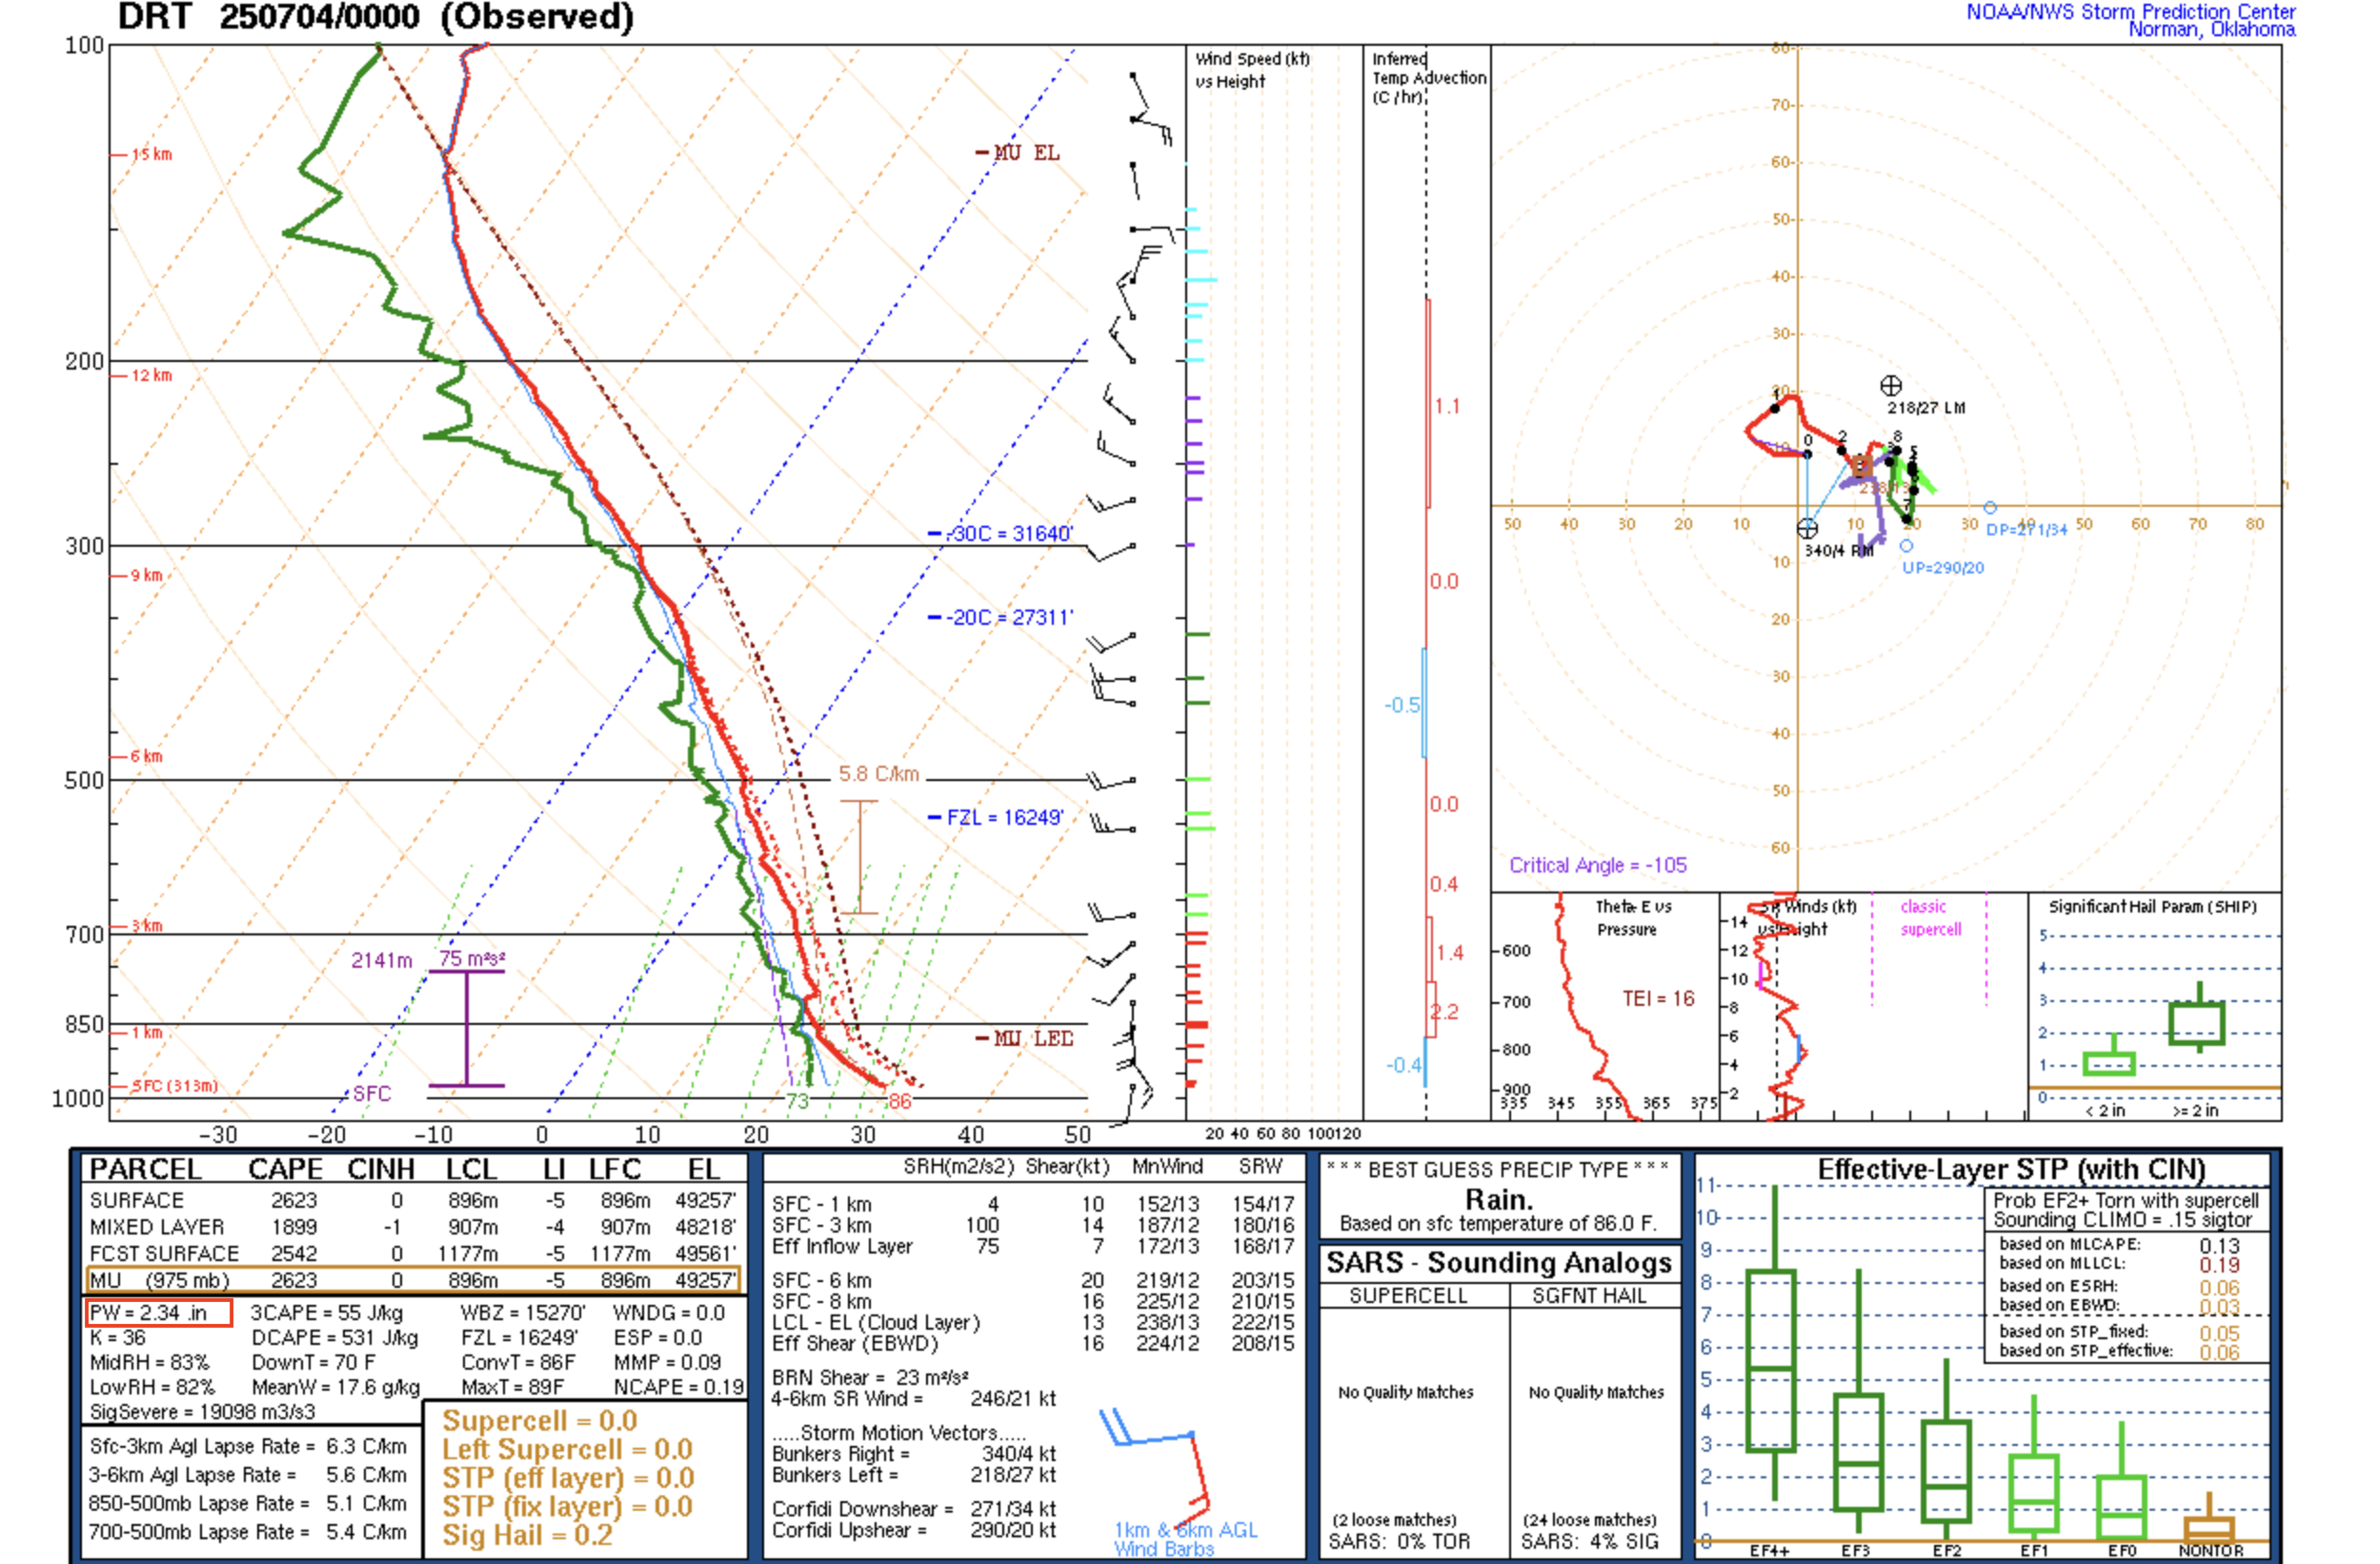
Plot of rawinsonde data from Del Rio, Texas at 0000 UTC on 04 July [click to enlarge]
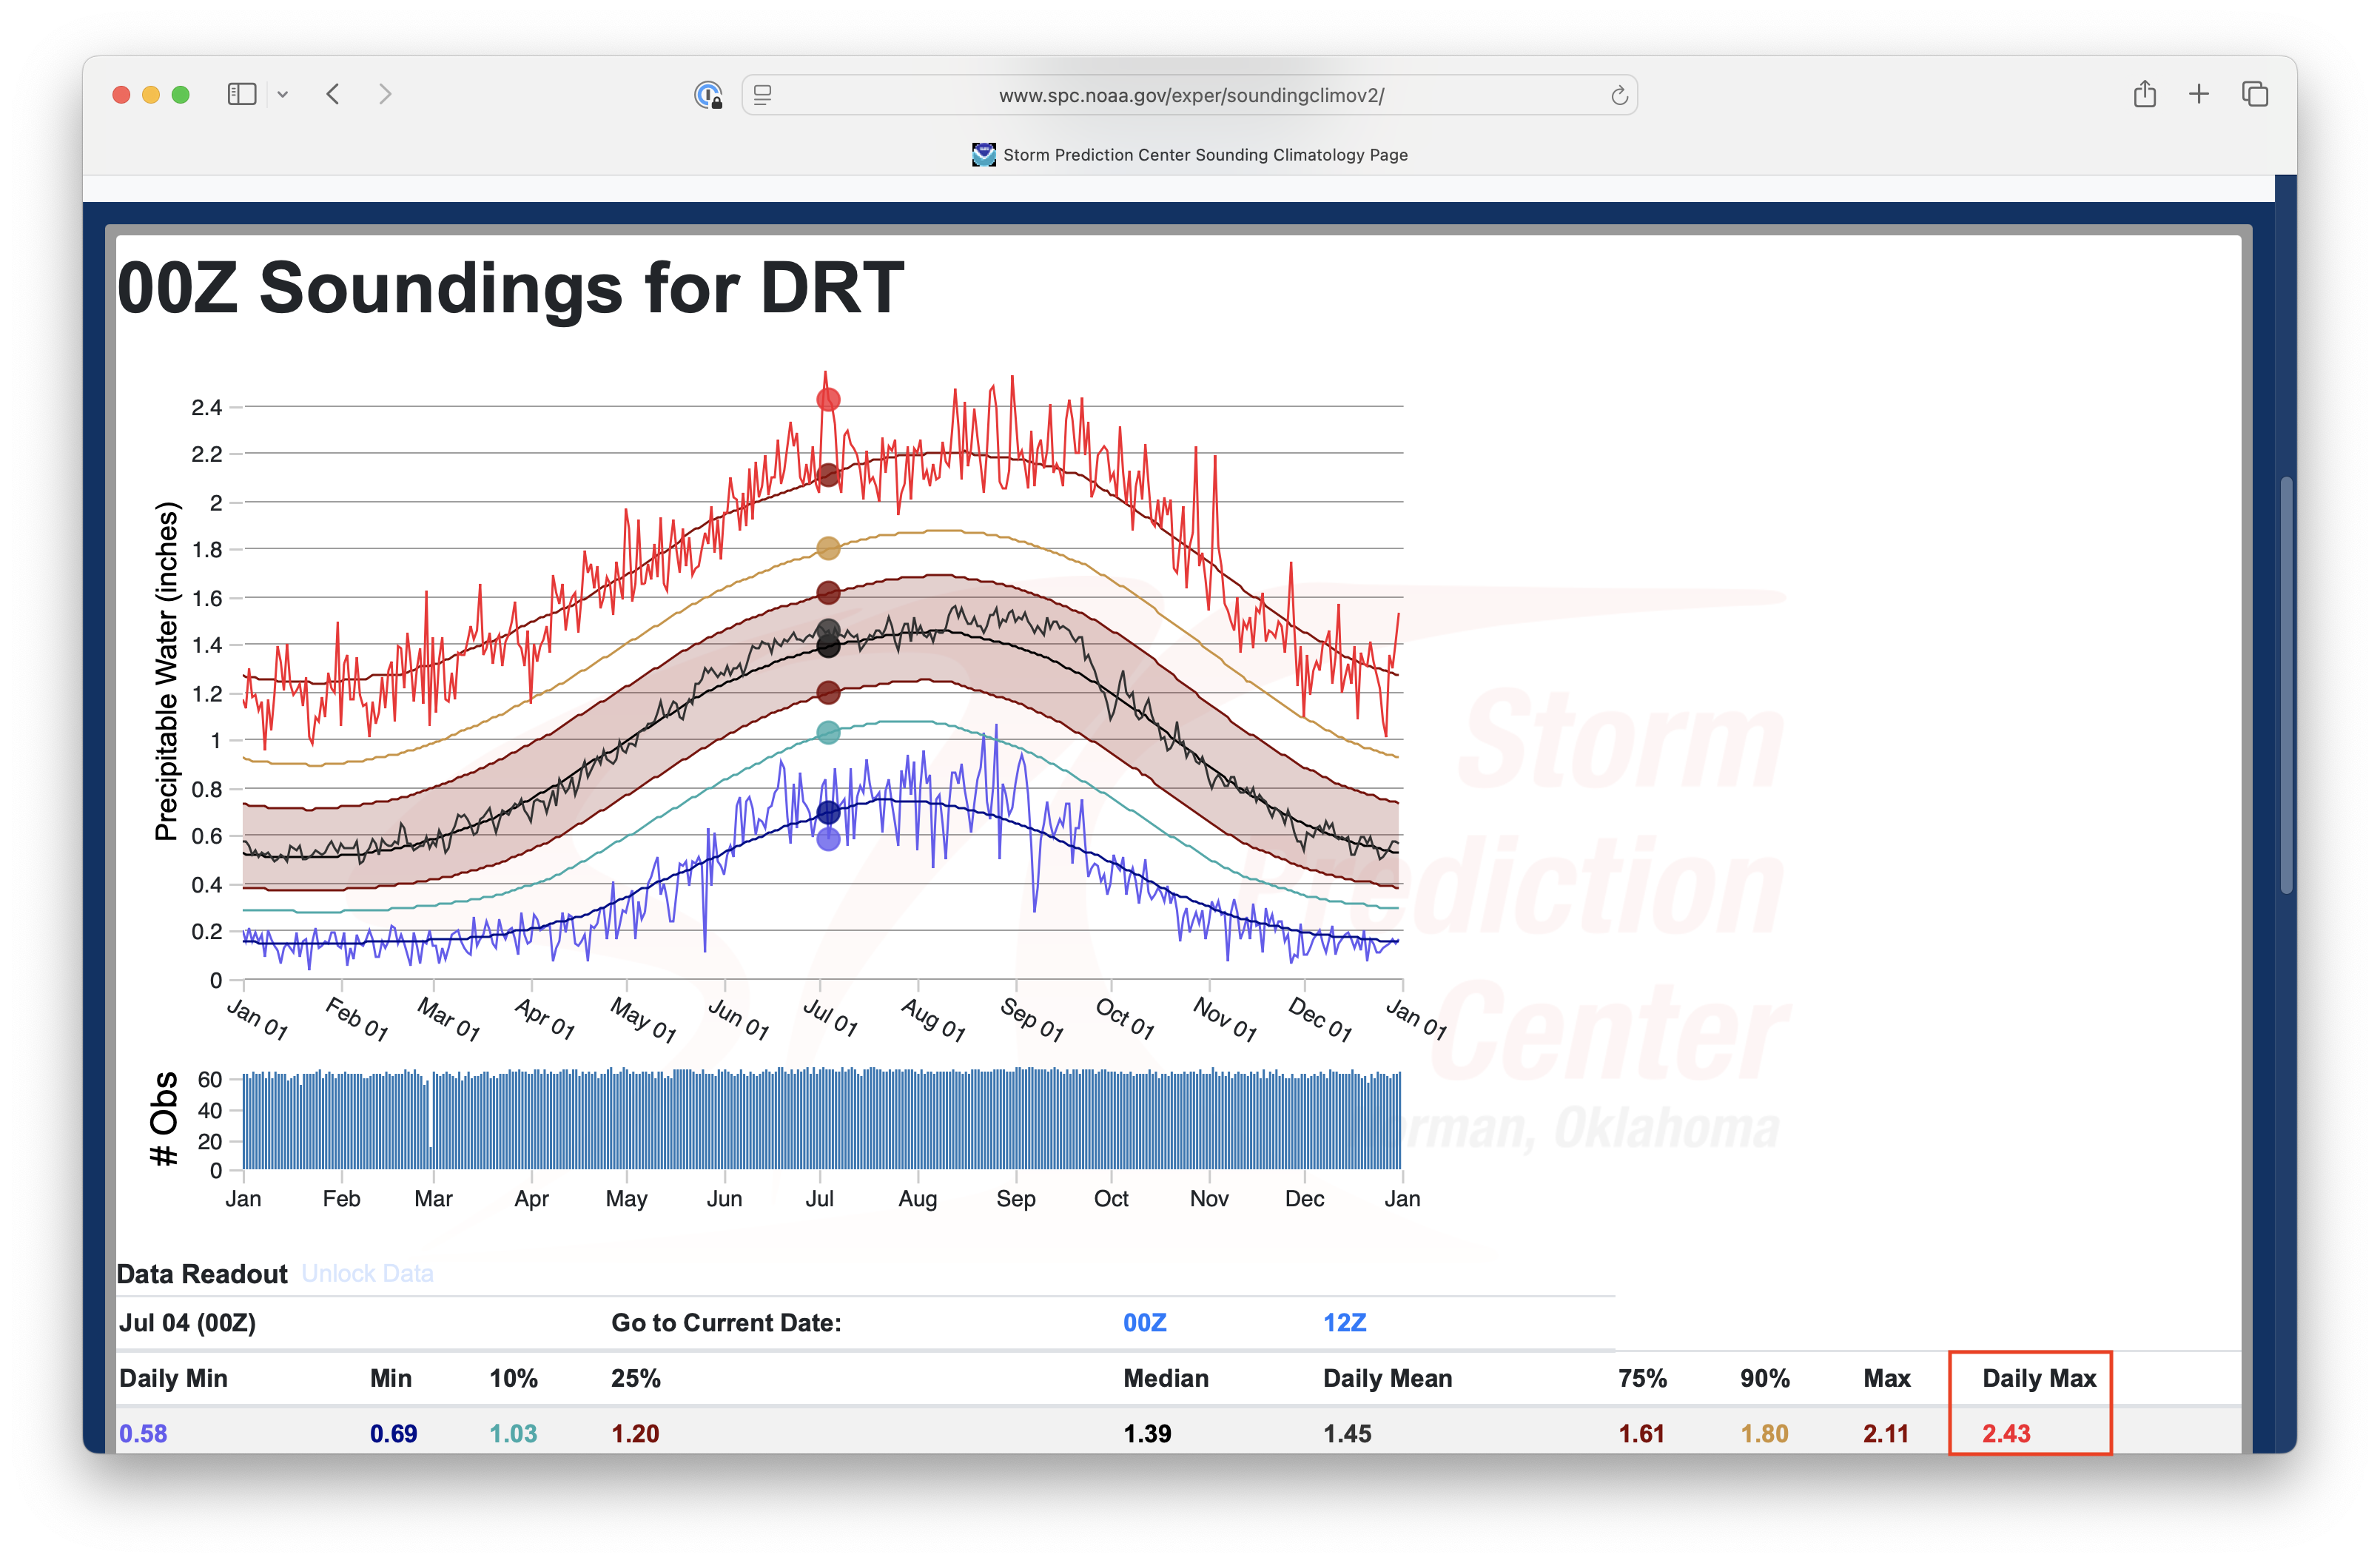
Climatology of Precipitable Water values for all Del Rio, Texas soundings at 0000 UTC on 04 July [click to enlarge]