Most people in south-central Wisconsin have noticed how uncomfortable the weather has been over the past week. The unseasonably cool air from a week ago has been replaced with a hot, sticky airmass that feels more at home in late July than in early June. And while precipitation has been... Read More
Most people in south-central Wisconsin have noticed how uncomfortable the weather has been over the past week. The unseasonably cool air from a week ago has been replaced with a hot, sticky airmass that feels more at home in late July than in early June. And while precipitation has been sorely lacking in parts of the area, at least the atmosphere is now more supportive of rain and numerous short-lived storms have been popping up (and quickly dying out) since the weekend.
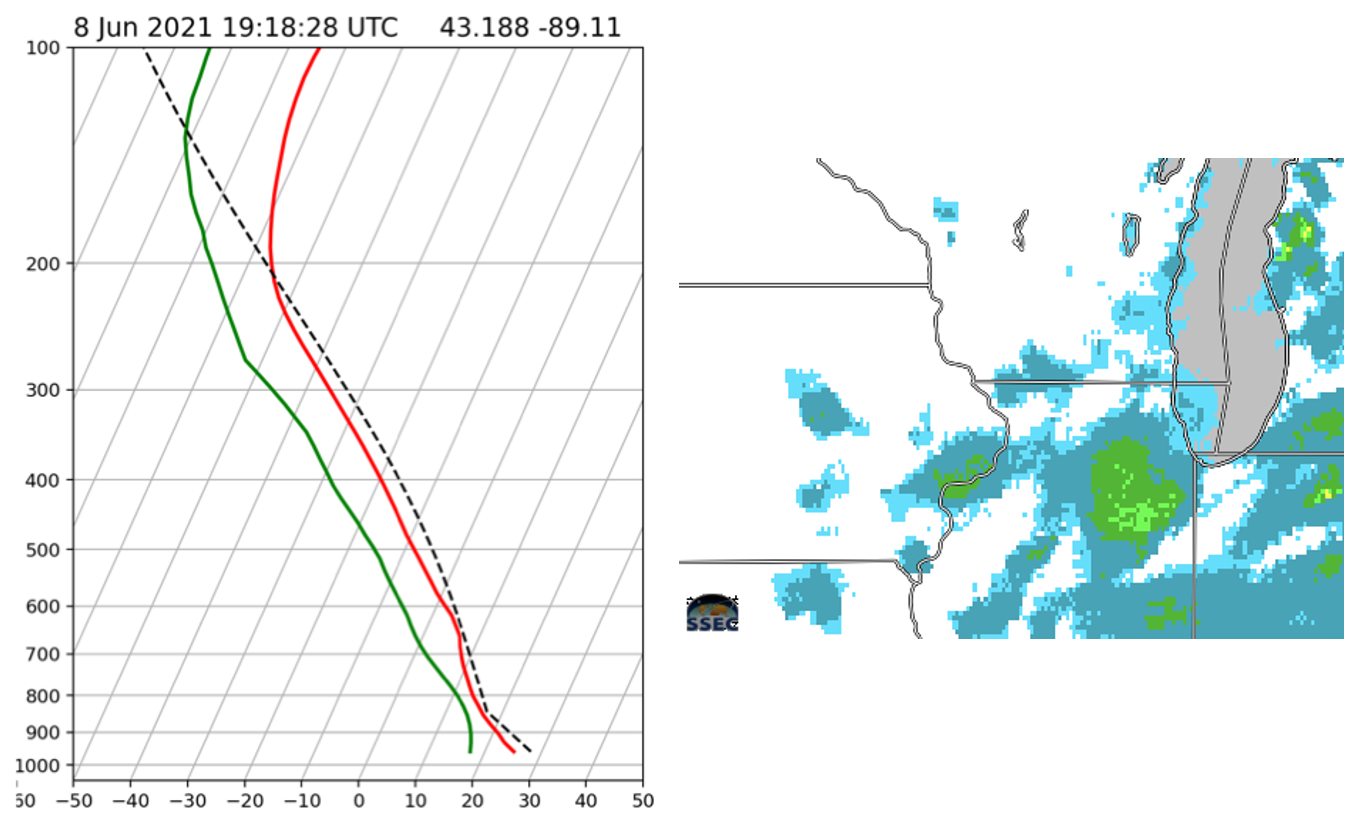
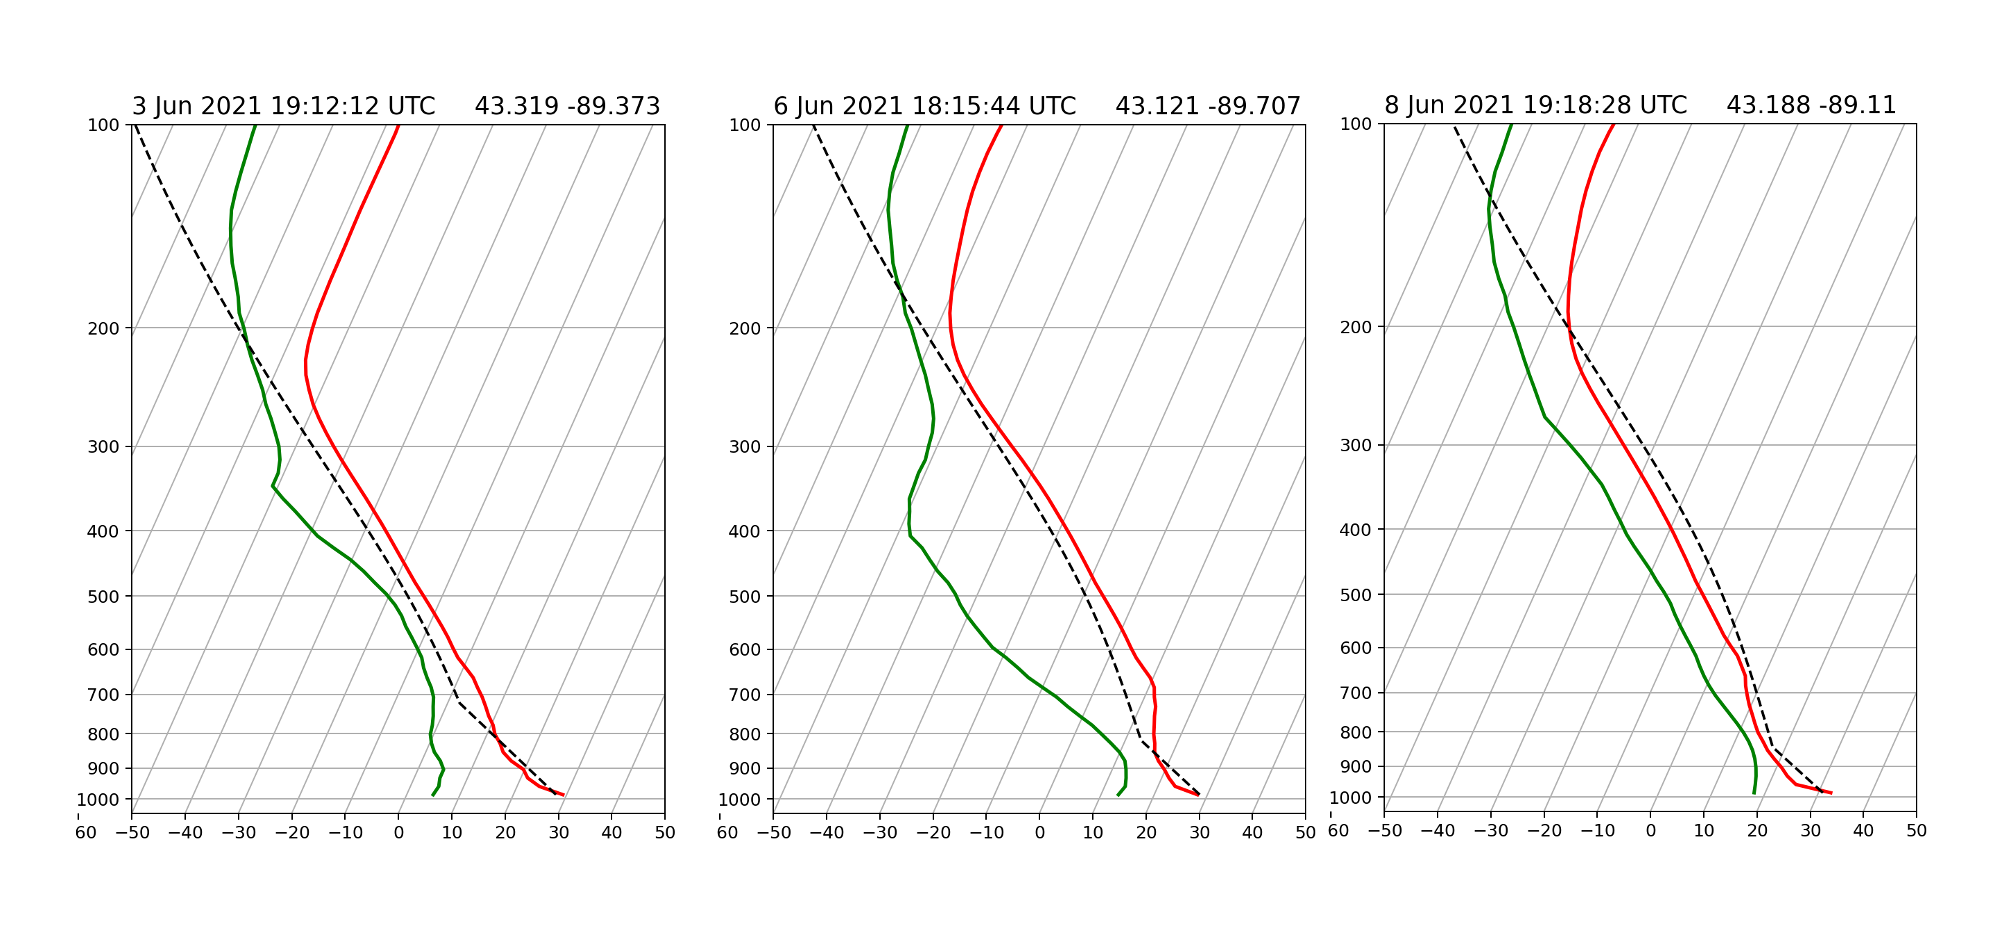
The thermodynamic profiles observed by NOAA-20 and processed by NUCAPS help give insight into the impact of the atmosphere’s change from cool and pleasant to hot and humid. Three profiles are shown here: from Thursday the 3rd, to Sunday the 6th, to Tuesday the 8th. All three are taken in the early afternoon, and all are in the general vicinity of Madison. The surface temperatures on all three days are generally the same. However, the surface dew points show a steady increase from one day to the next. The conditions on the 3rd were warm, but they were not nearly as unpleasant to experience directly as they were on the 8th thanks to the substantial increase in surface moisture that took place during that time.
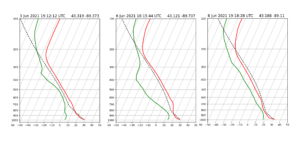
Three skew-T plots from around Madison, Wisconsin, showing an increase in instability.
Of course, surface conditions don’t tell the whole story, and this is where the NUCAPS profiles prove their worth. The dashed line on each sounding represents the temperature of the near-surface mixed layer air parcels as they ascend. These air parcel trajectories were calculated by the SHARPpy package, a free and open-source tool designed to analyze atmospheric soundings. As air rises, it cools, but it cools at different rates depending on if the air is saturated or not. If air from the surface is warmer than the air that surrounds it, it will continue to rise all on its own, but air that’s cooler is going to sink. Note that the 3rd and the 6th are stable days. The dashed line is to the left of the red temperature line. On those days, an ascending air parcel is always colder than its environment and since cold air sinks, no surface-based air is going to rise high enough to make deep convective clouds and the rain that accompanies them. However, on the 8th the situation is reversed: the dashed line is to the right of the temperature sounding which means that air from the surface is warmer than its environment and will rise on its own.
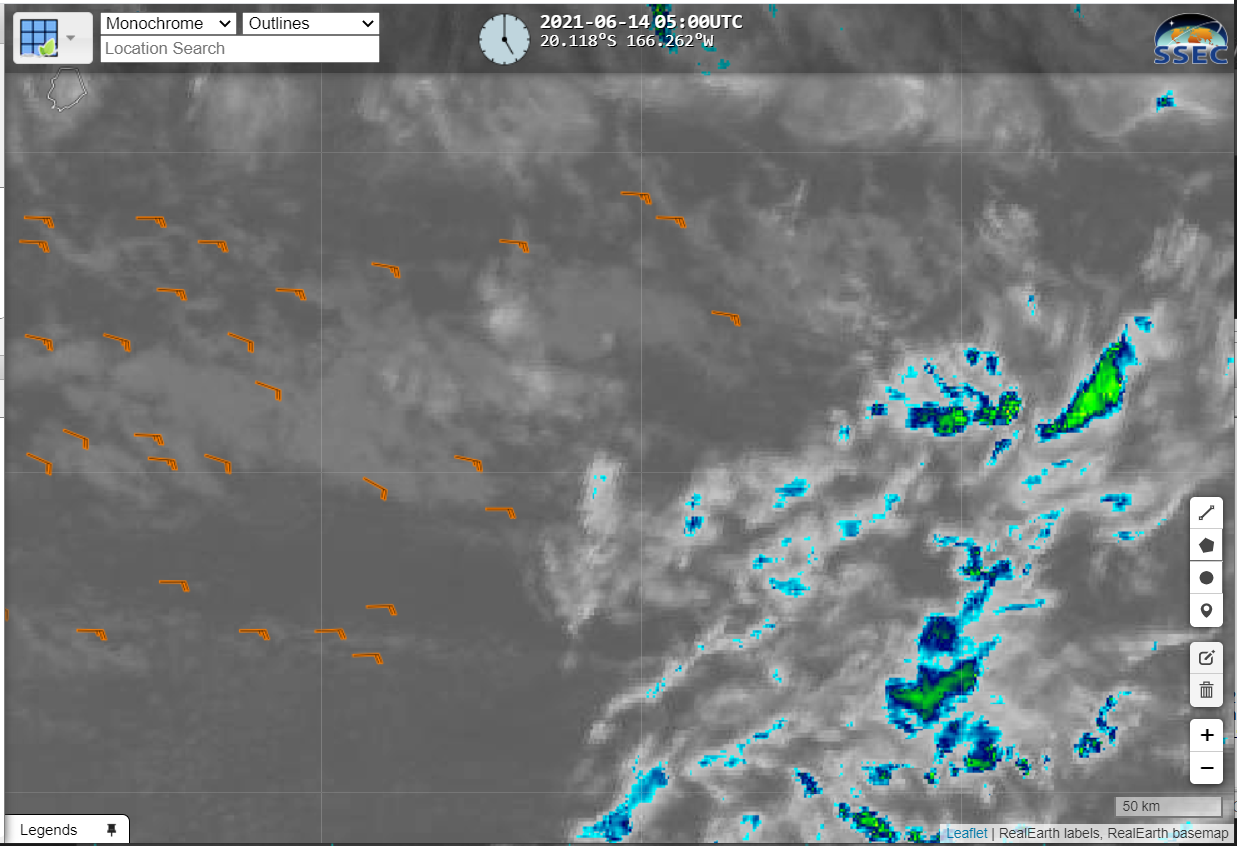
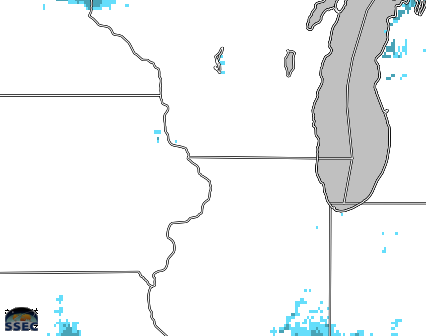
The instability isn’t that large on the 8th; rising air parcels aren’t substantially warmer than their environment and so there’s not a lot of buoyant energy. Still, it has been enough to contribute to some localized showers. That’s evident on the CMORPH satellite-based precipitation estimates over the midwest (available on SSEC RealEarth), which shows virtually no rain on the 6th but the results of some scattered showers in south-central Wisconsin on the 8th. It’s not much, but right now the area needs every drop it can get.
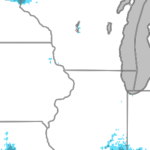
CMORPH rain estimates for 6 June 2021.
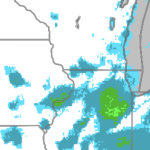
CMORPH rain estimates for 8 June 2021.
View only this post
Read Less

![GOES-16 “Red” Visible (0.64 µm) images, with SPC Storm Reports plotted in red [click to play animation | MP4]](https://cimss.ssec.wisc.edu/satellite-blog/images/2021/06/210608_goes16_visible_spcStormReports_ND_SD_MT_anim.gif)
![GOES-16 “Clean” Infrared Window (10.35 µm) images, with SPC Storm Reports plotted in cyan [click to play animation | MP4]](https://cimss.ssec.wisc.edu/satellite-blog/images/2021/06/210608_goes16_infrared_spcStormReports_ND_SD_MT_anim.gif)

