
NUCAPS Sounding Availability, 1745 and 1927 UTC on 17 June 2021. Note the overlapping coverage in eastern Iowa (Click to enlarge)
A favorable orbit geometry on NOAA-20 on 17 June 2021 meant that portions of the upper Midwest received NUCAPS soundings 90 minutes apart. This is an ideal way to monitor destabilization on a day when SPC has predicted an enhanced risk of severe weather, as shown below and at this link.

SPC Convective outlook, 2000 UTC on 17 June 2021 (Click to enlarge)
Compare the sounding at 42º N, 92º W from ~1800 UTC to the one from ~1930 UTC, below. Destabilization is apparent; the later profile has a lower LCL and lower LFC, and moisture has increased.
NUCAPS Profiles near 42º N, 92º W at 1800 and 1930 UTC, 17 June 2021 (Click to enlarge)
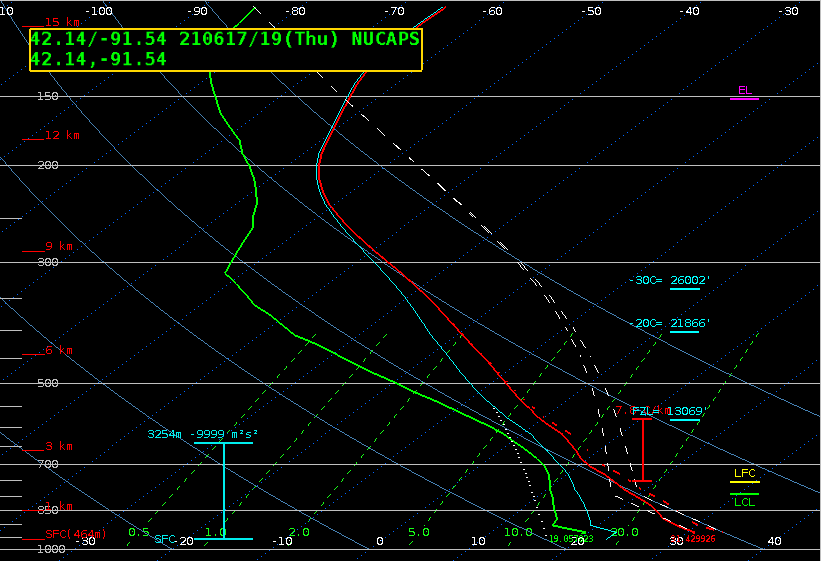
This surface plot from 2000 UTC suggests that the NUCAPS profile at ~1930 UTC has a boundary layer that is too cool and too dry. When the sounding values are edited — the lowest 3 layers were warmed and moistened — to better match the plotted observations, the sounding CAPE increased, and the LCL/LFC dropped even farther.
Original and modified NUCAPS profile at 42.14ºº N, 91.54 W, ~1930 UTC on 17 June 2021 (Click to enlarge)
The convection developed rapidly. The every-90-minutes toggle below (GOES-16 Visible Imagery at 2000, 2130, 2300 UTC) shows that, and the Day Cloud Phase Distinction RGB at the bottom (from 1901-2356 UTC) does too.
GOES-16 Band 2 Visible (0.64 µm) Imagery, 2001, 2136, 2301 UTC on 17 June 2021 (Click to enlarge)
GOES-16 Day Cloud Phase Distinction RGB, 1901 – 2306 UTC on 17 June 2021 (Click to animate)
A low-level water vapor (GOES-16 Band 10, 7.3 µm) infrared imagery animation, below, from CSPP Geosphere (here is a link that will show the animation in CSPP GeoSphere until about the end of June), shows evidence of a northwestward-propagating gravity wave that might have initiated convection. This feature first interacts with convection over far southeastern Iowa, and then with a southwest-to-northeast line of convection that developed.
View only this post Read Less

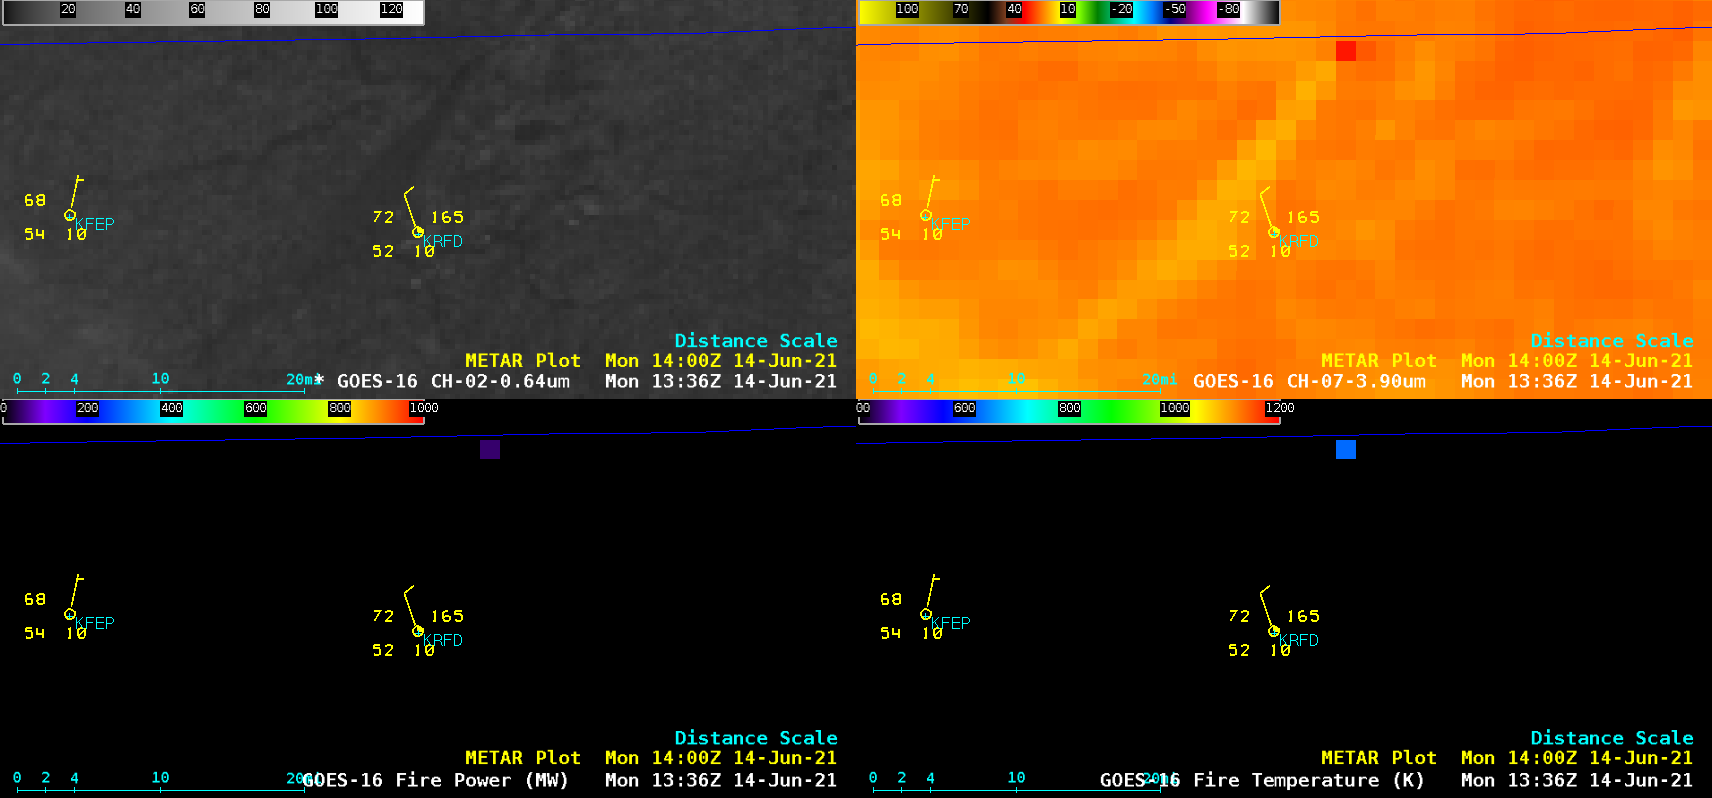
![GOES-16 "Red Visible (0.64 µm, top left), Shortwave Infrared (3.9 µm, top right), Fire Power (bottom left) and Fire Temperature (bottom right) [click to play animation | MP4]](https://cimss.ssec.wisc.edu/satellite-blog/images/2021/06/210614_goes16_visible_shortwaveInfrared_firePower_fireTemperature_IL_chemical_plant_fire_anim.gif)
![Shortwave Infrared (3.9 µm) images from GOES-17 (left) and GOES-16 (right) [click to play animation | MP4]](https://cimss.ssec.wisc.edu/satellite-blog/images/2021/06/210614_goes17_goes16_shortwaveInfrared_IL_fire_anim.gif)
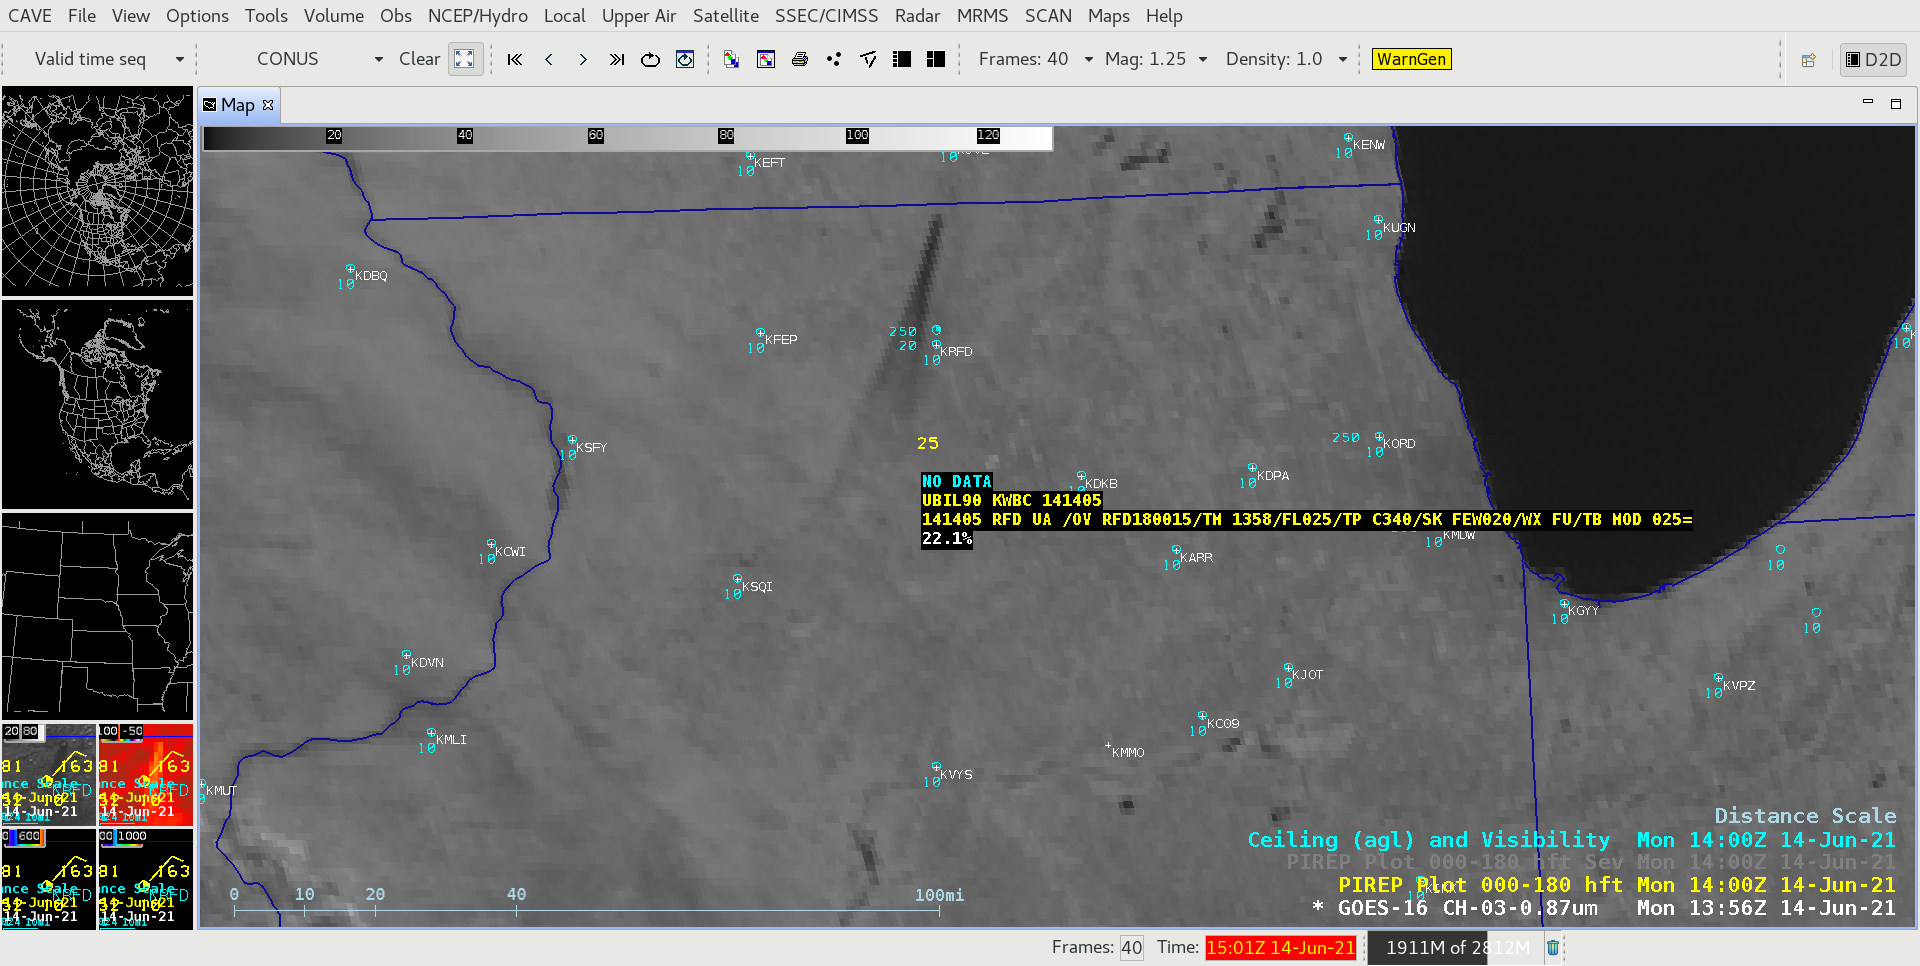
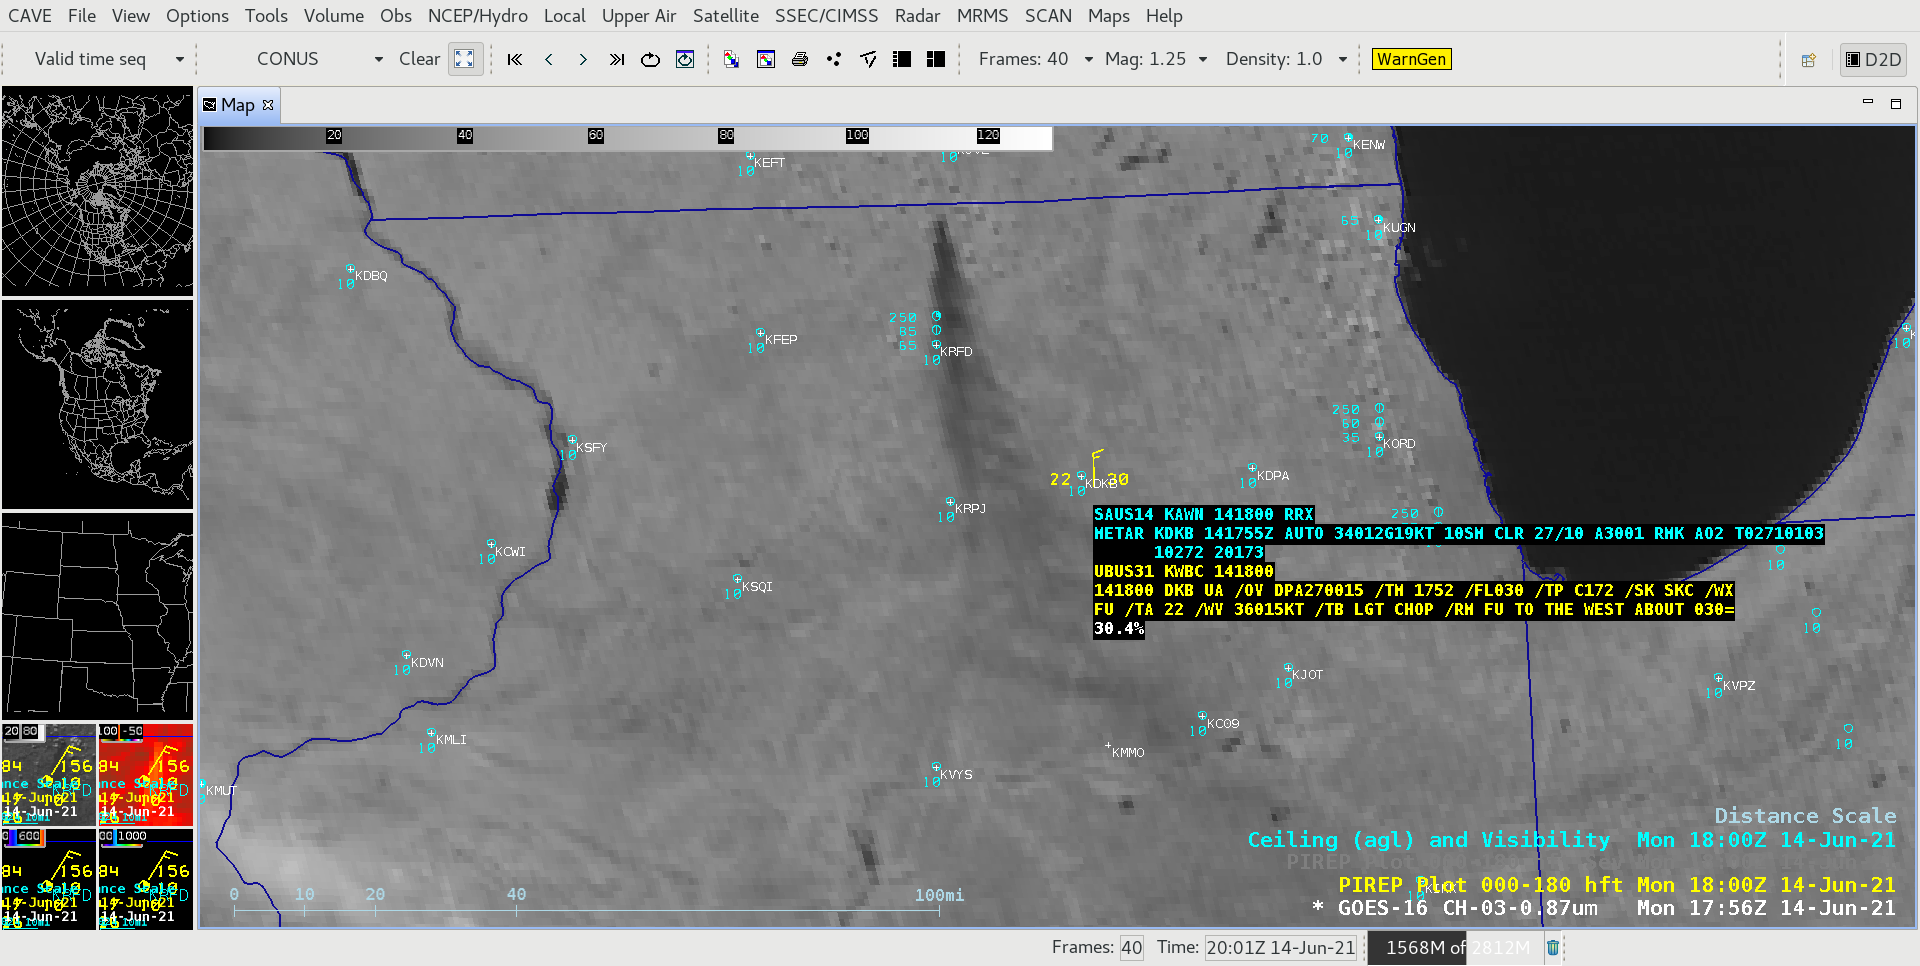
![GOES-16 Near-Infrared "Vegetation" (0.86 µm) image, with plots of pilot reports and airport ceilings and visibility [click to enlarge]](https://cimss.ssec.wisc.edu/satellite-blog/images/2021/06/210614_goes16_nearInfraredVegetation_IL_fire_smoke_plume_anim.gif)
![GOES-16 Near-Infrared "Vegetation" (0.86 µm) images [click to play animation | MP4]](https://cimss.ssec.wisc.edu/satellite-blog/images/2021/06/GOES-16_RadC_C03_2021165_120000_2021165_192500.gif)
![GOES-16 "Red" Visible (0.64 µm) and Near-Infrared "Vegetation" (0.86 µm) images at 1516 UTC (credit: Tim Schmit, NOAA/NESDIS) [click to enlarge]](https://cimss.ssec.wisc.edu/satellite-blog/images/2021/06/GOES-16_ABI_RadC_C02_C03_2021165_151616Z.gif)
![GOES-16 True Color RGB images [click to play animation | MP4]](https://cimss.ssec.wisc.edu/satellite-blog/images/2021/06/210614_goes16_trueColorRGB_IL_fire_smoke_plume_anim.gif)
![GOES-16 Day Land Cloud RGB images [click to play animation | MP4]](https://cimss.ssec.wisc.edu/satellite-blog/images/2021/06/210614_goes16_dayLandCloudRGB_IL_fire_smoke_plume_anim.gif)
![GOES-16 Day Snow Fog RGB images [click to play animation | MP4]](https://cimss.ssec.wisc.edu/satellite-blog/images/2021/06/GOES-16_RadC_day_snow_fog_2021165_120000_2021165_192500.gif)
