
GOES-16 Red Visible (Band 2, 0.64 µm) imagery, 1056 -1431 UTC on 28 June 2021 (click to animate)
Update: Tropical Depression 4 strengthened to become Tropical Storm Danny at 1905 UTC on 28 June (link).
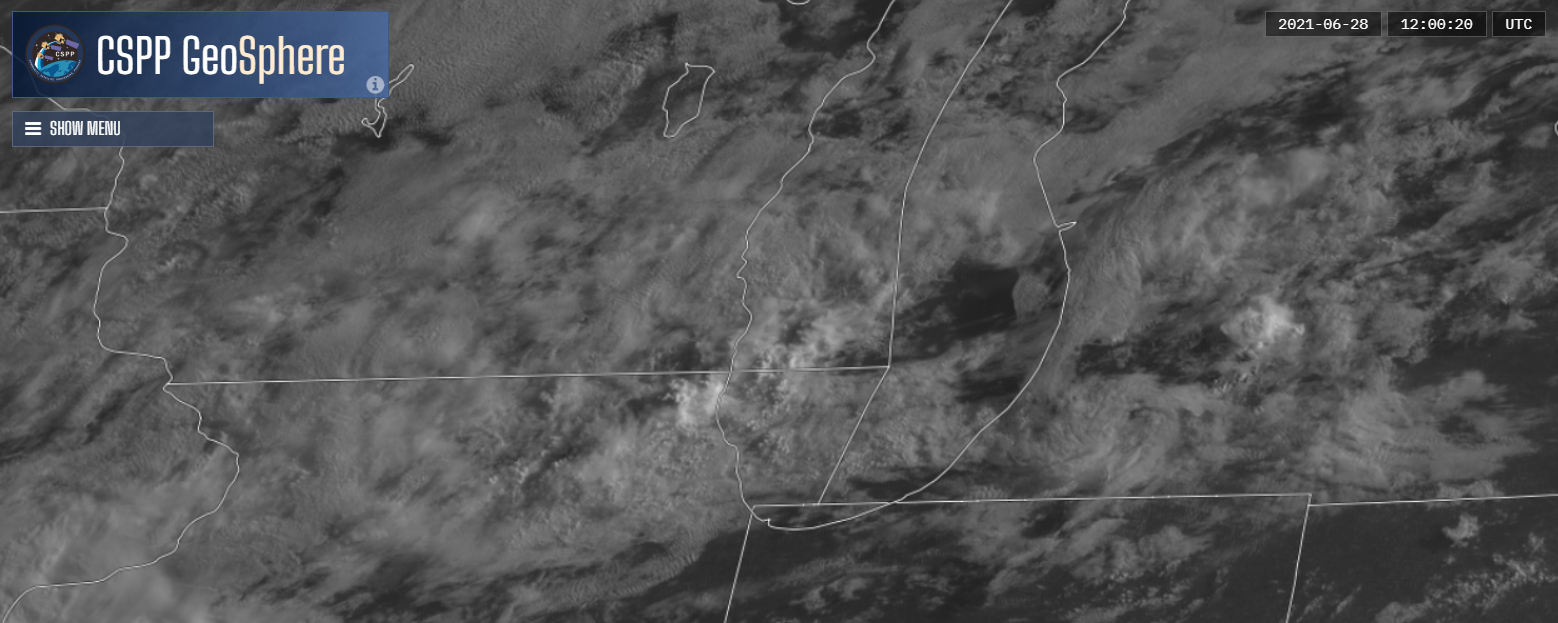
GOES-16 visible imagery (0.64 µm), above, from the morning of 28 June 2021, shows a compact low-level circulation east of South Carolina, steadily moving towards the coast. Deep convection with this system is offset to the east, suggestive of shear, and the shear analysis from the SSEC Tropical website, below, does show easterly shear over the system.

Wind shear analysis, 1200 UTC on 28 June 2021 (Click to enlarge)
VIIRS Day Night Band imagery, below, from Suomi-NPP at 0723 UTC on 28 June, a time with ample lunar illumination, shows convection over the center of the storm at that time.
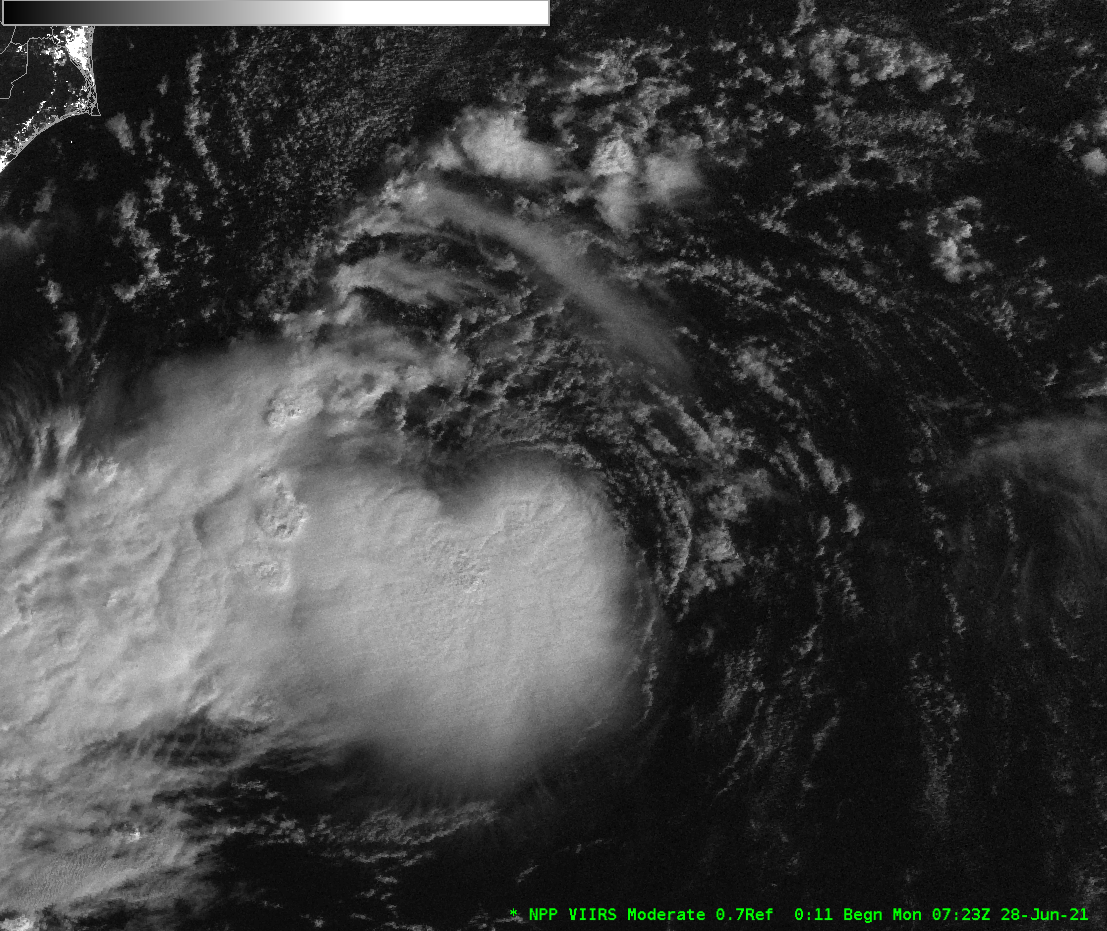
Suomi-NPP VIIRS Day Night Band Visible (0.70 µm) imagery, 0723 UTC on 28 June 2021 (Click to enlarge)
The wind shear analysis from 1900 UTC, below, is more in line with what might be expected in a system with an exposed low-level circulation center.

Wind shear analysis, 1900 UTC on 28 June 2021 (Click to enlarge)
The National Hurricane Center initiated statements on this tropical system at 1500 UTC on 28 June 2021. Refer to those webpages (link) for further information. Tropical Storm warnings are in effect for parts of the South Carolina coast, from Edisto Beach to the S. Santee River.
View only this post Read Less


![GOES-17 Shortwave Infrared (3.9 µm) images, with hourly surface temperatures plotted in yellow [click to play animation | MP4]](https://cimss.ssec.wisc.edu/satellite-blog/images/2021/06/210626_210627_goes17_shortwaveInfrared_surfaceTemperatures_WA_OR_heatwave_anim.gif)
![GOES-17 True Color RGB mages [click to play animation | MP4]](https://cimss.ssec.wisc.edu/satellite-blog/images/2021/06/210626_210627_goes17_trueColorRGB_Pacific_Northwest_anim.gif)
