NOAA-20 NUCAPS Profiles over the USA Great Plains, 0845 UTC on 2 July 2021 (Click to enlarge)
As noted here, CIMSS scientist Tim Wagner has created a short python script to read NUCAPS files generated by Community Satellite Processing Package CSPP software and Direct Broadcast (DB) data at UW-Madison CIMSS. The script relies upon several python packages: netCDF4 (version 1.5.7), matplotlib (version 3.4.2), numpy (version 1.21.0) and sharppy. DB NUCAPS files are available from https://ftp.ssec.wisc.edu/pub/eosdb/j01/crisfsr/yyyy_mm_dd_jday_hhmm/edr/ ; Files have names like this: NUCAPS-EDR_v2r0_j01_s202107020845119_e202107020845417_c202107020928000.nc (similar to the naming convention in NOAA CLASS); the filename above contains one data granule from 08:45:11.9 to 08:45:41.7 on 2 July 2021; this orbital plot (from here) suggests that data is over the Great Plains of the United States.
The output from the python script is all the NUCAPS profiles from the granule. There are 30 NUCAPS profiles for each scan line, and 4 scan lines per granule. The animation at top shows the soundings along with a mapping showing their location.
This retrieval of NUCAPS profiles occurred on a quiet weather day: the NUCAPS plot of sounding availability (here) showed mostly ‘green’ points (vs. yellow or red), signifying convergence in the infrared retrieval. The image below compares the NUCAPS sounding in AWIPS (left) with the one processed via CSPP. There is good agreement.
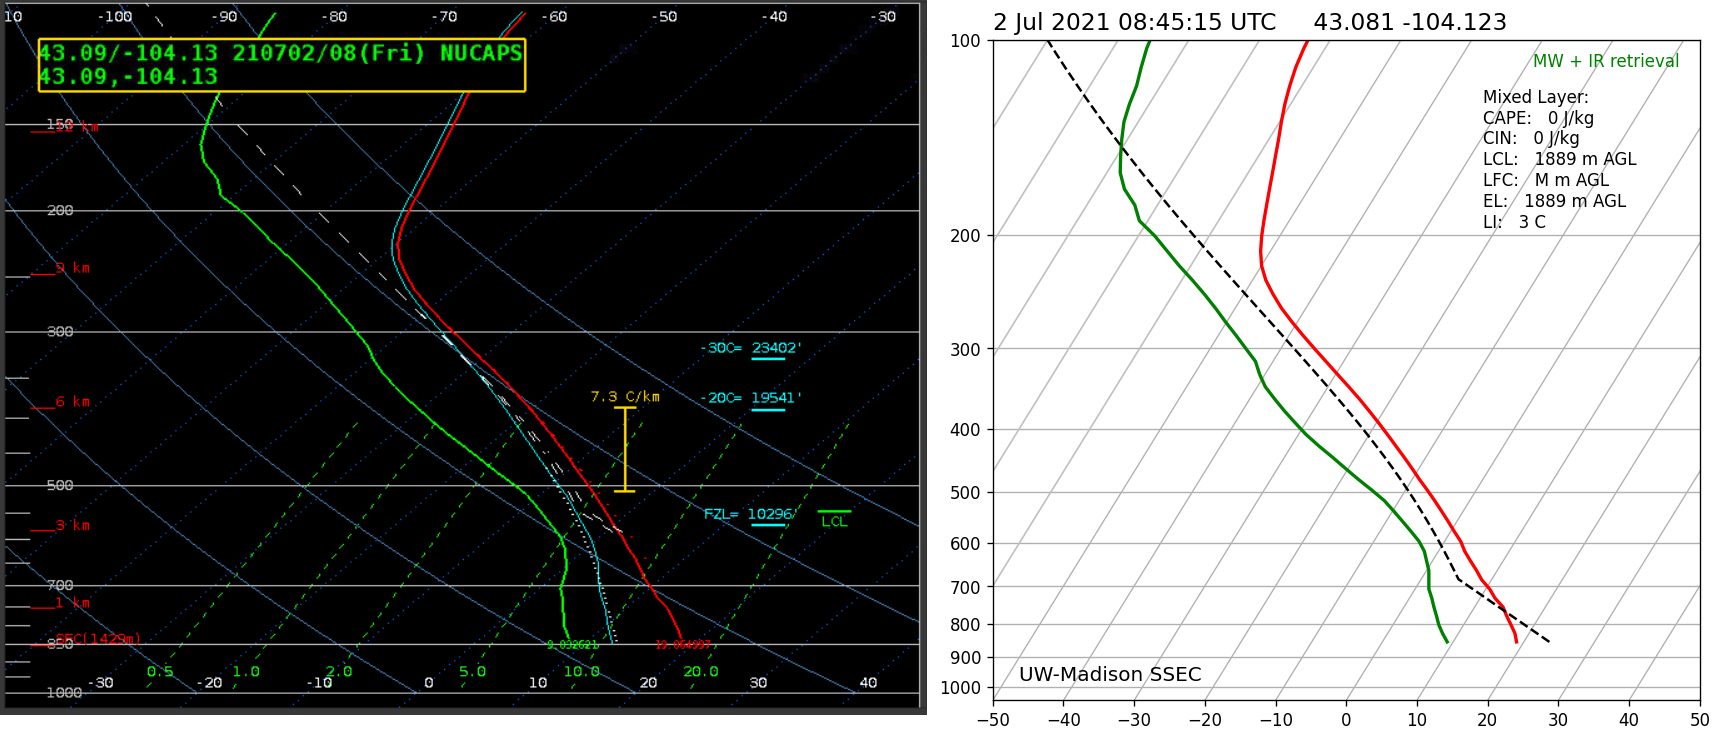 NOAA-20 NUCAPS Plot from AWIPS (left) and from CSPP (right) at 0845 UTC on 2 July 2021 for a point near the Nebraska/South Dakota/Wyoming border (Click to enlarge)[/caption
View only this post Read Less
![GOES-17 “Red” Visible (0.64 µm, top), Shortwave Infrared (3.9 µm, middle) and “Clean” Infrared Window (10.35 µm, bottom) [click to play animation | MP4]](https://cimss.ssec.wisc.edu/satellite-blog/images/2021/06/210630_goes17_visible_shortwaveInfrared_infraredWindow_BC_pyroCb_anim.gif)
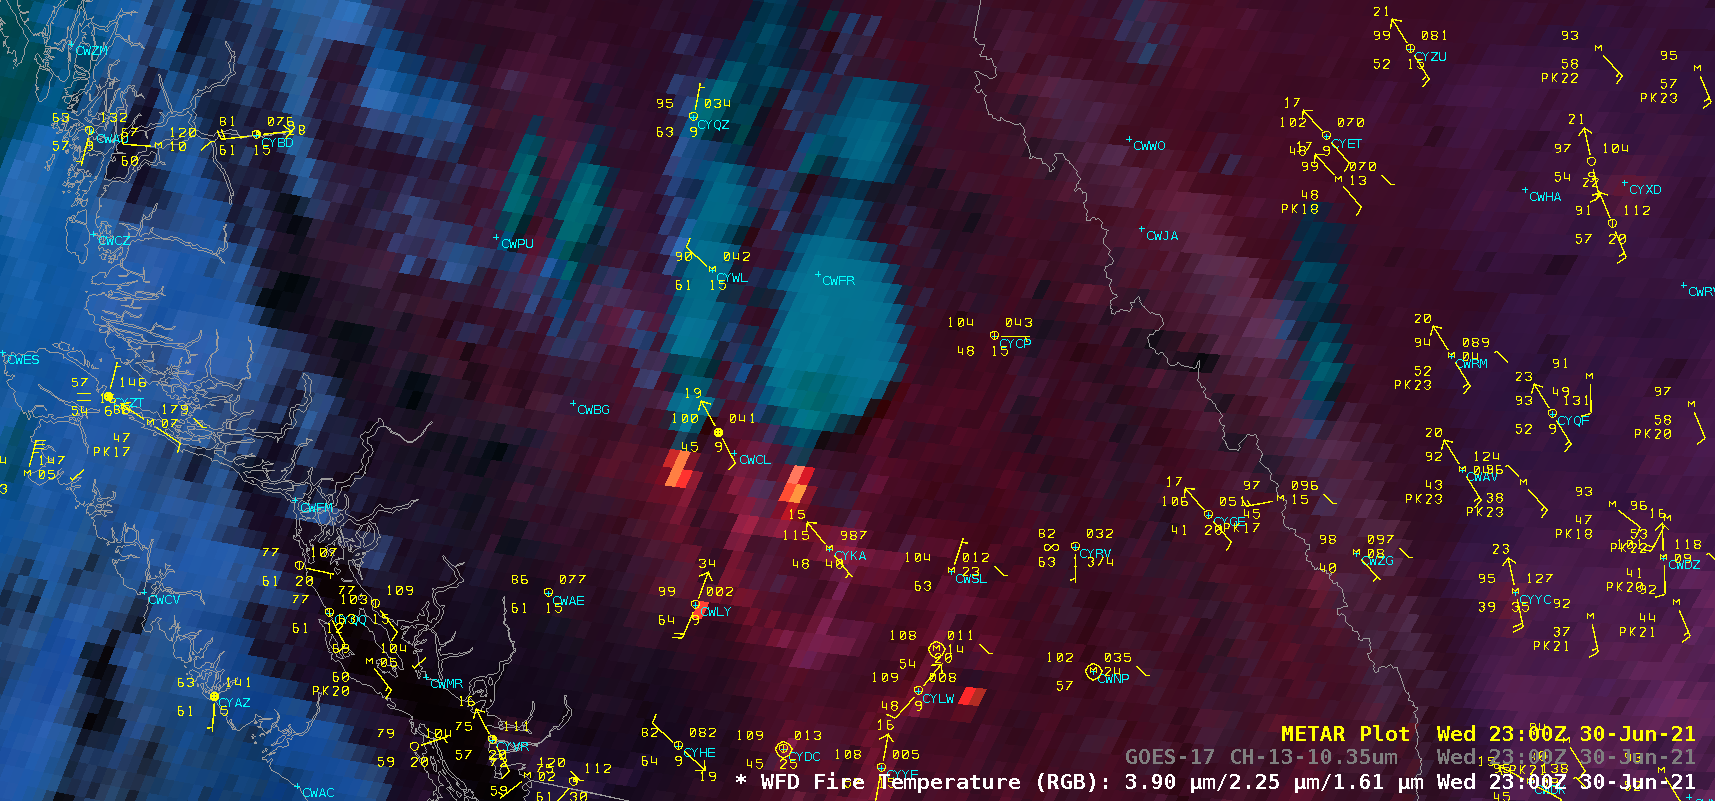
![GOES-17 Fire Temperature RGB images, with surface reports plotted in yellow [click to play animation | MP4]](https://cimss.ssec.wisc.edu/satellite-blog/images/2021/06/210630_goes17_fireTemperatureRGB_BC_pyroCb_anim.gif)
![GOES-17 “Red” Visible (0.64 µm, top), Shortwave Infrared (3.9 µm, middle) and “Clean” Infrared Window (10.35 µm, bottom) [click to play animation | MP4]](https://cimss.ssec.wisc.edu/satellite-blog/images/2021/06/210630_goes17_visible_shortwaveInfrared_infraredWindow_CA_pyroCb_anim.gif)
![GOES-16 “Red” Visible (0.64 µm) images [click to play animation | MP4]](https://cimss.ssec.wisc.edu/satellite-blog/images/2021/06/210628_goes16_visible_South_America_subtropical_storm_anim.gif)
![GOES-16 “Clean” Infrared Window (10.35 µm) images [click to play animation | MP4]](https://cimss.ssec.wisc.edu/satellite-blog/images/2021/06/210628_goes16_infrared_South_America_subtropical_storm_anim.gif)
![GOES-16 “Red” Visible (0.64 µm) images [click to play animation | MP4]](https://cimss.ssec.wisc.edu/satellite-blog/images/2021/06/210629_goes16_visible_South_America_subtropical_storm_anim.gif)
![GOES-16 “Clean” Infrared Window (10.35 µm) images [click to play animation | MP4]](https://cimss.ssec.wisc.edu/satellite-blog/images/2021/06/210629_goes16_infrared_South_America_subtropical_storm_anim.gif)
![ASCAT winds from Metop-A and Metop-C [click to enlarge]](https://cimss.ssec.wisc.edu/satellite-blog/images/2021/06/210628_210629_metopA_metopC_ascat_Subtropical_Storm_Raoni_anim.gif)
