The use of routine multispectral geostationary satellite imagery over the United States has increased the routine use of Red/Green/Blue composite imagery to describe and evaluate surface and atmospheric conditions. This blog post will detail how to create new (or old) RGB composites using two UW-Madison/CIMSS/SSEC-developed tools: The Satellite Information and... Read More
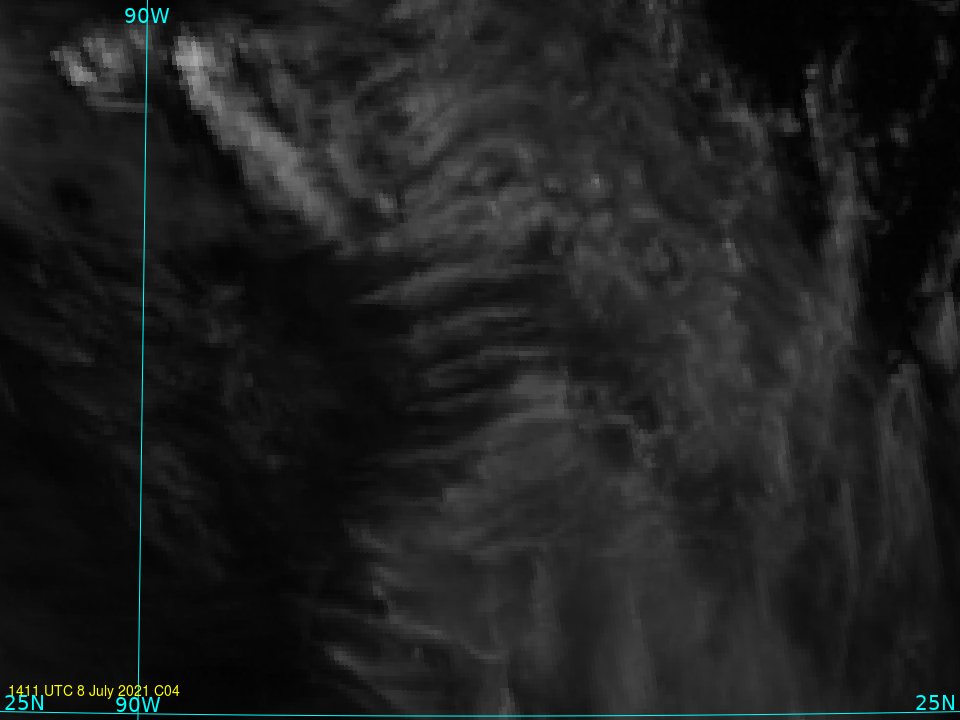
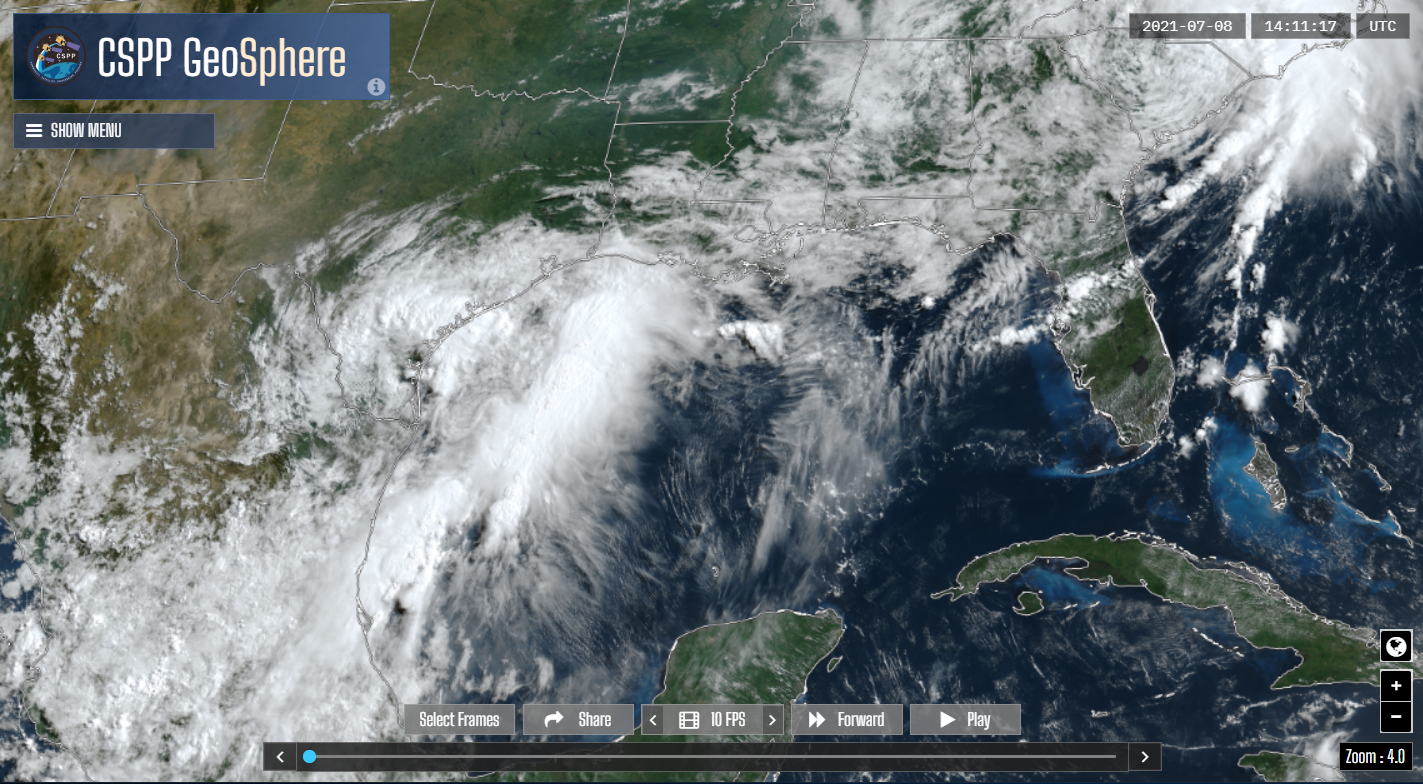
The use of routine multispectral geostationary satellite imagery over the United States has increased the routine use of Red/Green/Blue composite imagery to describe and evaluate surface and atmospheric conditions. This blog post will detail how to create new (or old) RGB composites using two UW-Madison/CIMSS/SSEC-developed tools: The Satellite Information and Familiarization Tool (SIFT; Journal article link) and Geo2Grid (Previous blog posts showing Geo2Grid examples are here). The scene to be highlighted is shown above in the GOES-16 Cirrus Band; it was chosen because of the interesting parallel bands in the Cirrus, features that can identify regions of turbulence. A larger-scale view of the data (created using CSPP Geosphere) is here (for the 1.37 µm Cirrus band) or here (for True Color).
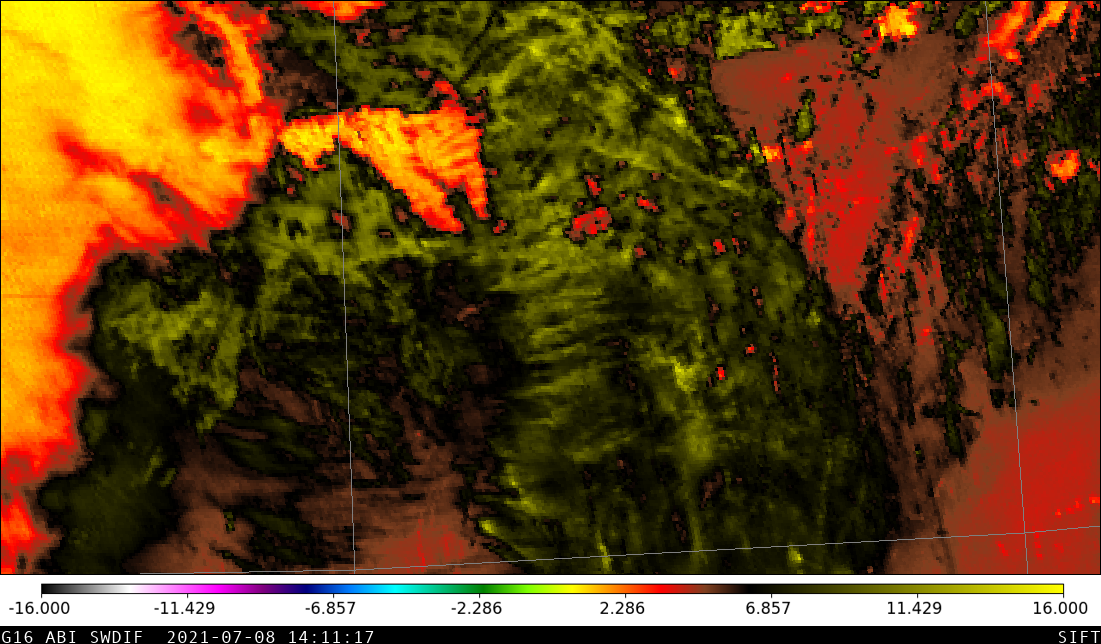
SIFT has a very useful (and easy!) RGB generator. For this case involving cirrus, I decided to create an RGB using the Split Window Difference (10.3 µm – 12.3 µm, Band 13 – Band 15) (shown here) that has been used to identify cirrus for quite a while (link to journal article), the cirrus band 4, and also the Snow/Ice channel Band 5 (1.61 µm). After downloading SIFT and importing the data (and creating the split window difference field — here’s a blog post that describes how to do that), a SIFT user can create an RGB and tinker with the bounds. Changing the bounds and the gamma causes a simultaneous change in the RGB in the SIFT display window, so it’s not difficult to iterate to a satisfactory solution. As shown below, the RGB created has the Split Window Difference as the red component, with values from 0 (no red) to 12.0 (saturated red) and a Gamma value of 2; the cirrus channel (C04) is the green component with values from 0.27 (no green) to 0 (saturated green) and a Gamma value of 2; the snow/ice channel (C05) is the blue component with values from 0.0 (no blue) to 0.40 (saturated blue) and a Gamma value of 1.
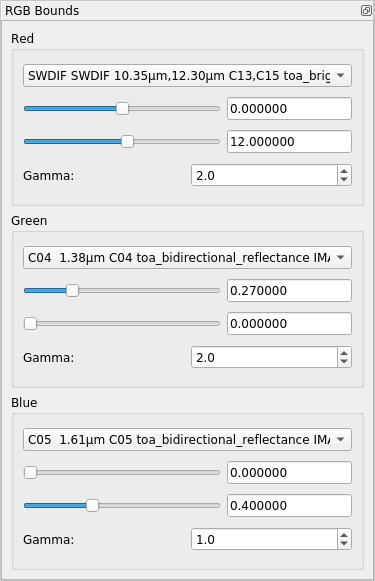
SIFT RGB Creation window
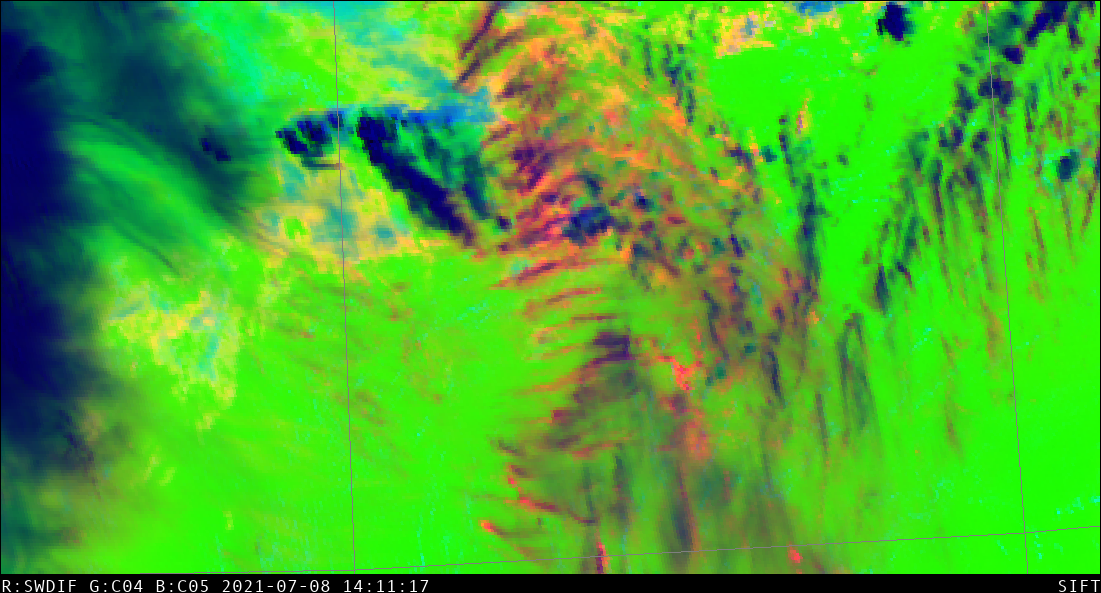
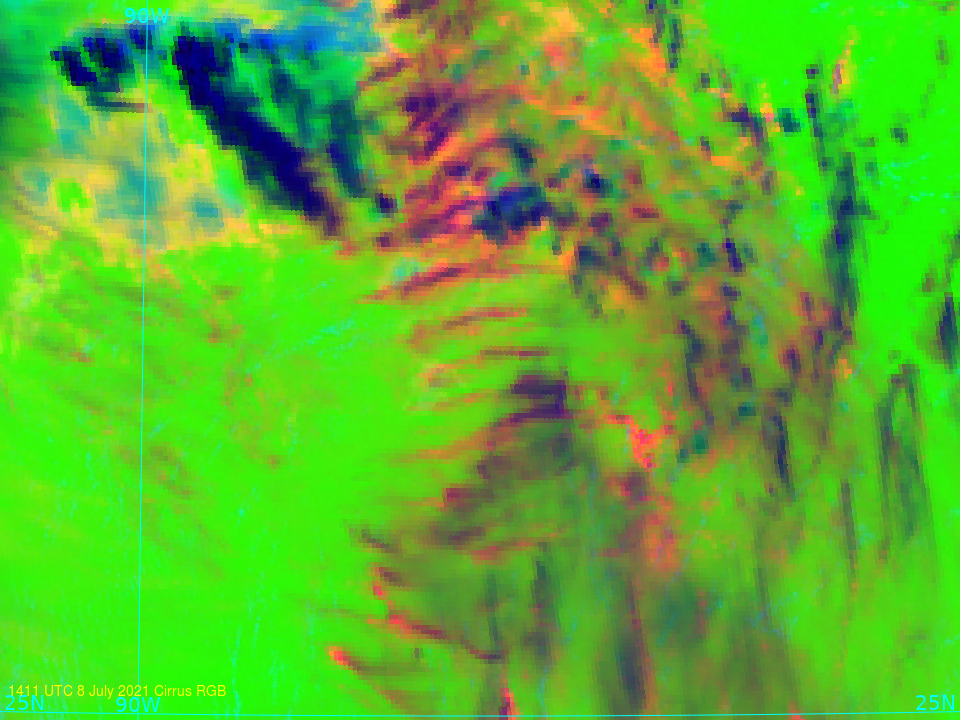
The RGB created in SIFT using these values is shown below. Maybe using maximum green — a color one’s eyes are usually particularly adept at viewing — for no signal in the cirrus channel was not the best choice. But there is nice contrast between the background and the thin cirrus, and an obvious difference between the parallel lines of cirrus in the middle of the image and other clouds, such as the cirrus at the western edge of the image!
“Cirrus” RGB at 1411 UTC on 8 July 2021 (click to enlarge)
How do you create something similar using Geo2Grid? Step 1, of course, is always to download and install the software package. To see what products can be created with geo2grid, enter this command: ./geo2grid.sh -r abi_l1b -w geotiff --list-products -f /path/to/the/directory/holding/GOESR/Radiance/Files/*syyyydddhhmm*.nc . Let’s assume all 16 channels from ABI are available. Important caveat: Geo2Grid will only work on one data time at a time, so specify your year/julian day/hour/minute with sufficient stringency.
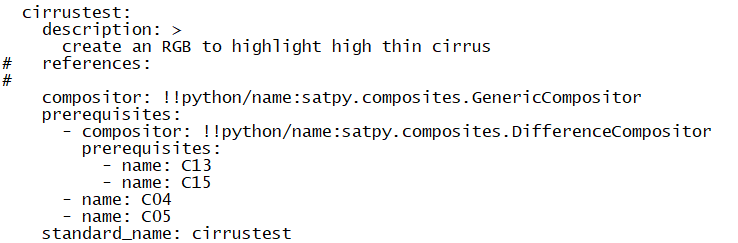
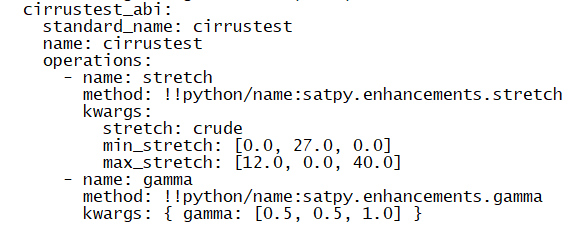
RGB product definitions are found in yaml files within the Geo2Grid directory. Ones for abi in particular are found in $GEO2GRID_HOME/etc/satpy/composites/abi.yaml in which file you would enter something what is shown below for a product called ‘cirrustest’; note that it has three channels: the first is a difference between C13 and C15 (that is, the Split Window Difference); the second is C04 (cirrus channel) and the third is C05 (snow/ice channel). This is the same as in the SIFT definitions.
Within $GEO2GRID_HOME/etc/satpy/enhancements/abi.yaml there is a further definition of this RGB. The crude stretch defines the bounds of the RGB: Red includes values from 0 – 12; Green from 27 — that is, a reflectance of 0.27, or 27% — to 0 (note that it is inverted); Blue from 0 to 40. In addition, Gamma values are specified: 0.5, 0.5 and 1.
Two important things to note: Gamma in SIFT follows National Weather Service and JMA conventions. Gamma in Geo2Grid follows EUMETSAT conventions. Thus, one is the reciprocal of the other. Also, note the _abi suffix in the abi.yaml file name in enhancements, i.e., cirrustest_abi, to specify the satellite.
After making these changes to the two abi.yaml files, and rerunning this command: ./geo2grid.sh -r abi_l1b -w geotiff --list-products -f /path/to/the/directory/holding/GOESR/Radiance/Files/*syyyydddhhmm*.nc, you should see a new possibility: cirrustest (or whatever you have named your new RGB). Then you run Geo2Grid commands to create the cirrustest RGB (with the -p cirrustest flag. The commands below sequentially create the grid for the analysis, create the tiff file, georeference it with coastlines (none, in this case over the Gulf) and latitude/longitude lines, and annotate it.
../p2g_grid_helper.sh CIRRUSRGBtest -88.3 26.6 500 -500 960 720 > $GEO2GRID_HOME/CIRRUSRGBtest.conf

#

../geo2grid.sh -r abi_l1b -w geotiff -p cirrustest C04 -g CIRRUSRGBtest --grid-configs $GEO2GRID_HOME/CIRRUSRGBtest.conf --method nearest -f /arcdata/goes_restricted/grb/goes16/2021/2021_07_08_189/abi/L1b/RadC/*s20211891411*.nc

../add_coastlines.sh --add-borders --borders-outline='blue' --borders-resolution=f --add-grid --grid-text-size 20 --grid-d 5.0 5.0 --grid-D 5.0 5.0 GOES-16_ABI_RadC_cirrustest_20210708_1411??_CIRRUSRGBtest.tif

convert GOES-16_ABI_RadC_cirrustest_20210708_1411??_CIRRUSRGBtest.png -gravity Southwest -fill yellow -pointsize 14 -annotate +8+24 "1411 UTC 8 July 2021 Cirrus RGB" GOES-16_ABI_RadC_cirrustest_20210708_1411_CIRRUSRGBtest_annot_2.png
The final image from Geo2Grid is shown below. Its geographic coverage is slightly different than in SIFT, above, but the two RGBs have similar looks.
‘Cirrustest’ RGB at 1411 UTC on 8 July 2021 (Click to enlarge)
View only this post
Read Less
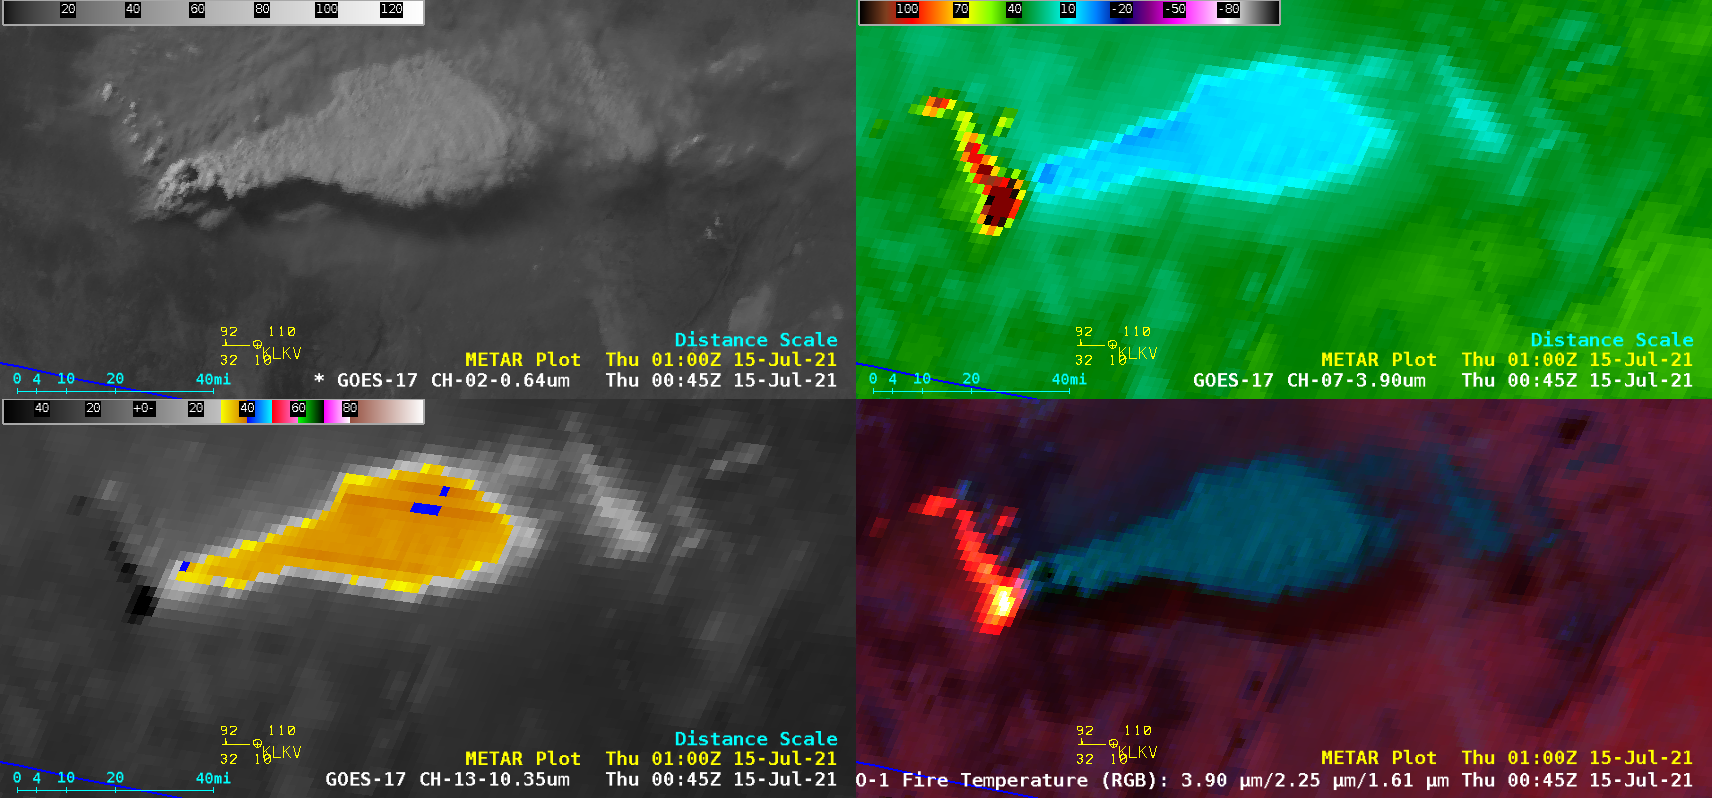
![GOES-17 "Red" Visible (0.64 µm, top left), Shortwave Infrared (3.9 µm, top right), "Clean" Infrared Window (10.35 µm, bottom left) and Fire Temperature RGB (bottom right) [click to play animation | MP4]](https://cimss.ssec.wisc.edu/satellite-blog/images/2021/07/210714_goes17_Bootleg_Fire_OR_pyroCb_anim.gif)
![Plot of 00 UTC rawinsonde data from Medford, Oregon [click to enlarge]](https://cimss.ssec.wisc.edu/satellite-blog/images/2021/07/210715_00utc_kmfr_raob.png)
![GOES-17 "Red" Visible (0.64 µm, top) and Near-Infrared "Cirrus" (1.37 µm, bottom) images [click to play animation | MP4]](https://cimss.ssec.wisc.edu/satellite-blog/images/2021/07/210715_goes17_visible_nearInfraredCirrus_BootlegFire_OR_smoke_Rockies_anim.gif)
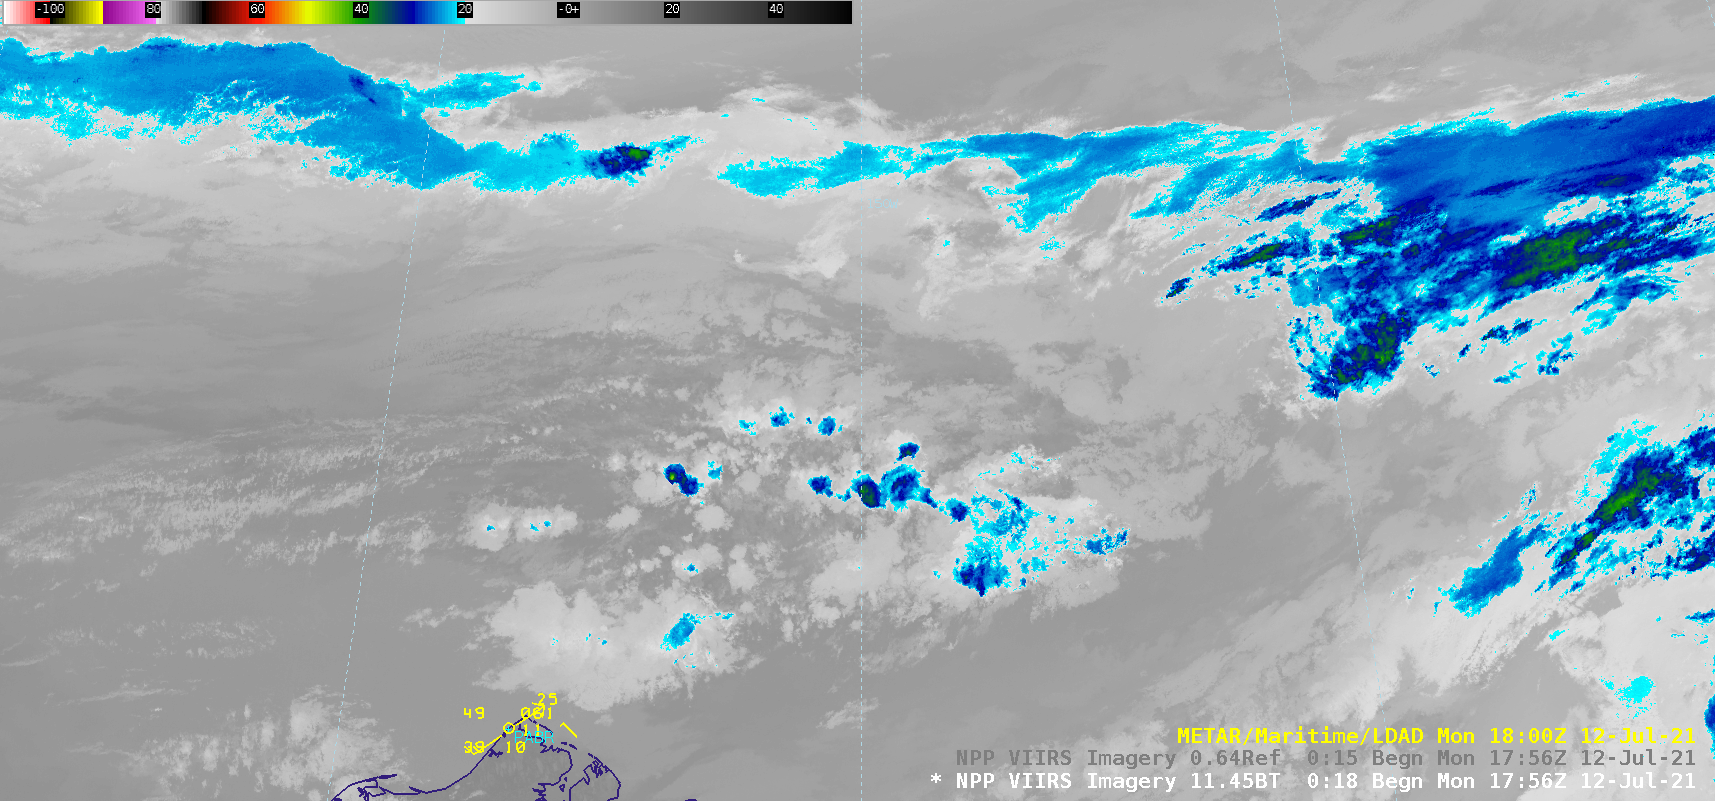
![Suomi NPP VIIRS Infrared Window (11.45 µm) and Visible (0.64 µm) images [click to play animation | MP4]](https://cimss.ssec.wisc.edu/satellite-blog/images/2021/07/210712_suomiNPP_viirs_infrared_visible_Chukchi_Sea_Beaufort_Sea_convection_anim.gif)
![Suomi NPP VIIRS Infrared Window (11.45 µm) images, with contours of NAM40 lapse rate within the 500-300 hPa layer [click to enlarge]](https://cimss.ssec.wisc.edu/satellite-blog/images/2021/07/210712_suomiNPP_viirs_infrared_500_300_lapse_rate_anim.gif)
![NUCAPS profile near thunderstorms off the northern coast of Alaska [click to enlarge]](https://cimss.ssec.wisc.edu/satellite-blog/images/2021/07/210712_15utc_nucaps_profile_Arctic_Ocean_convection.png)
