Microwave estimates of total precipitable water over the western Pacific Ocean (available here) show a moist airmass — out of which Typhoon In-Fa (seen near Taiwan in the animation) emerged — over the western Pacific Ocean. (The circulation of Tropical cyclone Cempaka is also apparent near the Gulf of Tonkin) This rich moisture has led to very heavy rains and Flash Flood alerts on the island of Guam (at 13.4ºN, 144.5ºE). Are there any indications that a new tropical cyclone will emerge out of the moisture?
The toggle below shows Himawari-8 10.41 µm “Clean Window” infrared imagery (notice In-Fa in the northwest part of the image). A distinct trough is apparent in the scatterometery north of the Marianas islands (and north of 20ºN latitude), with west-southwesterly surface winds bordered by east-southeasterlies to the north. Weaker winds are indicated south of Guam. (For a recent primer on Scatterometer winds, click here; ASCAT winds can be found online here)
NOAA-20 overflew this region at 1600 UTC on 22 July. The imagery below shows Tropopause Heights as well as Total Precipitable water — along with Band 13 imagery (over a different location) at that time. NUCAPS estimates of TPW are in the 60-70 mm range (in agreement with the MIMIC animation above); Very high tropopauses are Equatorward of 20 N Latitude.
A ribbon of small wind shear exists, as shown in the 200-850 wind shear analysis below, taken from the CIMSS Tropical Website. Meteorologists continue to monitor this region of tropical activity.
View only this post Read Less

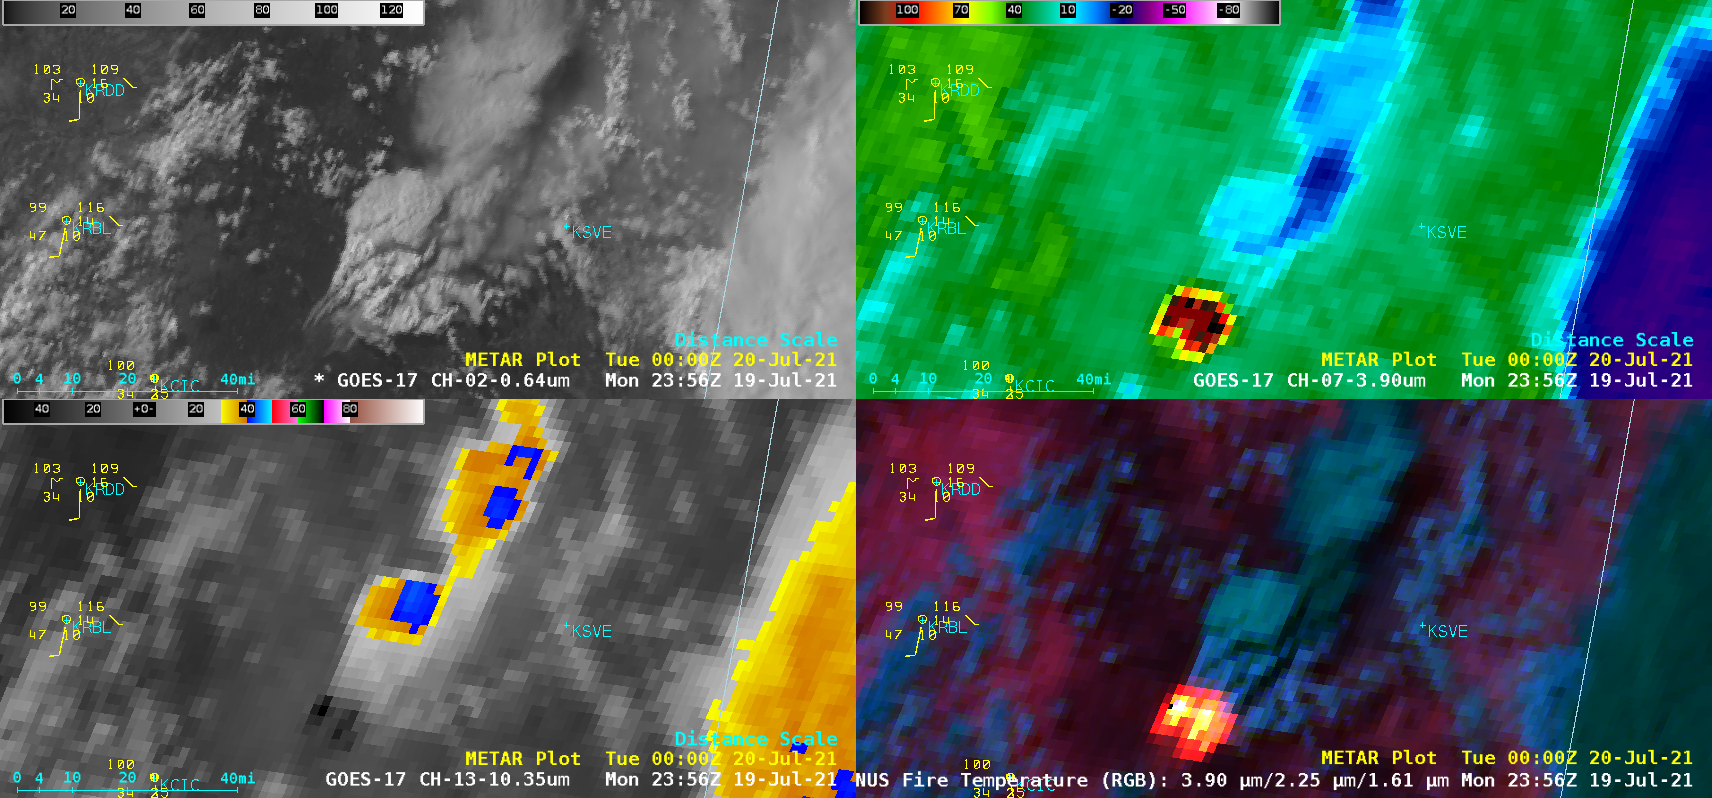
![GOES-17 “Red” Visible (0.64 µm, top left), Shortwave Infrared (3.9 µm, top right), “Clean” Infrared Window (10.35 µm, bottom left) and Fire Temperature RGB (bottom right) [click to play animation | MP4]](https://cimss.ssec.wisc.edu/satellite-blog/images/2021/07/210719_goes17_visible_shortwaveInfrared_infraredWindow_fireTemperatureRGB_Dixie_Fire_CA_anim.gif)


![GOES-8 Visible images [click to play animation | MP4]](https://cimss.ssec.wisc.edu/satellite-blog/images/2021/07/960718_goes8_visible_Oakfield_WI_tornado_anim.gif)
![GOES-8 Infrared images [click to play animation | MP4]](https://cimss.ssec.wisc.edu/satellite-blog/images/2021/07/960718_goes8_infraredWindow_Oakfield_WI_tornado_anim.gif)
![GOES-8 Water Vapor images [click to play animation | MP4]](https://cimss.ssec.wisc.edu/satellite-blog/images/2021/07/960718_goes8_waterVapor_Oakfield_WI_tornado_anim.gif)
