This website works best with a newer web browser such as Chrome, Firefox, Safari or Microsoft
Edge. Internet Explorer is not supported by this website.
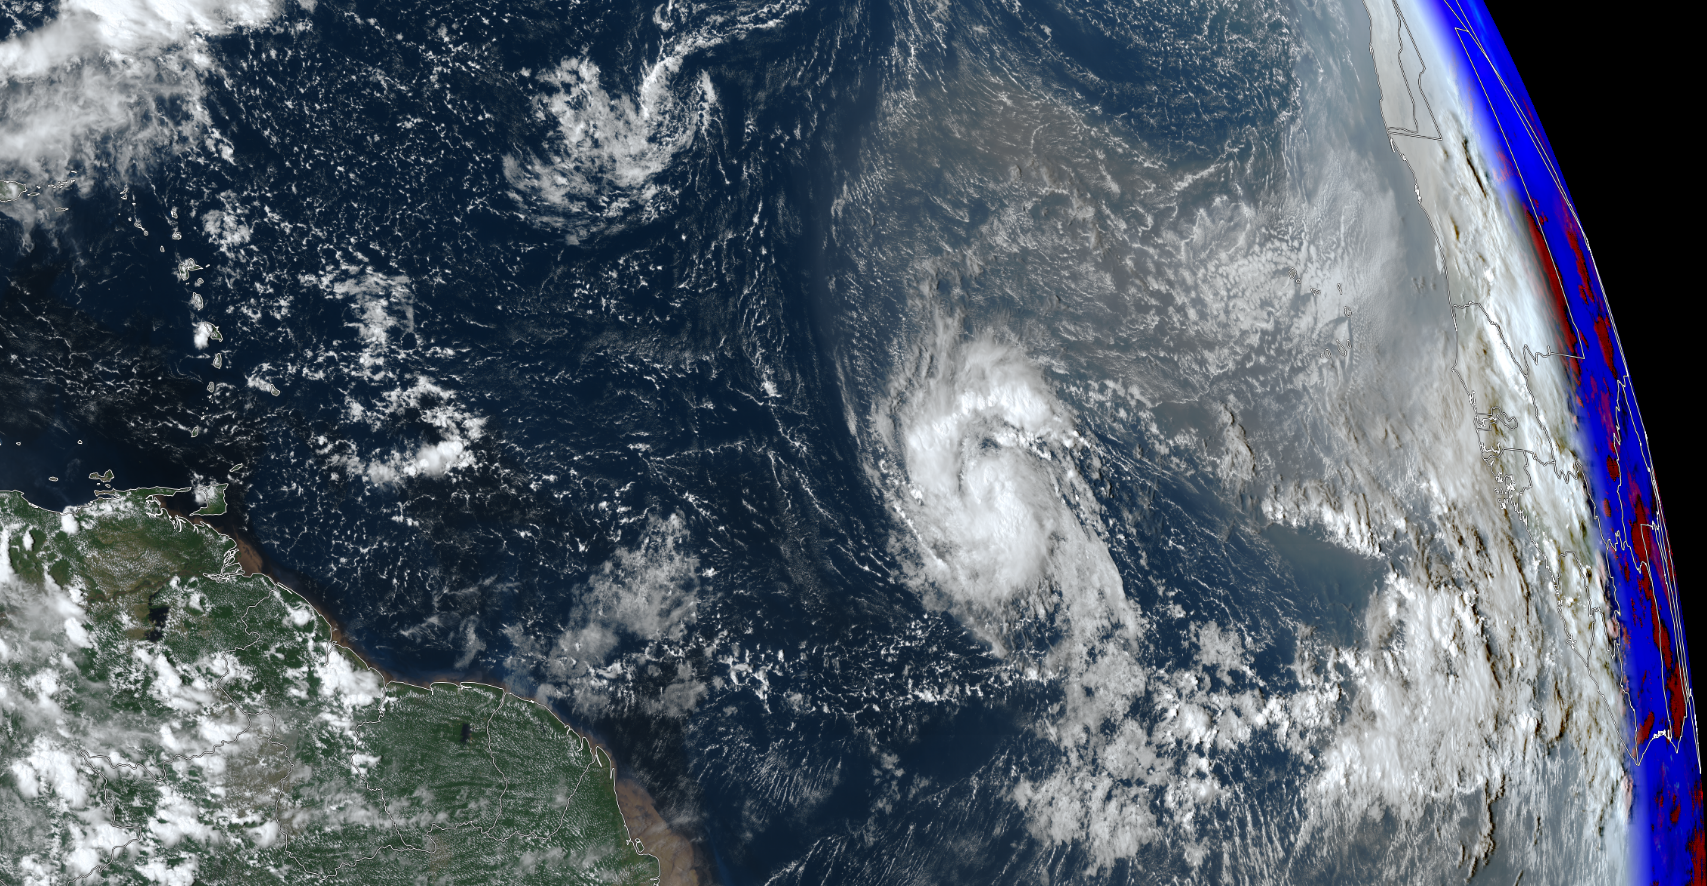
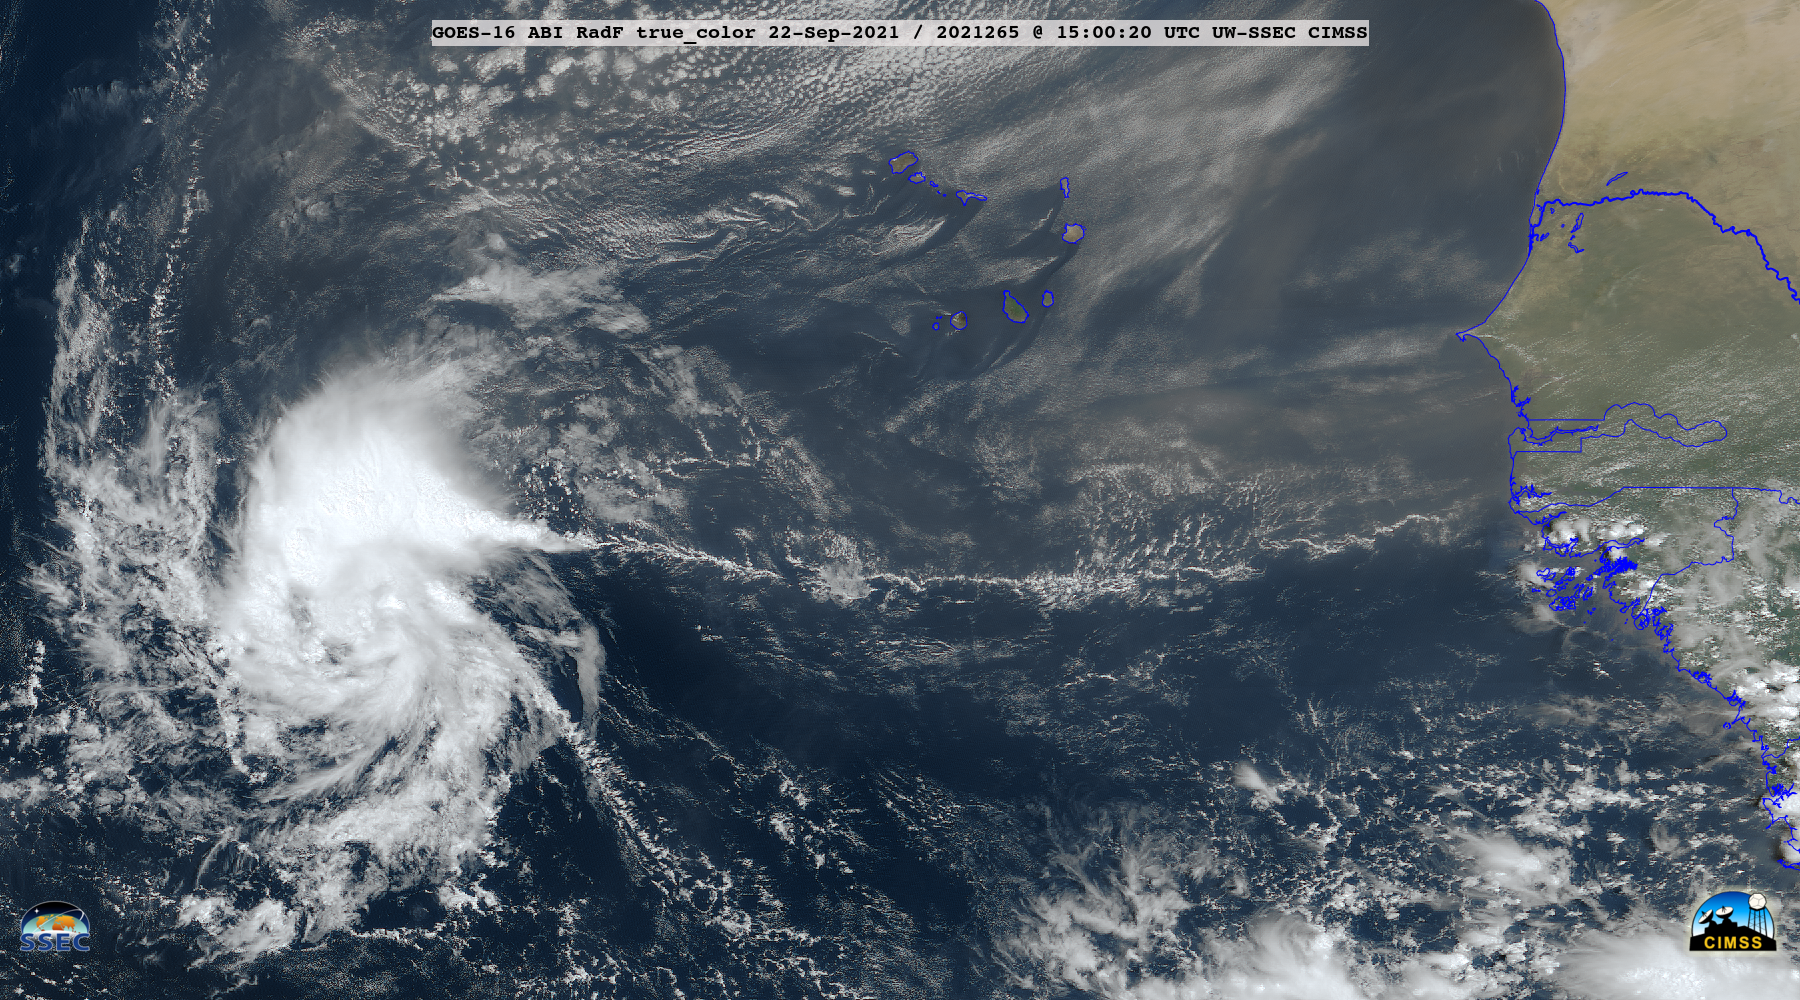
Tropical Storm Sam is poised to strengthen in the tropical Atlantic. The True-Color image above shows the cyclone just to the south of a region of dust that is apparent in the true-color imagery as a greyish/brown region extending from the storm towards Africa. A Saharan Air Layer (SAL) analysis,... Read More
GOES-16 True-Color Imagery over the tropical Atlantic Ocean showing Tropical Sam, 1810 UTC on 23 September 2021 (Click image to view in CSPP Geosphere)
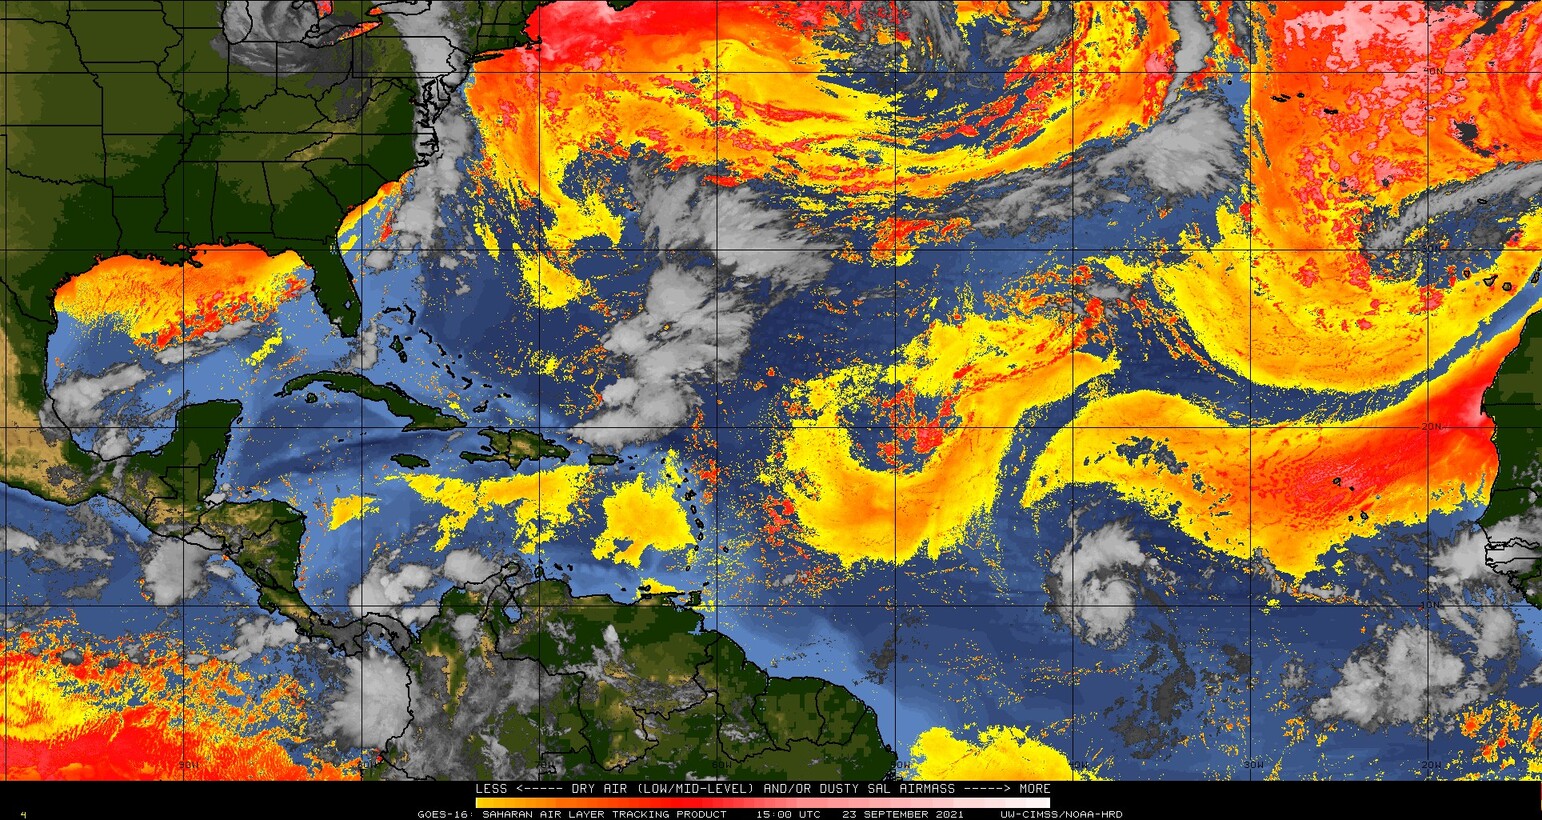
Tropical Storm Sam is poised to strengthen in the tropical Atlantic. The True-Color image above shows the cyclone just to the south of a region of dust that is apparent in the true-color imagery as a greyish/brown region extending from the storm towards Africa. A Saharan Air Layer (SAL) analysis, below (from this site), also shows this region of dry air to the east of the storm. Sam is not projected to be influenced by the dry air that is following it.
Saharan Air Layer analysis, 1500 UTC on 23 September 2021 (Click to enlarge)
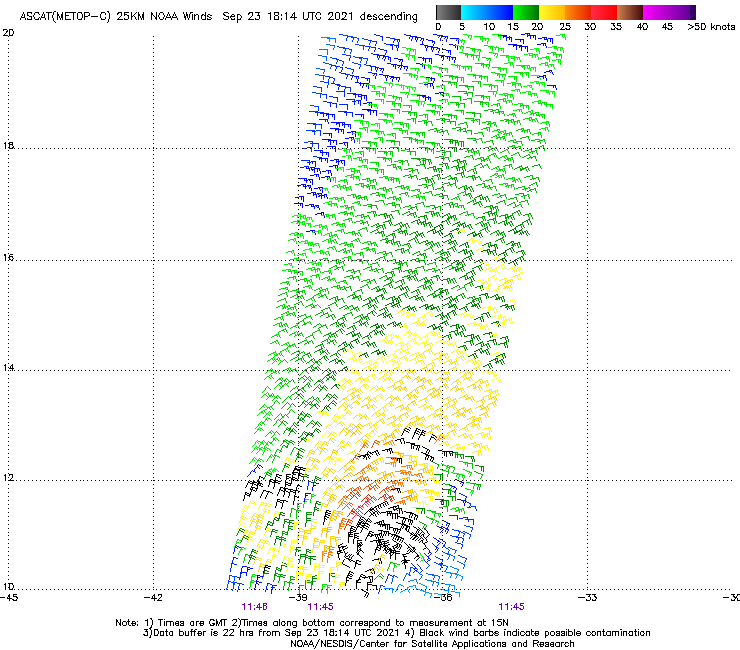
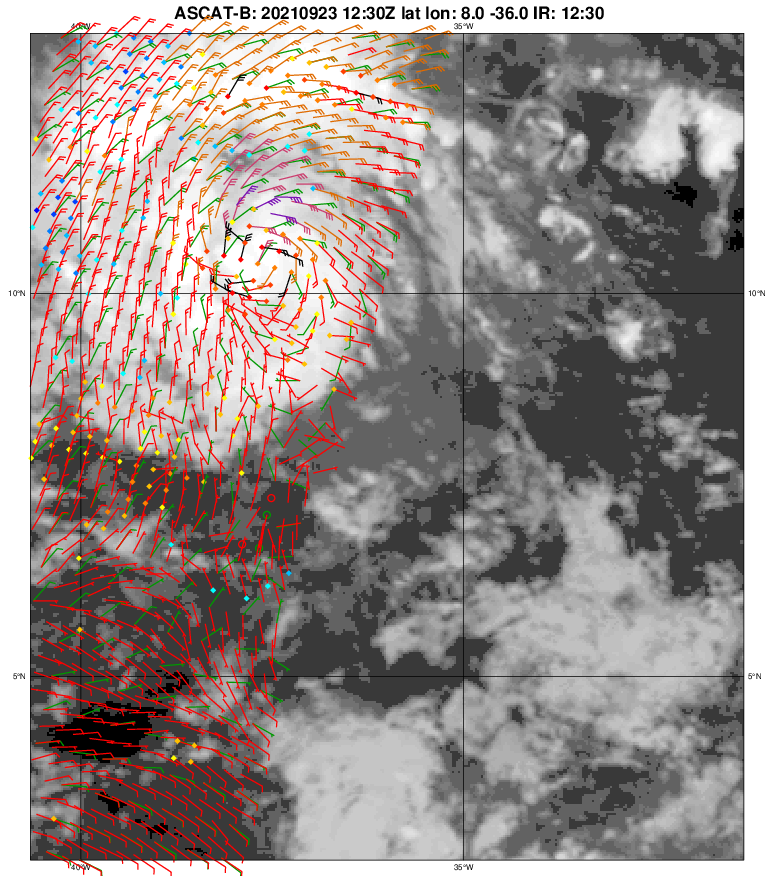
Both 200-850 mb shear and SSTs, shown in a toggle below, will not inhibit strengthening. Shear is weak, and waters are warm. An ASCAT pass from MetopC shortly before 1200 UTC on 23 September (from this NOAA OSPO site) is shown here. A slightly later pass from MetopB (from the OSI SAF site) is shown here.
Sea-surface temperatures at 1200 UTC on 23 September 2021, and 200-850 mb shear at 1600 UTC on 23 September 2021 (Click to enlarge)
The National Hurricane Center projects Sam to become a Major Hurricane. Refer to the National Hurricane Center for more information.
GOES-16 “Veggie Band” near-infrared imagery (Band 3, 0.86 µm), above, (from the CSPP Geosphere website, click here for a link to the animation at that website) shows an early-season Fall cyclone over lower Michigan. During the animation, RADARSAT Constellation Mission Satellite 1 (RCM-1) was in a descending pass down Lake Michigan. Synthetic... Read More
GOES-16 Band 3 (0.86 µm) imagery at sunrise (1151 – 1246 UTC) on 23 September 2021
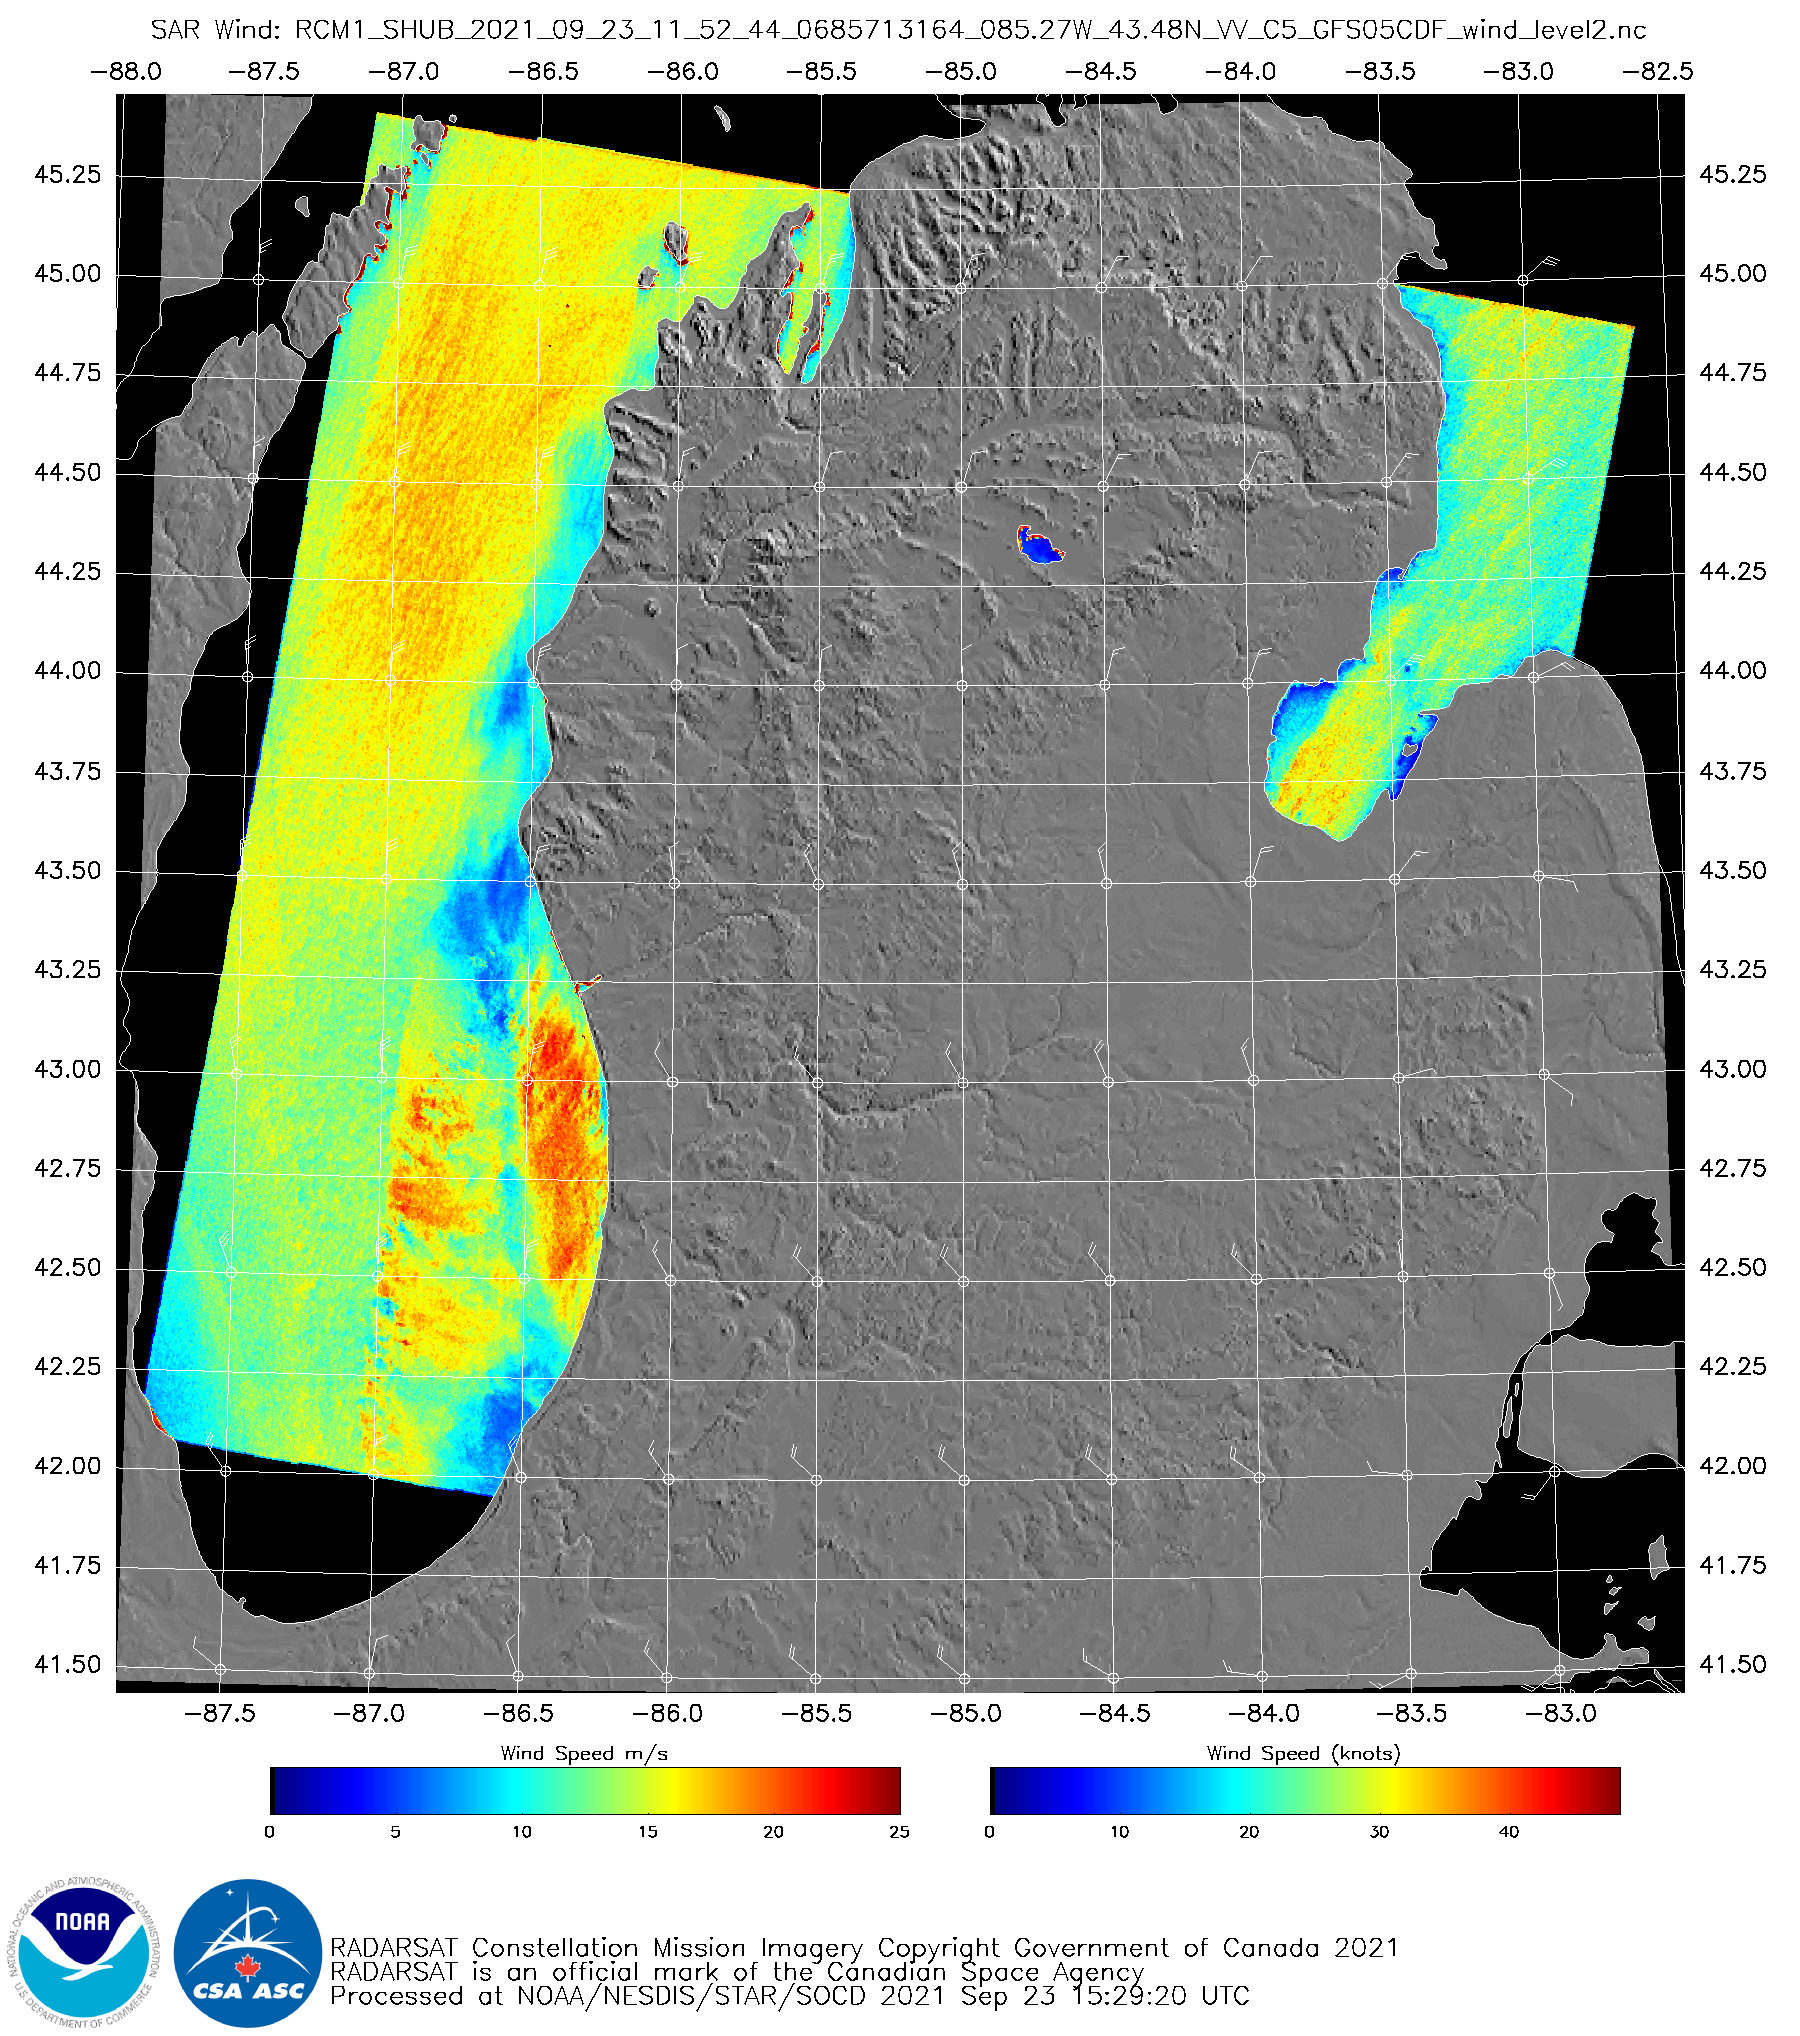
GOES-16 “Veggie Band” near-infrared imagery (Band 3, 0.86 µm), above, (from the CSPP Geosphere website, click here for a link to the animation at that website) shows an early-season Fall cyclone over lower Michigan. During the animation, RADARSAT Constellation Mission Satellite 1 (RCM-1) was in a descending pass down Lake Michigan. Synthetic Aperture Radar winds from that satellite (from this website) produced a complex windfield over extreme eastern Lake Superior (just before 1152 UTC) and over Lake Michigan (just before 1153 UTC), as shown below.
SAR-derived winds from RCM1, 1151-1153 UTC on 23 September 2021 (Click to enlarge)
It is interesting to consider the influence of prominences along the western shore of lower Michigan, such as Big Sable and Little Sable points, as well as Sleeping Bear Dunes on the distribution of winds. There seems to be lighter winds in the lee of those regions in this northerly wind regime. Also, consider the wind funneling through outlets over Lake Huron, and being blocked by the islands in northern Lake Michigan.
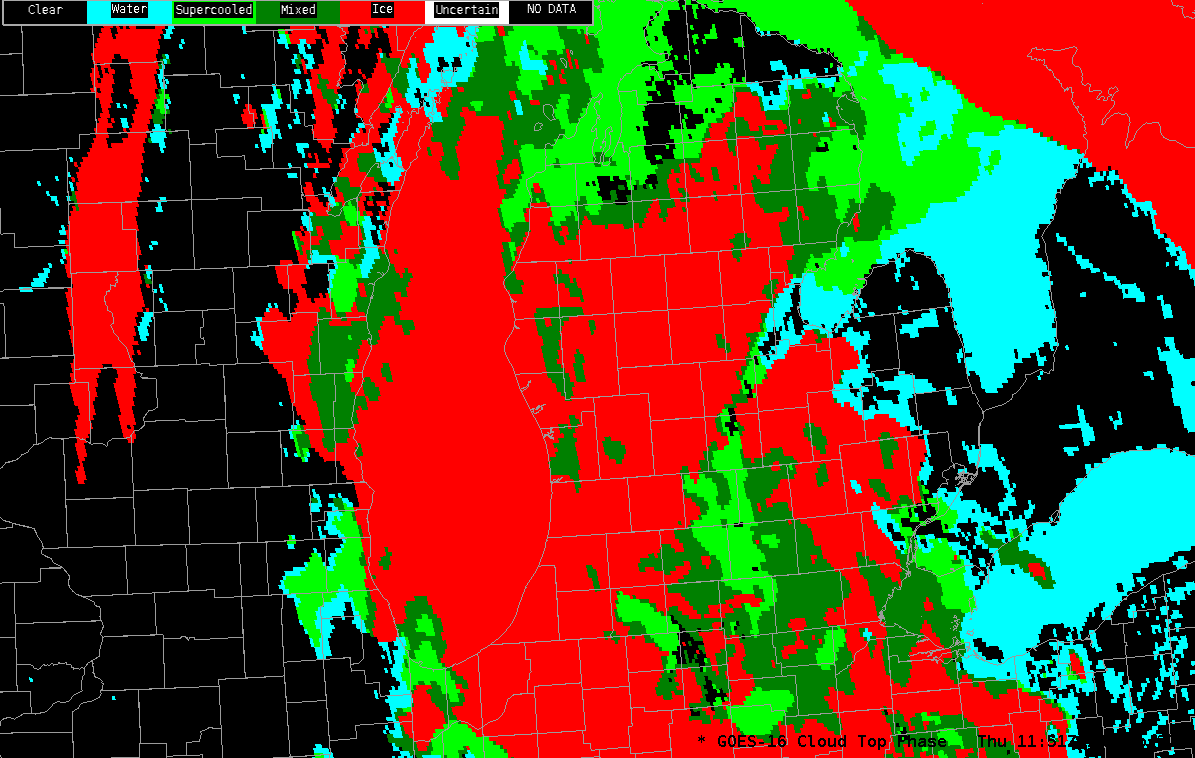
SAR winds are affected by ice in clouds. That might be the cause of the very strong winds indicated to be just offshore or southwestern lower Michigan, and over the Lake Michigan south of 43 N and east of 87 W. GOES-16 Cloud-top phase does show ice over the entire Lake, as shown below.
GOES-16 Cloud Top Phase, 1151 UTC on 23 September 2021 (Click to enlarge)National Data Buoy Center buoy locations over the western Great Lakes (click to enlarge)
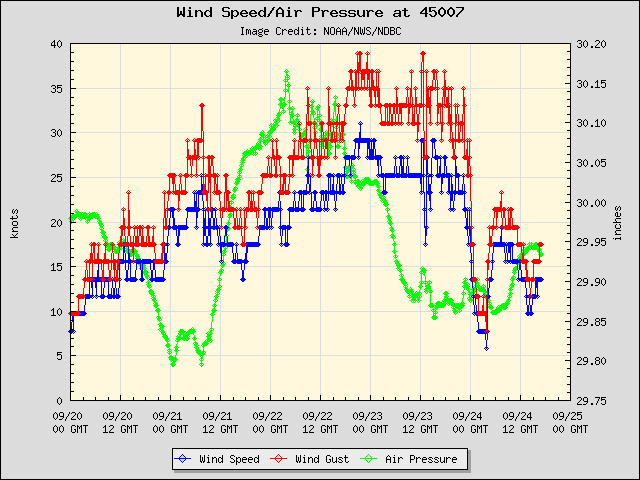
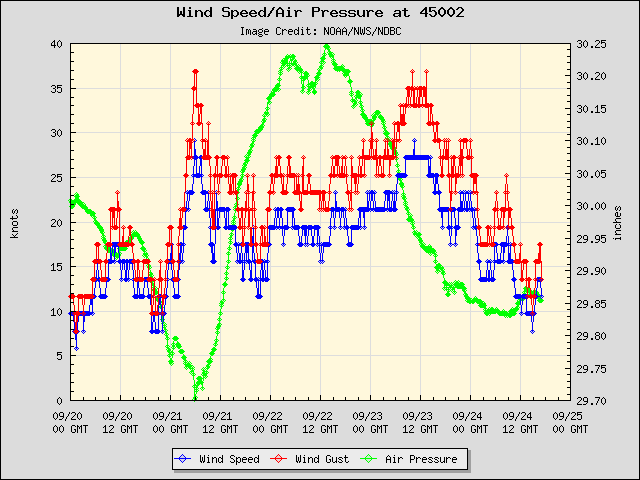
The National Data Buoy Center oversees a large portfolio of moored buoys (and C-MAN sites) that monitor the winds, and these buoys can be used to see how the SAR winds compare to observations. For example, the winds at buoy 45007 around 1100 UTC on 23 September, as shown in the plot below, were around 25 knots with gusts to almost 35 knots.
Winds at NDBC Buoy 45007. The SAR winds above shows values near 1200 UTC On 23 SeptemberWinds at NDBC Buoy 45002. The SAR winds above shows values near 1200 UTC On 23 September
Winds at buoy 45002 (above) peaked at around 1200 UTC: 27 knots with gusts to 35 knots.
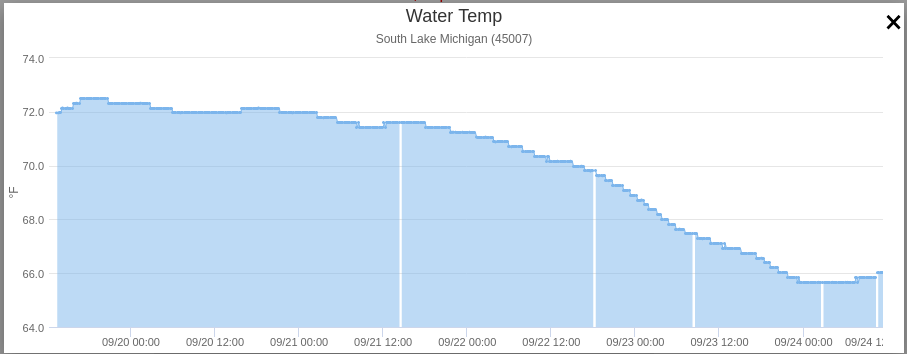
Strongs winds in early Autumn act to cool the lake. The Lake Surface Temperature plot, below, from this site, shows the cooling at buoy 45007 that occurred with the winds.
Lake Surface temperatures, 20-24 September 2021 (Click to enlarge)
GOES-16 (GOES-East) True Color RGB images created using Geo2Grid (above) showed a long rope cloud feeding into the western portion of Tropical Invest 98L in the eastern Atlantic Ocean on 22 September 2021. The rope cloud was located near the African Monsoon Trough (12 UTC surface analysis), and north of the rope cloud the hazy appearance of... Read More
GOES-16 True Color RGB images [click to play animation | MP4]
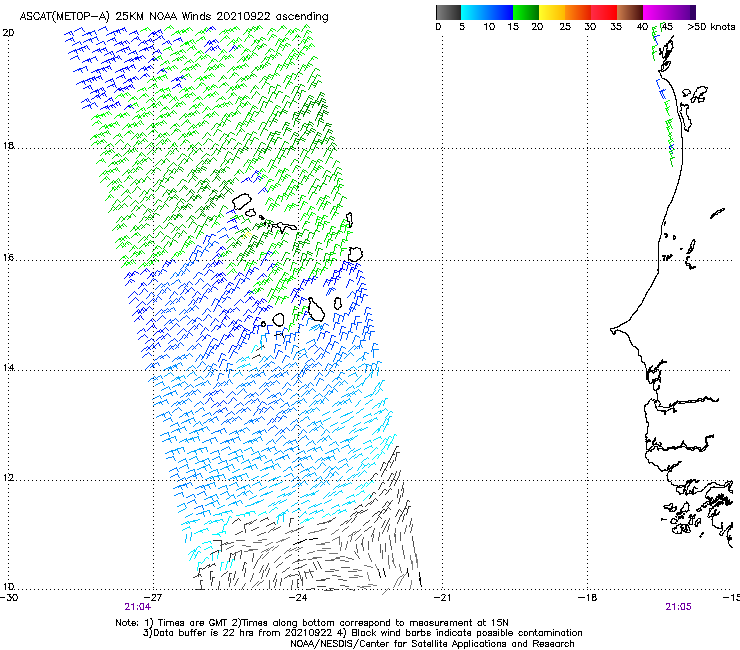
GOES-16 (GOES-East) True Color RGB images created using Geo2Grid(above) showed a long rope cloud feeding into the western portion of Tropical Invest 98L in the eastern Atlantic Ocean on 22 September 2021. The rope cloud was located near the African Monsoon Trough (12 UTC surface analysis), and north of the rope cloud the hazy appearance of a dust-laden Saharan Air Layer was apparent — so this rope cloud feature likely marked the boundary between dry SAL air to the north and moist tropical air to the south (as seen in the MIMIC Total Precipitable Water product). In addition, Metop-A ASCAT surface scatterometer winds at 0956 UTC and 2104 UTC showed speed and/or directional convergence in the vicinity of the rope cloud (between 10-15 N latitude). Also of interest was the effect of the Cabo Verde islands on marine boundary layer clouds beneath the SAL. On the following day, Invest 98L intensified to become Tropical Storm Sam, as discussed in this blog post.
The hazy Saharan Air Layer was also seen in a Suomi NPP VIIRS True Color image at 1439 UTC, as visualized using RealEarth(below). The west-to-east oriented rope cloud was located around 11-12 N latitude.
VIIRS True Color RGB image from Suomi NPP [click to enlarge]
The “Saharan Air Layer” (SAL) Split Window Difference product from the CIMSS Tropical Cyclones site (below) depicted the westward advance of the dusty SAL air off northwestern Africa.
GOES-16 “Saharan Air Layer” Split Window Difference product [click to play animation]
Suomi NPP Day Night imagery, in a toggle above with infrared imagery from GOES-16, (both displayed in RealEarth) depicts a classic sheared Tropical Cyclone structure to the east-northeast of the Caribbean Sea. The low-level circulation (very apparent in the nighttime visible imagery under the illumination of a near-full moon) is... Read More
Suomi NPP Day Night Band visible (0.7 µm) imagery and GOES-16 infrared (10.3 µm) imagery, 0620 UTC on 20 September 2021 (Click to enlarge)
Suomi NPP Day Night imagery, in a toggle above with infrared imagery from GOES-16, (both displayed in RealEarth) depicts a classic sheared Tropical Cyclone structure to the east-northeast of the Caribbean Sea. The low-level circulation (very apparent in the nighttime visible imagery under the illumination of a near-full moon) is displaced to the west of the deep convection near the edge of this Suomi NPP scan. Indeed, the low-level circulation is difficult to discern in the single enhanced infrared image (animation better reveals its structure however). An earlier (0527 UTC) overpass from NOAA-20, below (VIIRS imagery courtesy William Straka, CIMSS), also shows the circulation to the west of the main convection. It would be a challenge to locate correctly the storm center based solely on the VIIRS infrared imagery!
NOAA-20 VIIRS I05 (11.5 µm) and Day Night Band Visible (0.7 µm) imagery at 0527 UTC on 20 September 2021 (Click to enlarge)
The shear that is disrupting TS Peter’s structure is shown below (imagery from the SSEC Tropical website), overlain on top of 1-km visible imagery at 1300 UTC.
GOES-16 Visible (0.64 µm) Imagery, 1300 UTC, along with an analysis of 200-850 mb wind shear (Click to enlarge)
For more information on struggling Tropical Storm Peter, visit the website of the National Hurricane Center.

