
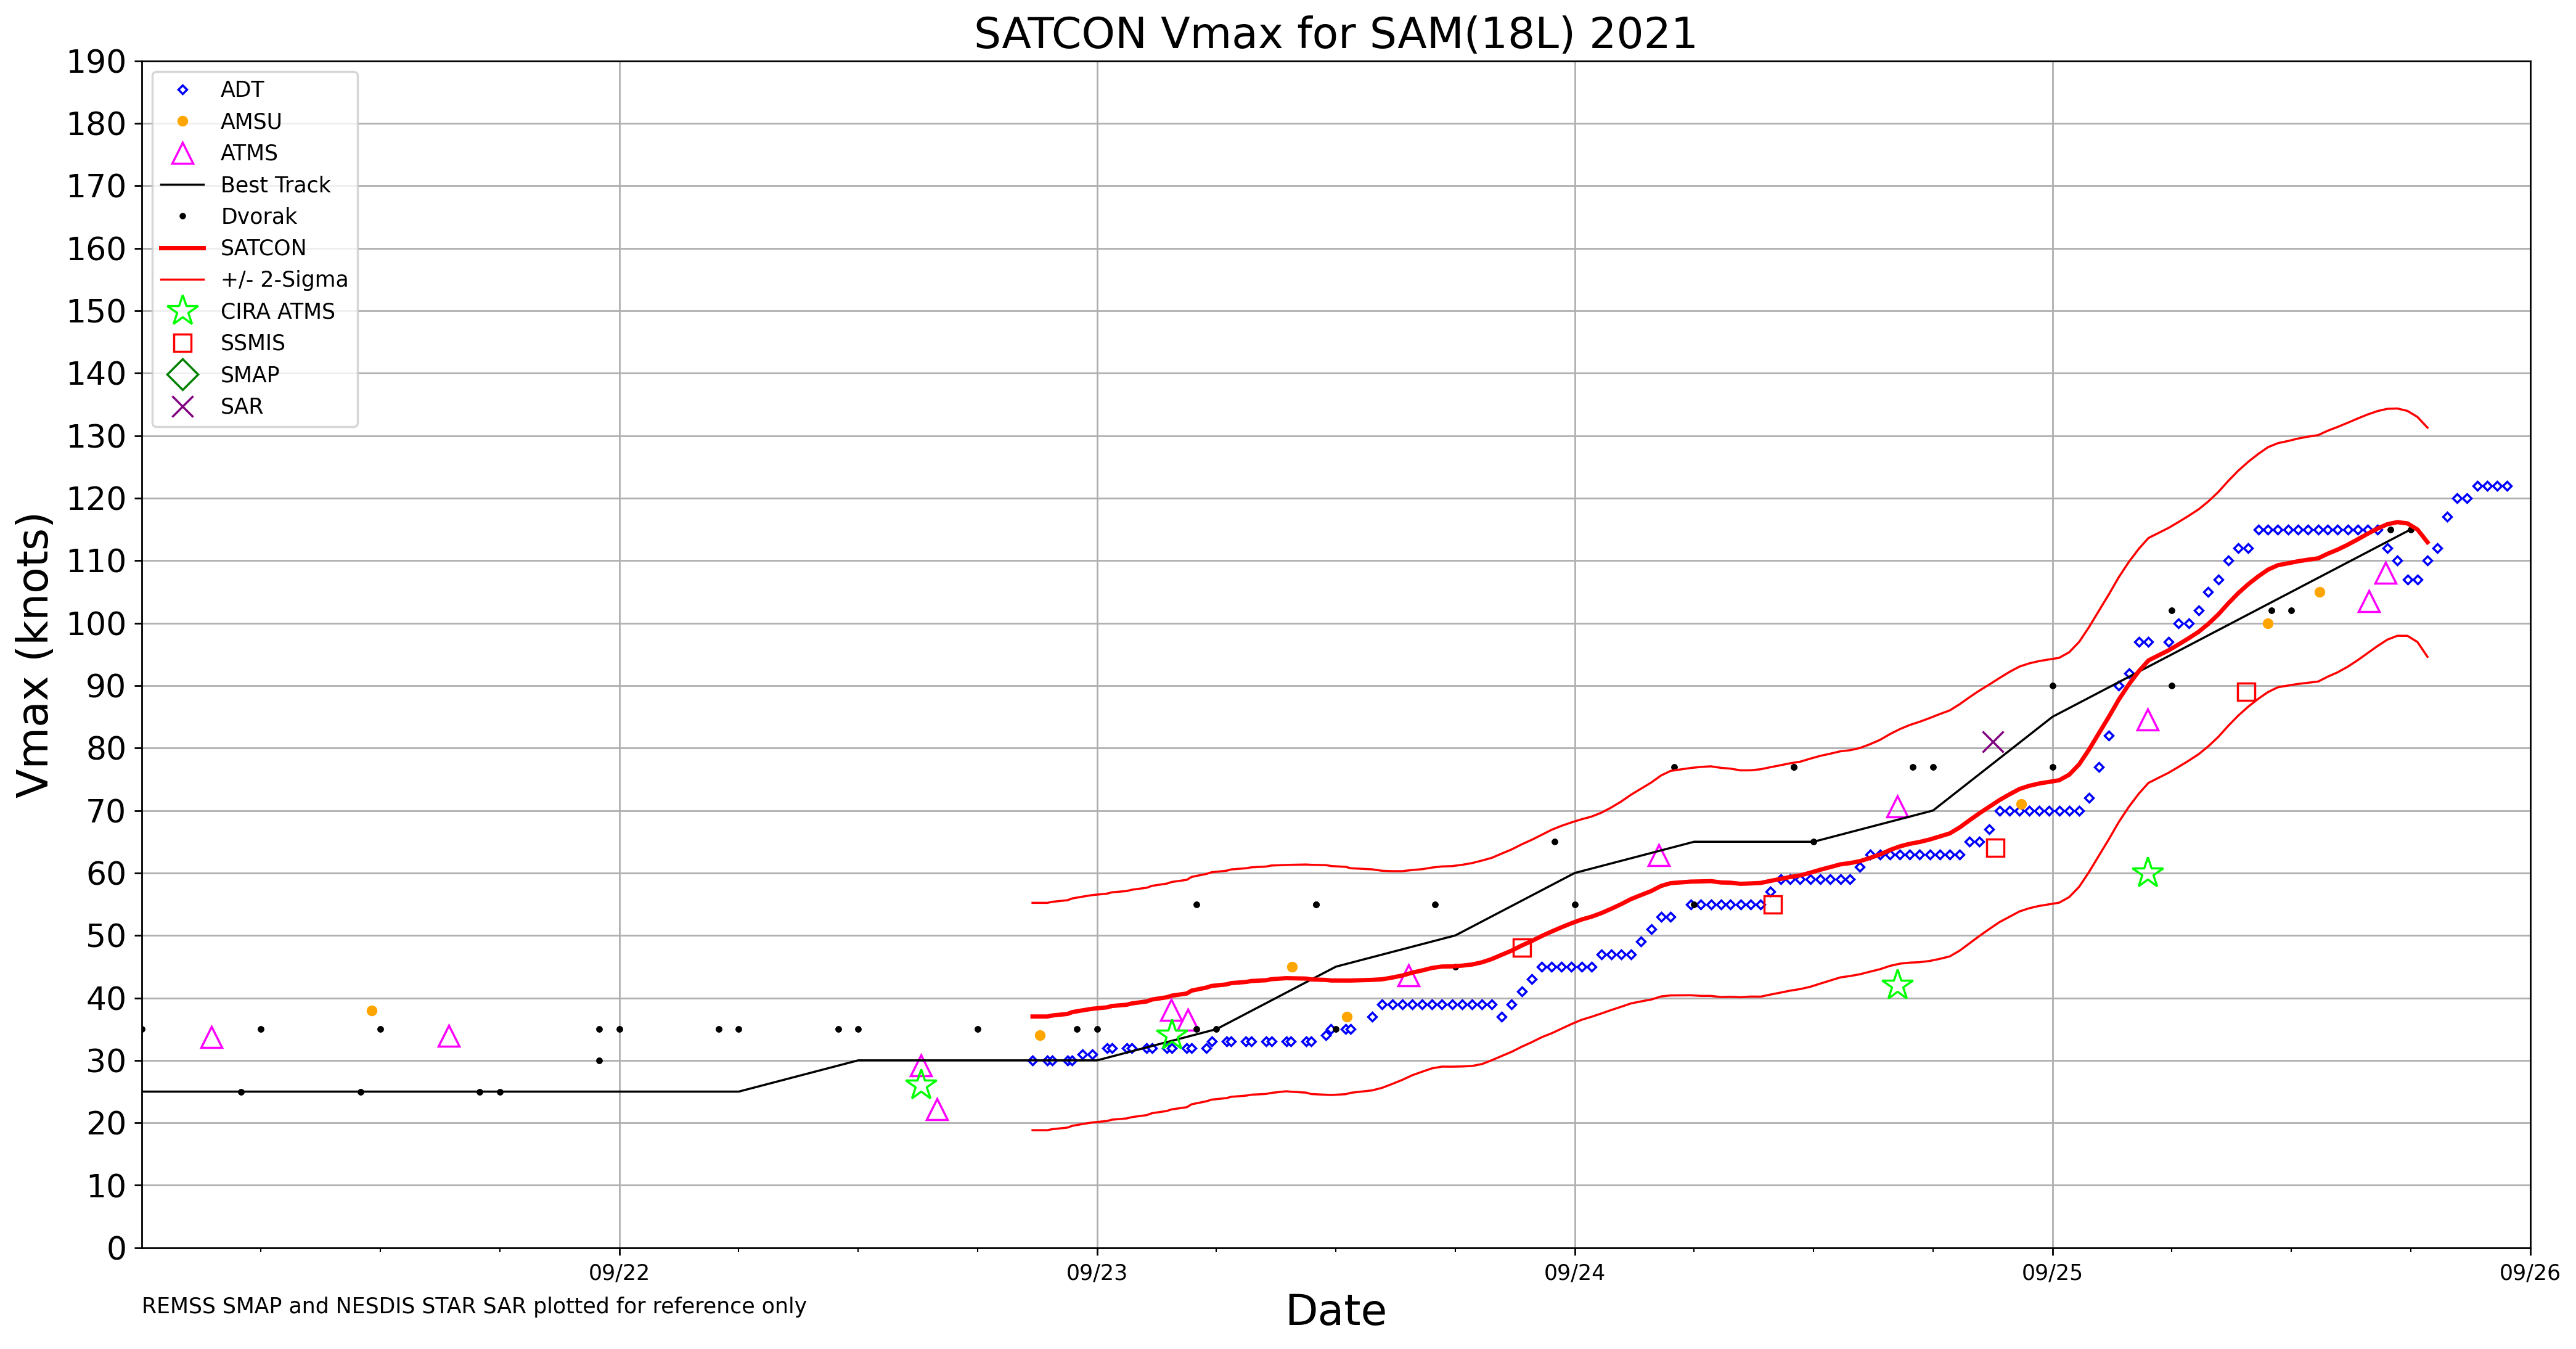
1–minute Mesoscale Domain Sector GOES-16 (GOES-East) “Red” Visible (0.64 µm) and “Clean” Infrared Window (10.35 µm) images (above) showed Hurricane Sam as it intensified from a Category 3 to a Category 4 storm (ADT | SATCON) in the central Atlantic Ocean on 25 September 2021. The eye became cloud-filled during the middle portion of... Read More
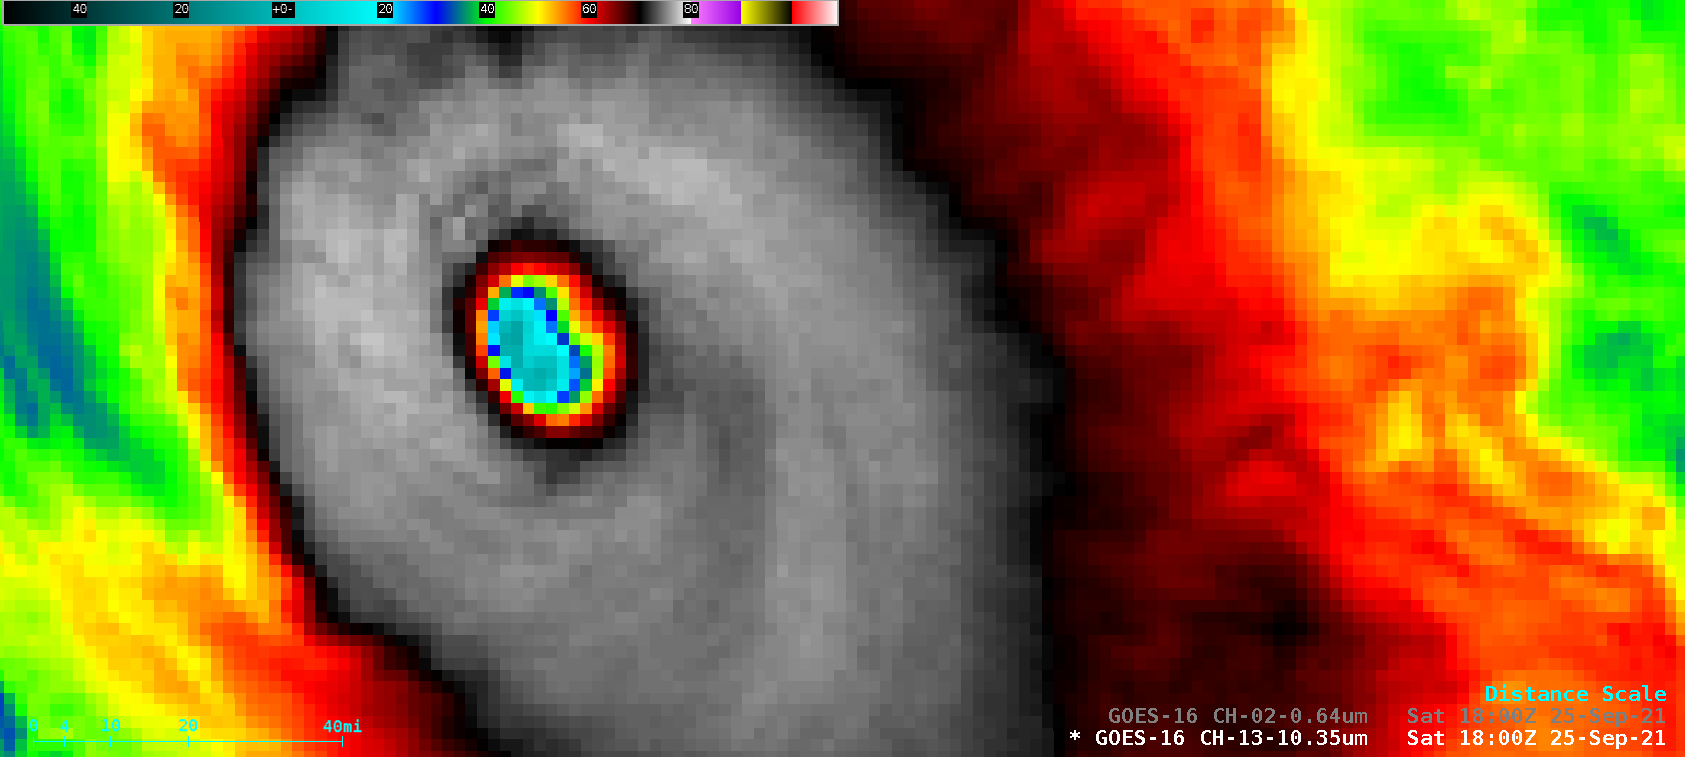
GOES-16 “Red” Visible (0.64 µm) and “Clean” Infrared Window (10.35 µm) images [click to play animation | MP4]
1–minute Mesoscale Domain Sector GOES-16 (GOES-East) “Red” Visible (0.64 µm) and “Clean” Infrared Window (10.35 µm) images (above) showed Hurricane Sam as it intensified from a Category 3 to a Category 4 storm (ADT | SATCON) in the central Atlantic Ocean on 25 September 2021. The eye became cloud-filled during the middle portion of the day, but Visible images revealed the presence of mesovortices within the eye both early and late in the day.
A DMSP-16 SSMIS Microwave (85 GHz) image at 1918 UTC from the CIMSS Tropical Cyclones site (below) displayed a fully closed eyewall, with several spiral bands wrapping inward toward the storm center.
DMSP-16 SSMIS Microwave (85 GHz) image at 1918 UTC [click to enlarge]
GOES-16 Infrared images with an overlay of deep-layer wind shear at 2200 UTC (below) indicated that Sam was in an environment of low shear — which favored intensification as the hurricane moved across relatively warm water (SST | OHC).
GOES-16 Infrared images, with an overlay of deep-layer wind shear at 2200 UTC [click to enlarge]
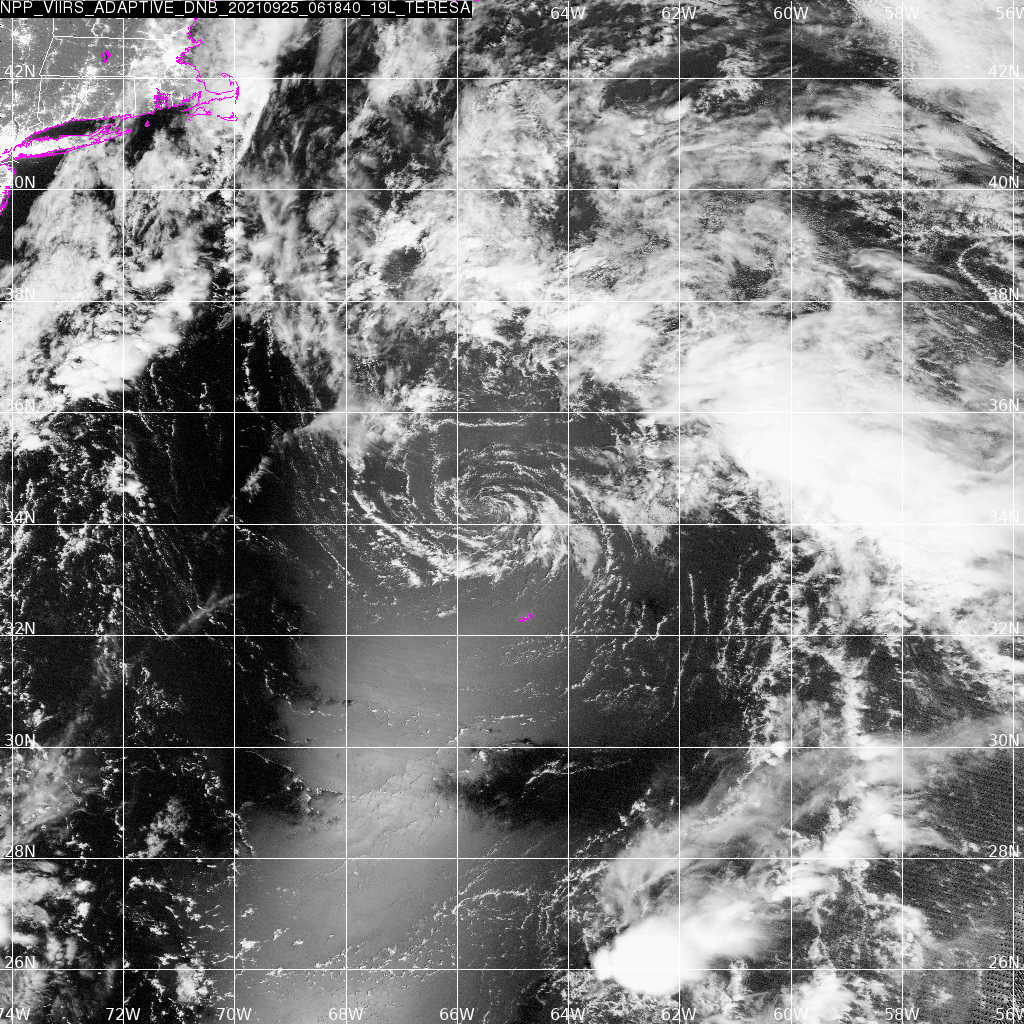
During the following nighttime hours, ample illumination from the Moon — which was in the Waning Gibbous phase, at 81% of Full — provided a “visible image at night” using the Suomi NPP VIIRS Day/Night Band (0.7 µm) (below).

Suomi NPP VIIRS Day/Night Band (0.7 µm) image [click to enlarge]
===== 26 September Update =====
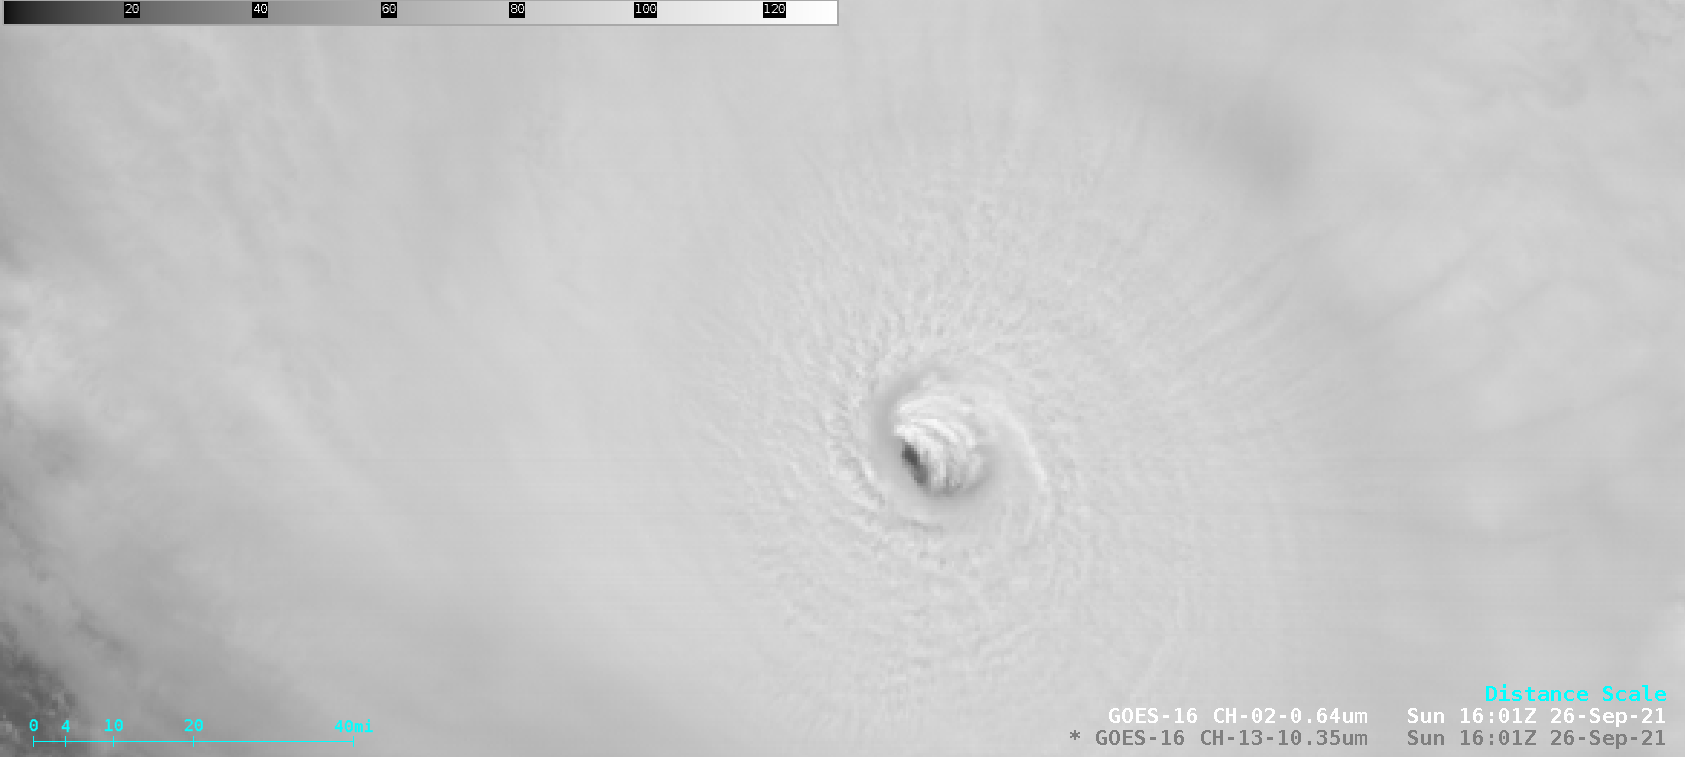
GOES-16 “Red” Visible (0.64 µm) and “Clean” Infrared Window (10.35 µm) images [click to play animation | MP4
On the following day, Sam exhibited a similar appearance on 1-minute GOES-16 Infrared and Visible images (above), with a small 7-15 mile diameter eye (containing mesovortices, as seen in Visible imagery). Both Infrared and Visible images revealed repeated pulses of gravity waves propagating away from the storm center. Sam’s intensity peaked at 135 knots late in the day (NHC advisory).
1-minute GOES-16 Visible images with plots of corresponding GLM Flashes (below) showed that Sam exhibited an Enveloped Eyewall Lightning signature (reference).
1-minute GOES-16 “Red” Visible (0.64 µm) images, with 1-minute GLM Flashes plotted in red [click to play animation | MP4]
===== 30 September Update =====
GOES-16 “Red” Visible (0.64 µm) images (credit: Tim Schmit, NOAA/NESDIS/ASPB) [click to play animation | MP4]
Sam was still a Category 4 hurricane on 30 September — and GOES-16 Visible images (above) showed that Sam exhibited a relatively compact eye, with hints of mesovortices within the eye.
View only this post
Read Less


