
GOES-16 “Red” Visible (0.64 µm), Near-Infrared “Snow/Ice” (1.61 µm) and Day Snow-Fog RGB images [click to play animated GIF | MP4]
In a sequence of GOES-16 (GOES-East) “Red” Visible (0.64 µm), Near-Infrared “Snow/Ice” (1.61 µm) and Day Snow-Fog RGB images (above), areas that received a significant accretion of ice — via sleet and/or freezing rain/drizzle from a significant winter storm — appeared as darker shades of gray to black in the 1.61 µm images and as darker shades of red in the RGB images on 04 February 2022.
A toggle between Suomi-NPP VIIRS Visible (0.64 µm) and Near-Infrared (1.61 µm) is shown below, and provided a higher-resolution view of the darker ice accretion signature at 1942 UTC.

Suomi-NPP VIIRS Visible (0.64 µm) and Near-Infrared (1.61 µm) images [click to enlarge]
===== 05 Februray Update =====

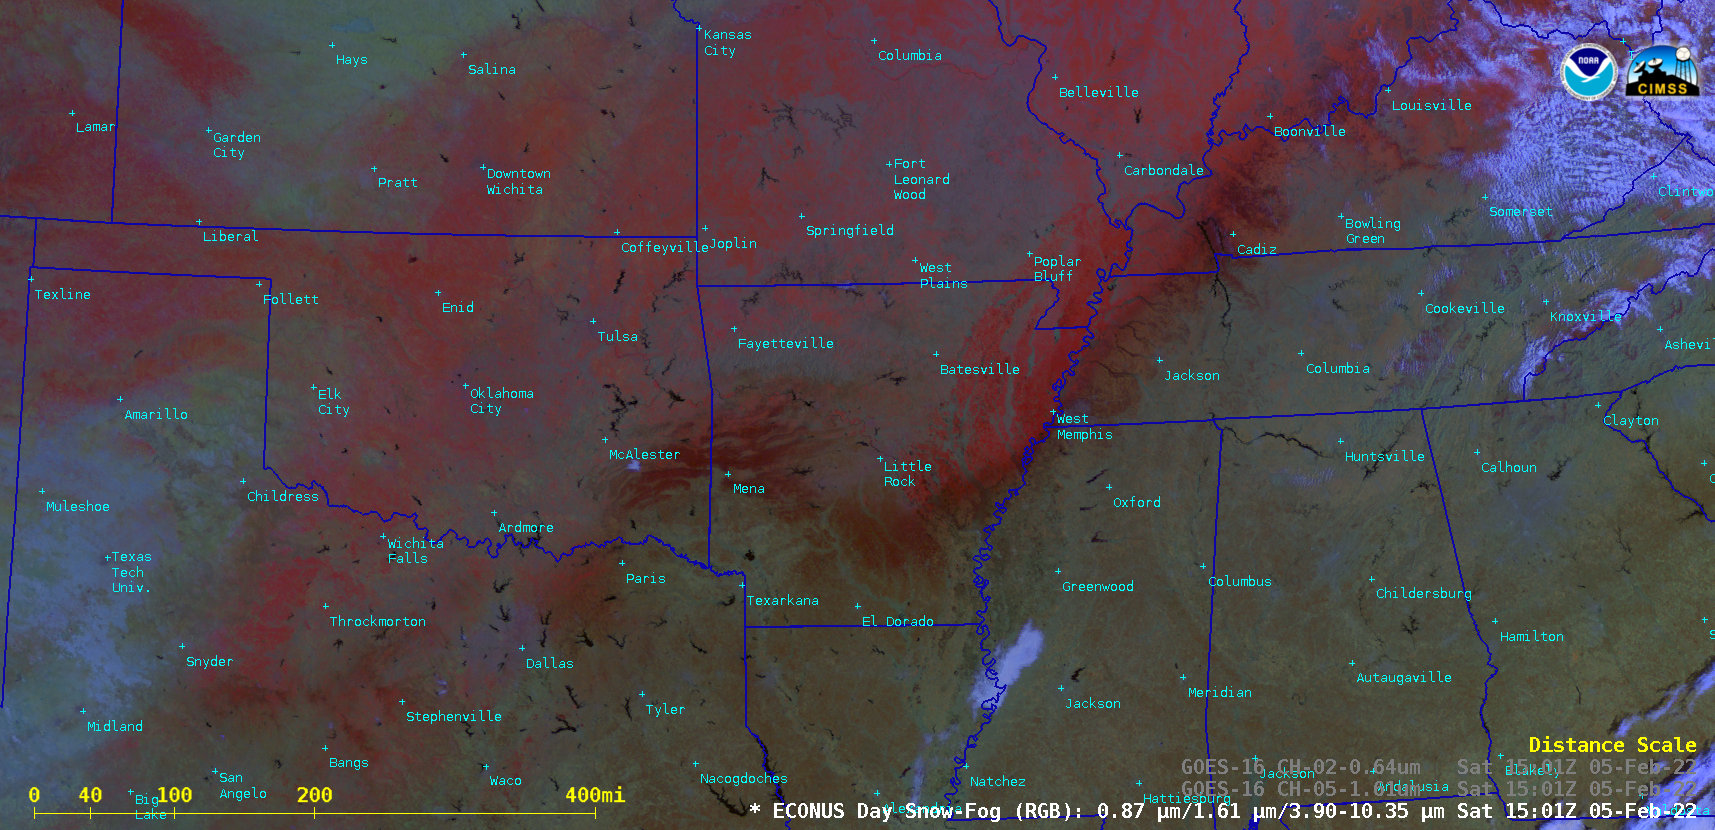
GOES-16 “Red” Visible (0.64 µm), Near-Infrared “Snow/Ice” (1.61 µm) and Day Snow-Fog RGB images [click to play animated GIF |MP4]
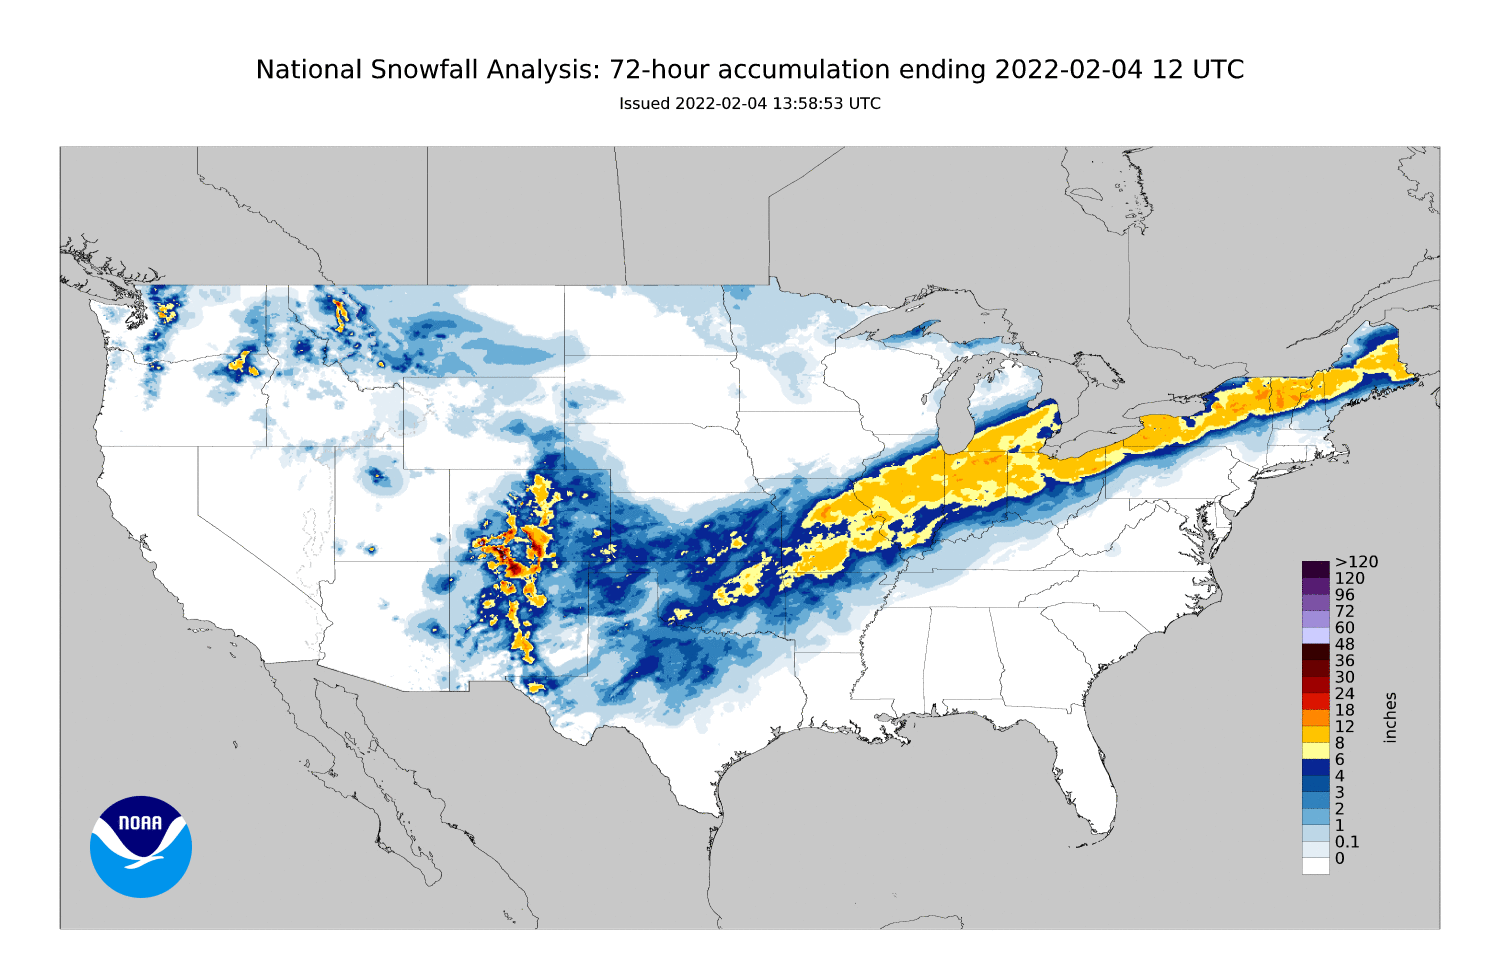
On the following day, clouds had cleared from much of the central US — enabling the areal coverage of this ice accretion signature to be seen across parts of Texas, Oklahoma, Arkansas, Tennessee, Kentucky (above). A comparison of GOES-16 “Red” Visible, Near-Infrared “Snow/Ice” and Day Snow-Fog RGB images at 1501 UTC (below) showed how this darker ribbon of ice accretion was located along the southern edge accumulating snowfall produced by the winter storm.
GOES-16 “Red” Visible (0.64 µm), Near-Infrared “Snow/Ice” (1.61 µm) and Day Snow-Fog RGB images at 1501 UTC [click to enlarge]
A closer view centered on the Missouri-Illinois-Kentucky-Tennessee border region (below) showed (1) the subtle effects of topography on resultant snow/ice accumulation, and (2) the darker appearance on Snow/Ice and RGB images in some areas that appeared to be bare ground in the Visible images (due to the clear/translucent nature of any sleet and/or freezing rain on the surface). Unfortunately, a portion of that satellite scene was also affected by a major tornado outbreak about 2 months prior to this winter storm.
GOES-16 “Red” Visible (0.64 µm), Near-Infrared “Snow/Ice” (1.61 µm), Day Snow-Fog RGB and Topography images at 1501 UTC [click to enlarge]
View only this post Read Less


