This website works best with a newer web browser such as Chrome, Firefox, Safari or Microsoft
Edge. Internet Explorer is not supported by this website.
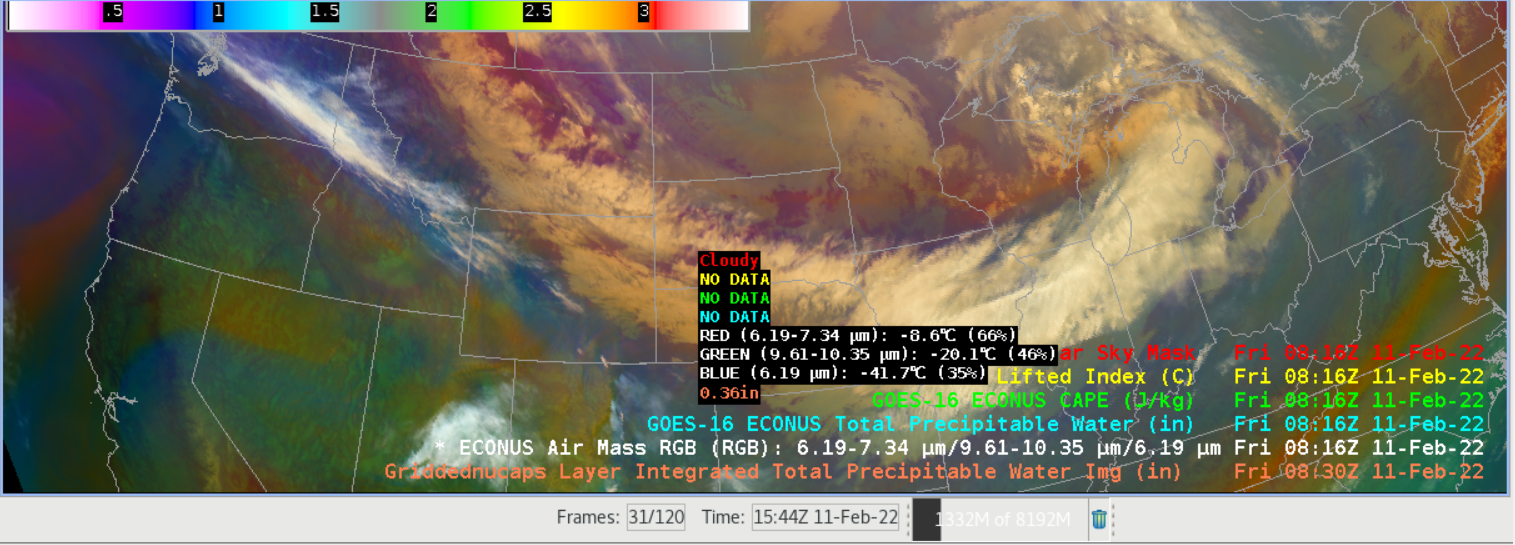
This presentation from the TOWR-S Satellite Book Club details TOWR-S RPM 22 additions to AWIPS (additions spearheaded by Tim Schmit and Bill Line, both from NOAA/STAR) that add Level 2 product readouts to RGBs in AWIPS. Thus, for example, the Airmass RGB, above, is underlain by Level 2 products: Cloud Mask and Total Precipitable Water (TPW) and... Read More
GOES-16 Air Mass RGB loaded with Level 2 products: Clear Sky Mask, Lifted Index, CAPE and Total Precipitable Water, ca. 0816 UTC on 11 Feb 2022, with Gridded NUCAPS estimates of TPW at 0830 UTC (Click to enlarge)
This presentation from the TOWR-S Satellite Book Club details TOWR-S RPM 22 additions to AWIPS (additions spearheaded by Tim Schmit and Bill Line, both from NOAA/STAR) that add Level 2 product readouts to RGBs in AWIPS. Thus, for example, the Airmass RGB, above, is underlain by Level 2 products: Cloud Mask and Total Precipitable Water (TPW) and Level 2 Stability Indices (CAPE and Lifted Index). Those Level 2 products are all clear-sky only, however, so sampling in cloudy regions will not yield level 2 product information.
Adding Gridded NUCAPS fields (in the example above and below, total precipitable water has been added; one could also add CAPE and Lifted Index), is an effective way of including estimates of atmospheric thermodynamics in clear and cloudy regions that can then be sampled, as shown below with two sampling examples, one each in clear and cloudy skies. The sampling location is just northwest of the Clear Sky Mask value (i.e., the screen capture did not capture the cursor).
Sampled values over an Airmass RGB at 0816 UTC, including Gridded NUCAPS TPW at 0830 UTC, 11 February 2022 (Click to enlarge)
An efficient way to load these data in AWIPS is via a procedure. The augmented RGB loads are part of TOWR-S RPM 22.
Suomi-NPP VIIRS Visible (0.64 µm) images (above) revealed numerous cloud plumes that were emanating from natural gas flaring sources at oil drilling sites across the North Slope of Alaska on 08 February 2022. Surface air temperatures were around -50°F in that area, with Deadhorse setting a daily record low of -53°F.A sequence of Suomi-NPP... Read More
Suomi-NPP VIIRS Visible (0.64 µm) images [click to enlarge]
Suomi-NPP VIIRS Visible (0.64 µm) images (above) revealed numerous cloud plumes that were emanating from natural gas flaring sources at oil drilling sites across the North Slope of Alaska on 08 February 2022. Surface air temperatures were around -50°F in that area, with Deadhorse setting a daily record low of -53°F.
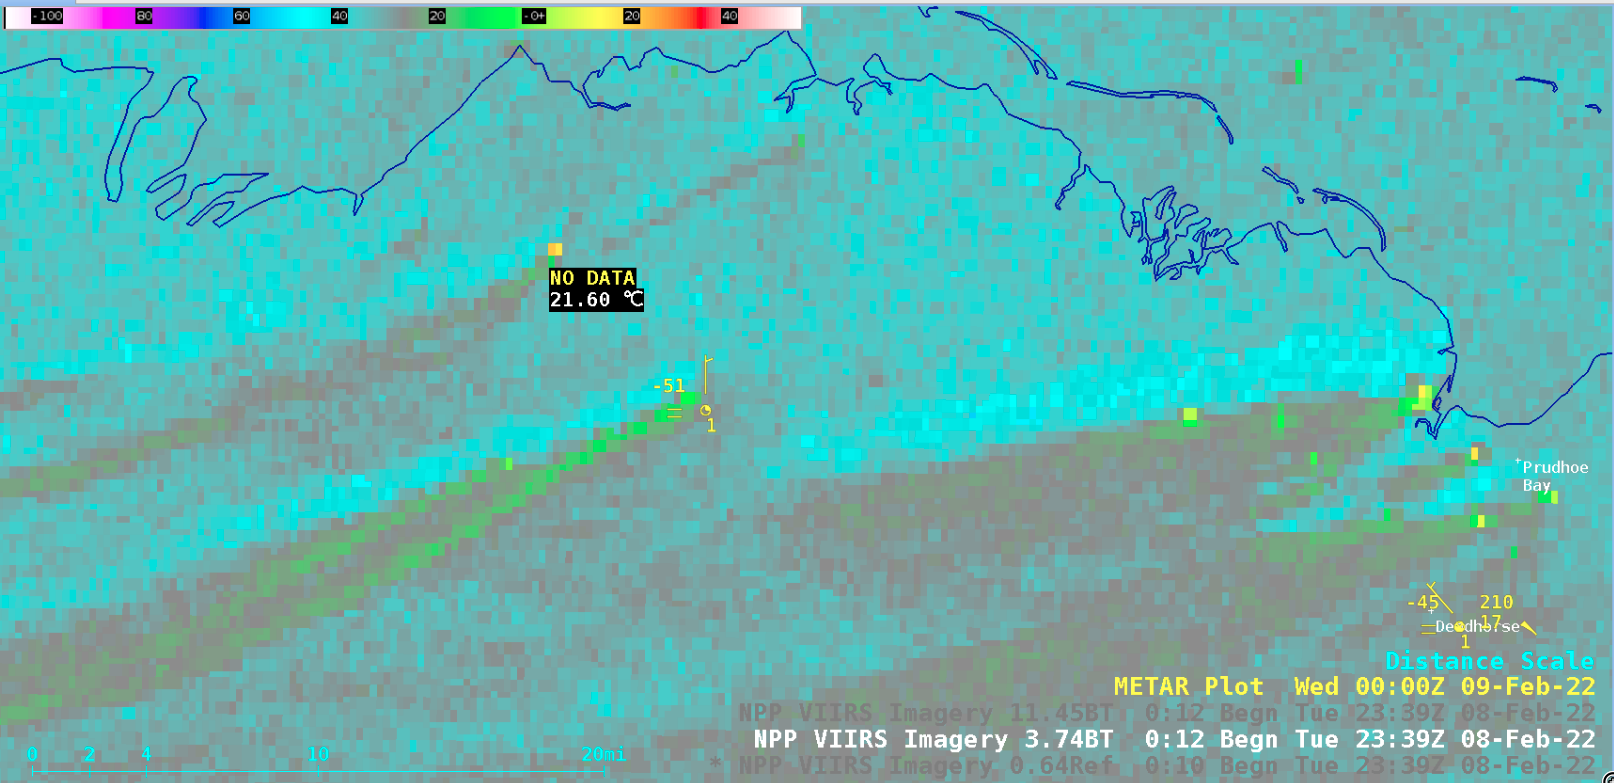
A sequence of Suomi-NPP VIIRS Visible (0.64 µm), Shortwave Infrared (3.74 µm) and Infrared Window (11.45 µm) images is shown below. The cloud plumes appeared significantly warmer in the 3.74 µm images due to reflected incoming solar radiation — and warmer in the 11.45 µm images since those cloud tops were located within the warmer air aloft of a pronounced boundary layer temperature inversion (00 UTC Utqiagvik/Barrow rawinsonde plot | text).
Suomi-NPP VIIRS Visible (0.64 µm), Shortwave Infrared (3.74 µm) and Infrared Window (11.45 µm) images [click to enlarge]
A closer view of the Suomi-NPP VIIRS Shortwave Infrared image at 2339 UTC (below) included a cursor readout, which indicated gas flaring point source infrared brightness temperatures as warm as +21.6°C (orange pixels).
Suomi-NPP VIIRS Shortwave Infrared (3.74 µm) image at 2339 UTC [click to enlarge]
In a sequence of nighttime to dawn VIIRS Day/Night Band (0.7 µm) and daytime False Color RGB images from NOAA-20 and Suomi-NPP visualized using RealEarth(below), a larger/brighter gas flaring signature was evident about 4 hours prior to sunrise at the point source of the cloud plumes (intermingled with numerous smaller flaring signatures).
VIIRS Day/Night Band (0.7 µm) and False Color RGB images from NOAA-20 and Suomi-NPP [click to enlarge]
VIIRS Day Land Cloud RGB, 2106 UTC on 8 February, and Day Night Band at 1552 UTC on 9 February 2022 (Click to enlarge). Imagery courtesy Carl Dierking, UA-Fairbanks/GINA
Carl Dierking from GINA at the University of Alaska Fairbanks noted this event as well, discussed here. The toggle above compares a VIIRS Day Land Cloud RGB and a later Day Night Band image. A light source (that is, burning flares) exists at the head of each cloud plume.
GOES-16 (GOES-East) “Red” Visible (0.64 µm) images (above) showed widespread ice coverage in Lake Erie on 06 February 2022. Increasing southerly/southwesterly winds were helping to open numerous ice leads, resulting in the north/northeastward drift of large ice floes across much of the eastern 3/4 of the lake. A few large ice leads even... Read More
GOES-16 “Red” Visible (0.64 µm) images, with surface wind barbs plotted in cyan and wind gusts plotted in red [click to play animated GIF | MP4]
GOES-16 (GOES-East) “Red” Visible (0.64 µm) images (above) showed widespread ice coverage in Lake Erie on 06 February 2022. Increasing southerly/southwesterly winds were helping to open numerous ice leads, resulting in the north/northeastward drift of large ice floes across much of the eastern 3/4 of the lake. A few large ice leads even opened up in the thicker ice that occupied the far western 1/4 of the lake — which stranded 18 people from getting back to the shore near Catawba Island, Ohio, requiring their rescue by Coast Guard helicopter and air boat (media report).
A sequence of 3 VIIRS True Color RGB images from Suomi-NPP and NOAA-20 viewed using RealEarth(below) offered a closer look at the ice leads opening up in the vicinity of Catawba Island around the time that the rescue event became necessary.
VIIRS True Color RGB images from Suomi-NPP and NOAA-20 [click to enlarge]
GOES-16 (GOES-East) “Red” Visible (0.64 µm) and Day Cloud Phase Distinction RGB images (above) displayed actinoform clouds (reference) near Bermuda on 05 February 2022. The light shades of green exhibited by the narrow cloud bands within the actinoform features suggested that they were beginning to glaciate — and as one of those cloud bands (associated... Read More
GOES-16 “Red” Visible (0.64 µm) and Day Cloud Phase Distinction RGB images [click to play animated GIF |MP4]
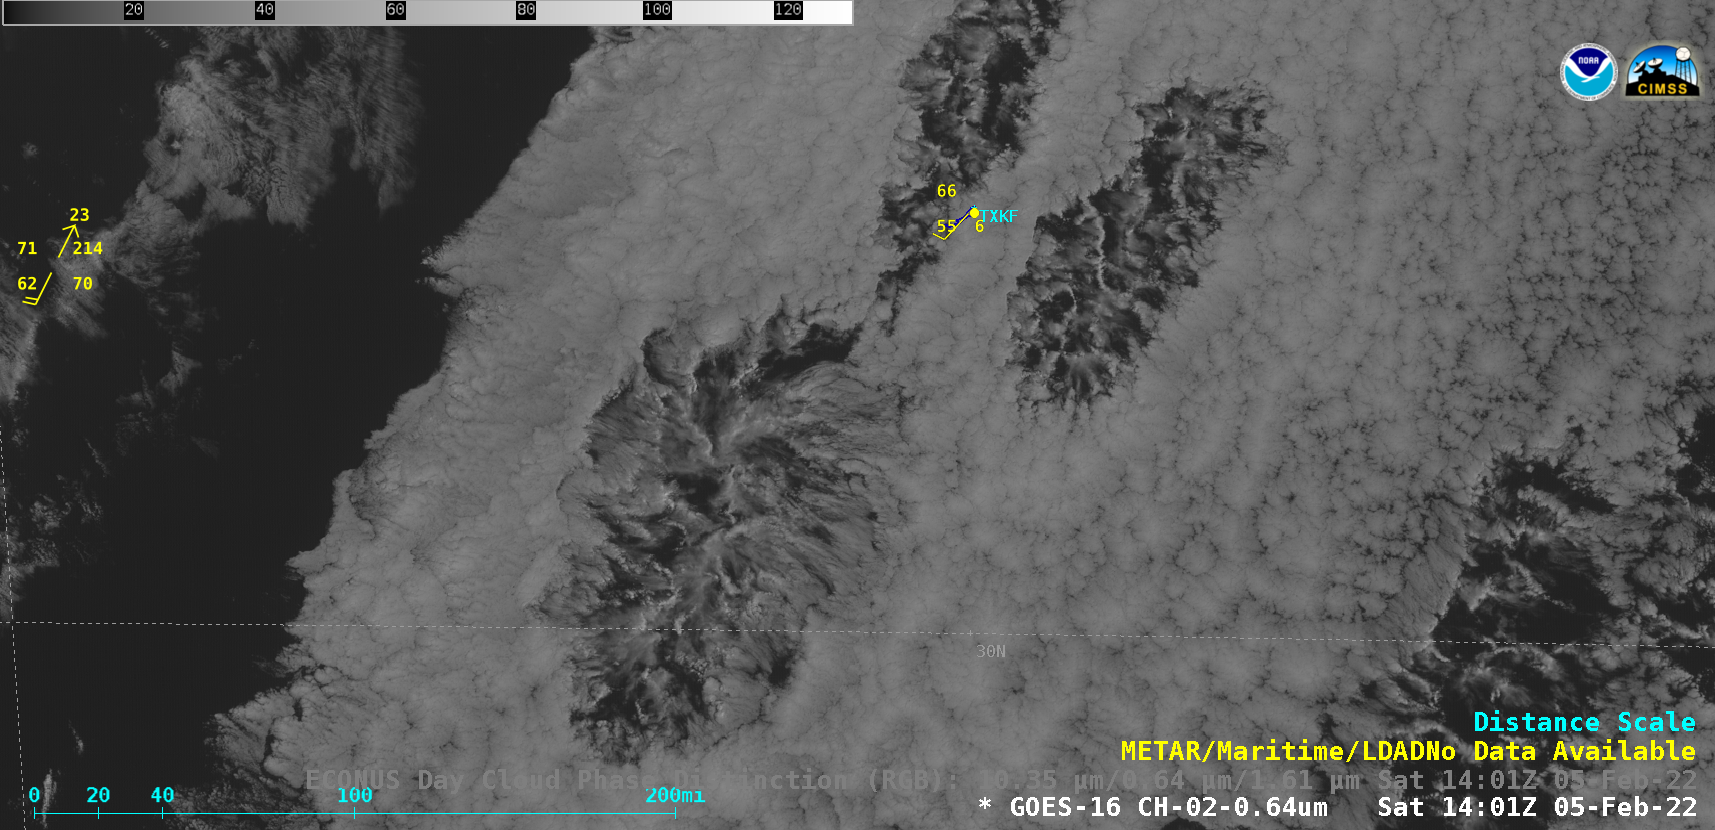
GOES-16 (GOES-East) “Red” Visible (0.64 µm) and Day Cloud Phase Distinction RGB images (above) displayed actinoform clouds (reference) near Bermuda on 05 February 2022. The light shades of green exhibited by the narrow cloud bands within the actinoform features suggested that they were beginning to glaciate — and as one of those cloud bands (associated with a dissipating actinoform feature) moved across the island of Bermuda, it briefly produced light rain showers at the airport (TXKF). It should be noted that this is an unusual location to see actinform clouds; most examples tend to form over the Pacific Ocean.
A toggle between GOES-16 Visible and RGB images at 1401 UTC is shown below.
GOES-16 “Red” Visible (0.64 µm) and Day Cloud Phase Distinction RGB images at 1401 UTC [click to enlarge]
Another example of actinoform clouds producing precipitation — over the Pacific Ocean, near Hawai`i — can be seen here.
Thanks to Margaret Mooney (CIMSS) for bringing these features in the Atlantic to our attention:


