Elsa briefly regains hurricane intensity before making landfall along the Florida coast
![GOES-16 “Red” Visible (0.64 µm) and “Clean” Infrared Window (10.35 µm) images [click to play animation | MP4]](https://cimss.ssec.wisc.edu/satellite-blog/images/2021/07/210706_goes16_visible_infrared_Elsa_anim.gif)
GOES-16 “Red” Visible (0.64 µm) and “Clean” Infrared Window (10.35 µm) images [click to play animation | MP4]
For a few hours the low-level circulation of Elsa remained exposed from its deep convection to the northeast — and GOES-16 Visible images with an overlay of deep-layer shear at 1800 UTC, from the CIMSS Tropical Cyclones site (below), showed that this was due to westerly shear values around 25-30 knots over the area.
![GOES-16 “Red” Visible (0.64 µm) images, with an overlay of deep-layer wind shear at 1800 UTC [click to enlarge]](https://cimss.ssec.wisc.edu/satellite-blog/images/2021/07/210706_goes16_visible_shear_Elsa_anim.gif)
GOES-16 “Red” Visible (0.64 µm) images, with an overlay of deep-layer wind shear at 1800 UTC [click to enlarge]
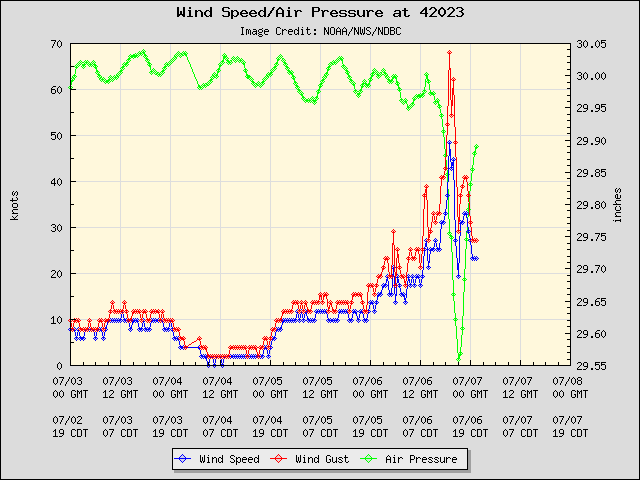
Plot of wind speed/gusts and pressure at Buoy 42023
A DMSP-15 Microwave (85 GHz) Microwave image at 2155 UTC (below) indicated that Elsa had nearly completed the formation of a closed eyewall at that time.
![DMSP-15 Microwave (85 GHz) Microwave image at 2155 UTC [click to enlarge]](https://cimss.ssec.wisc.edu/satellite-blog/images/2021/07/210706_2155utc_dmsp15_ssmis_Elsa.gif)
DMSP-15 Microwave (85 GHz) Microwave image at 2155 UTC [click to enlarge]
![GOES-16 Infrared / Water Vapor Difference images [click to enlarge]](https://cimss.ssec.wisc.edu/satellite-blog/images/2021/07/210706_goes16_infrared_waterVapor_difference_Elsa_anm.gif)
GOES-16 Infrared / Water Vapor Difference images [click to enlarge]
===== 07 July Update =====
![GOES-16 “Red” Visible (0.64 µm) and “Clean” Infrared Window (10.35 µm) images [click to play animation | MP4]](https://cimss.ssec.wisc.edu/satellite-blog/images/2021/07/210707_goes16_visible_infrared_Elsa_landfall_anim.gif)
GOES-16 “Red” Visible (0.64 µm) and “Clean” Infrared Window (10.35 µm) images [click to play animation | MP4]
At 1223 UTC, a DMSP-17 SSMIS Microwave image (below) indicated that a closed eyewall was not present with Elsa at that time.
![DMSP-17 SSMIS Microwave (85 GHz) image [click to enlarge]](https://cimss.ssec.wisc.edu/satellite-blog/images/2021/07/210707_1223utc_dmsp17_ssmis_microwave_Elsa.png)
DMSP-17 SSMIS Microwave (85 GHz) image [click to enlarge]