This website works best with a newer web browser such as Chrome, Firefox, Safari or Microsoft
Edge. Internet Explorer is not supported by this website.
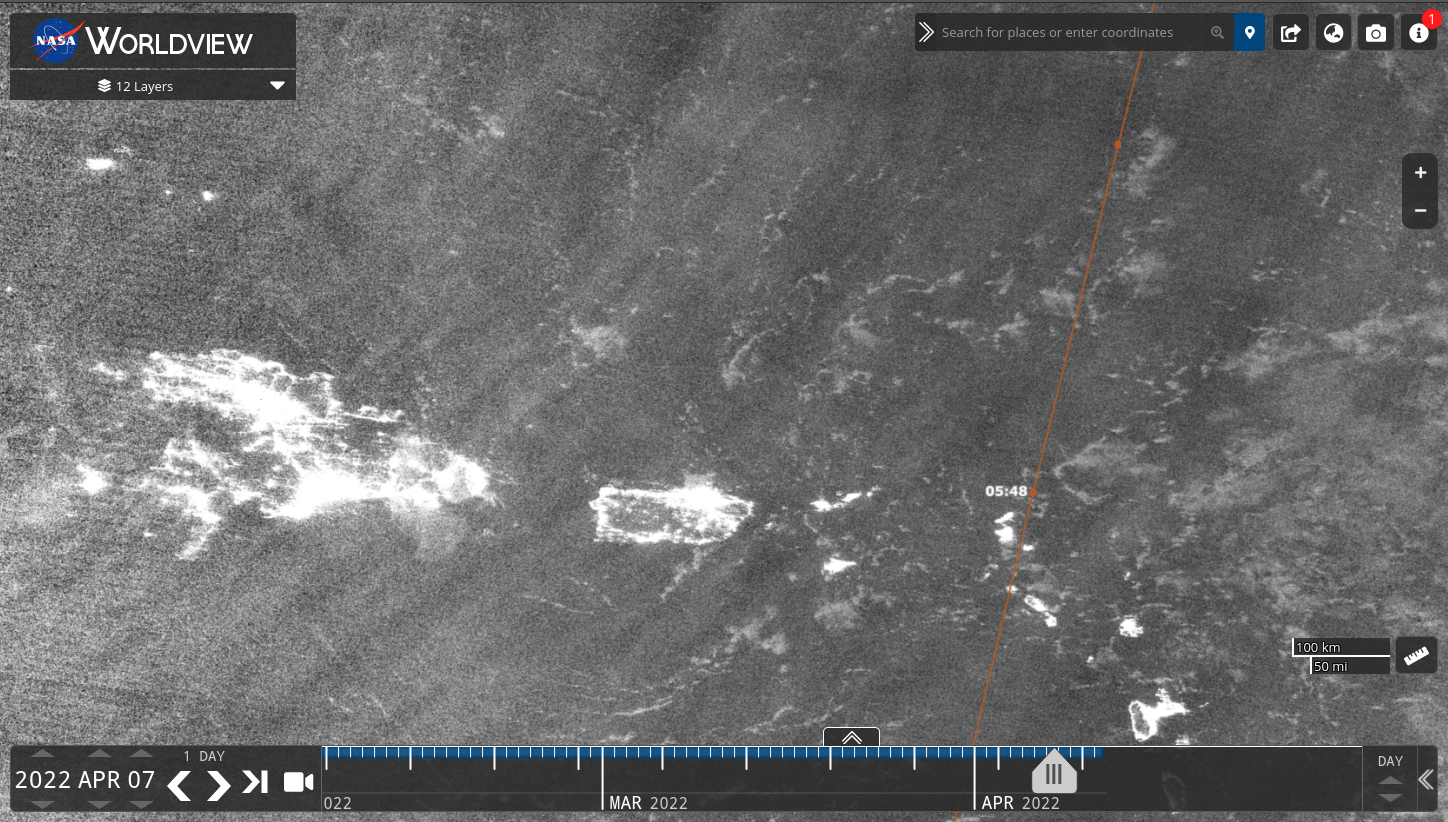
A fire at the Costa Sur power generation station in southwestern Puerto Rico shortly after 0100 UTC on 7 April caused wide-spread (but short-lived) power outages over the island. Imagery above shows the Day Night Band visible imagery (0.70 µm) from Suomi NPP, and a marked decrease in luminosity is... Read More
Suomi NPP Day Night Band visible (0.70 µm) imagery (left) and I05 infrared (11.45 µm) Brightness Temperature imagery (right) from 5-9 April 2022; NPP orbit paths/times are also indicated (click to enlarge)
A fire at the Costa Sur power generation station in southwestern Puerto Rico shortly after 0100 UTC on 7 April caused wide-spread (but short-lived) power outages over the island. Imagery above shows the Day Night Band visible imagery (0.70 µm) from Suomi NPP, and a marked decrease in luminosity is apparent in the 07 April imagery. I05 infrared (11.45 µm) imagery on the right (all imagery is from the NASA Worldview site) shows few clouds over the island. The animations below show Day Night Band imagery alone from 6-8 April, and I05 Brightness Temperatures from 6-8 April 2022.
Suomi NPP Day Night Band visible (0.70 µm) from 6-8 April 2022; NPP orbit path/times are also indicated (click to enlarge)Suomi NPP I05 (11.45 µm) infrared Brightness Temperature from 6-8 April 2022; NPP orbit path/times are also indicated (click to enlarge)
1-minute Mesoscale Domain Sector GOES-17 (GOES-West) “Red” Visible (0.64 µm) images (above) showed a hazy plume of resuspended volcanic ash — from the 1912 eruption of Novarupta-Katmai — moving southeastward then eastward across the Shelikof Strait toward Kodiak Island in southern Alaska on 08 April 2022.The corresponding 1-minute GOES-17 Dust RGB images (below) displayed faint hues of... Read More
GOES-17 “Red” Visible (0.64 µm) images [click to play animated GIF | MP4]
1-minute Mesoscale Domain Sector GOES-17 (GOES-West) “Red” Visible (0.64 µm) images (above) showed a hazy plume of resuspended volcanic ash — from the 1912 eruption of Novarupta-Katmai — moving southeastward then eastward across the Shelikof Strait toward Kodiak Island in southern Alaska on 08 April 2022.
The corresponding 1-minute GOES-17 Dust RGB images (below) displayed faint hues of magenta associated the plume — which appeared to increase somewhat around 00 UTC on 09 April.
GOES-17 Dust RGB images [click to play animated GIF | MP4]
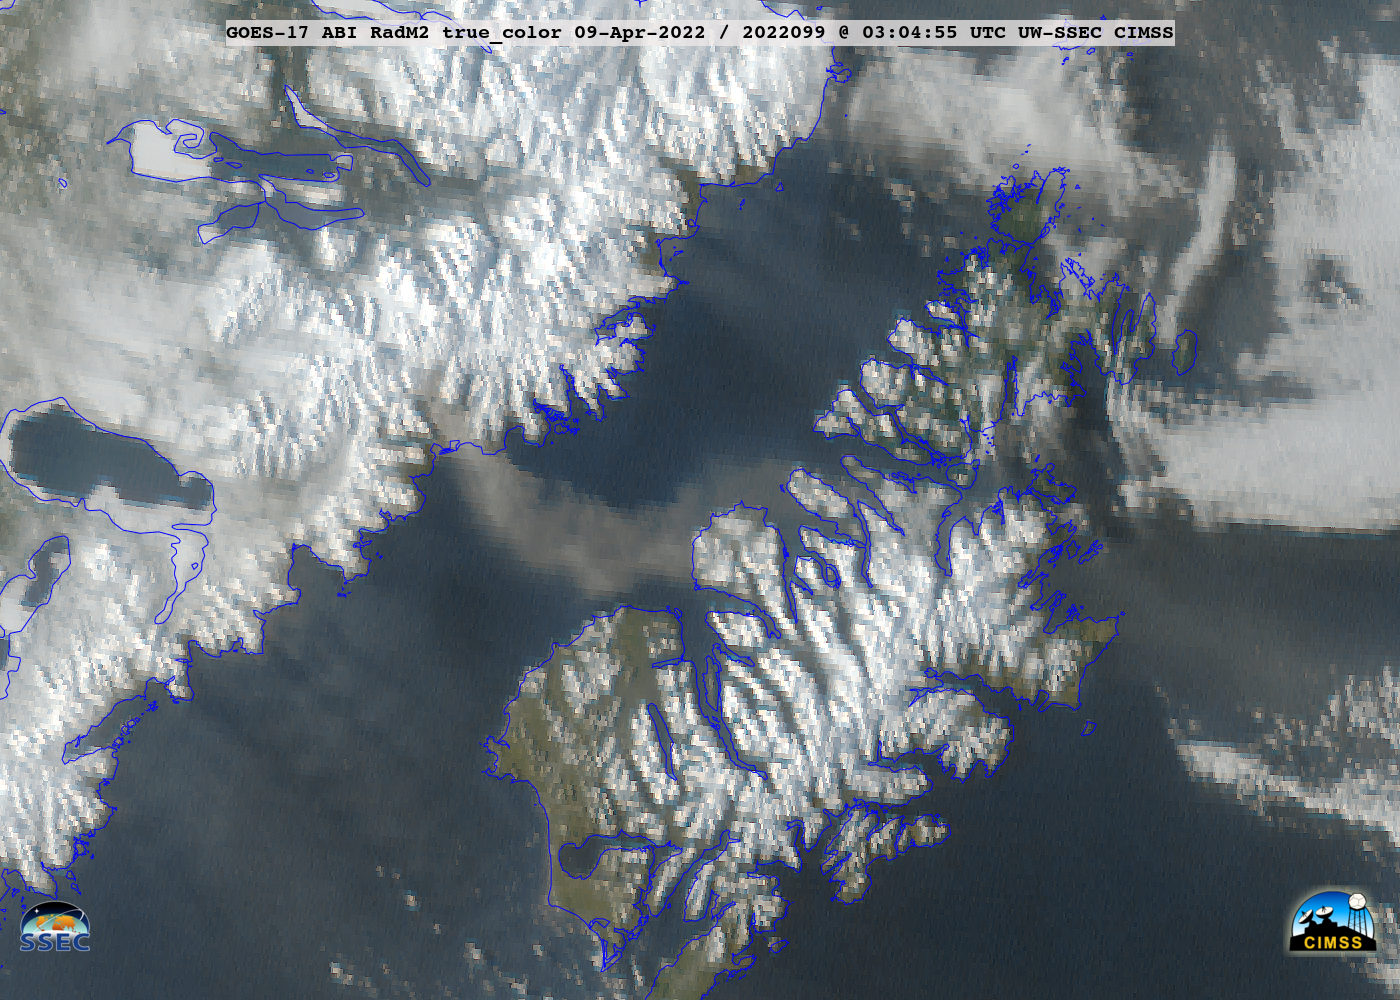
1-minute GOES-17 True Color RGB images created using Geo2Grid(below) helped to confirm the emergence of a second pulse of resuspended ash that began around 00 UTC.
GOES-17 True Color RGB images [click to play animated GIF | MP4]
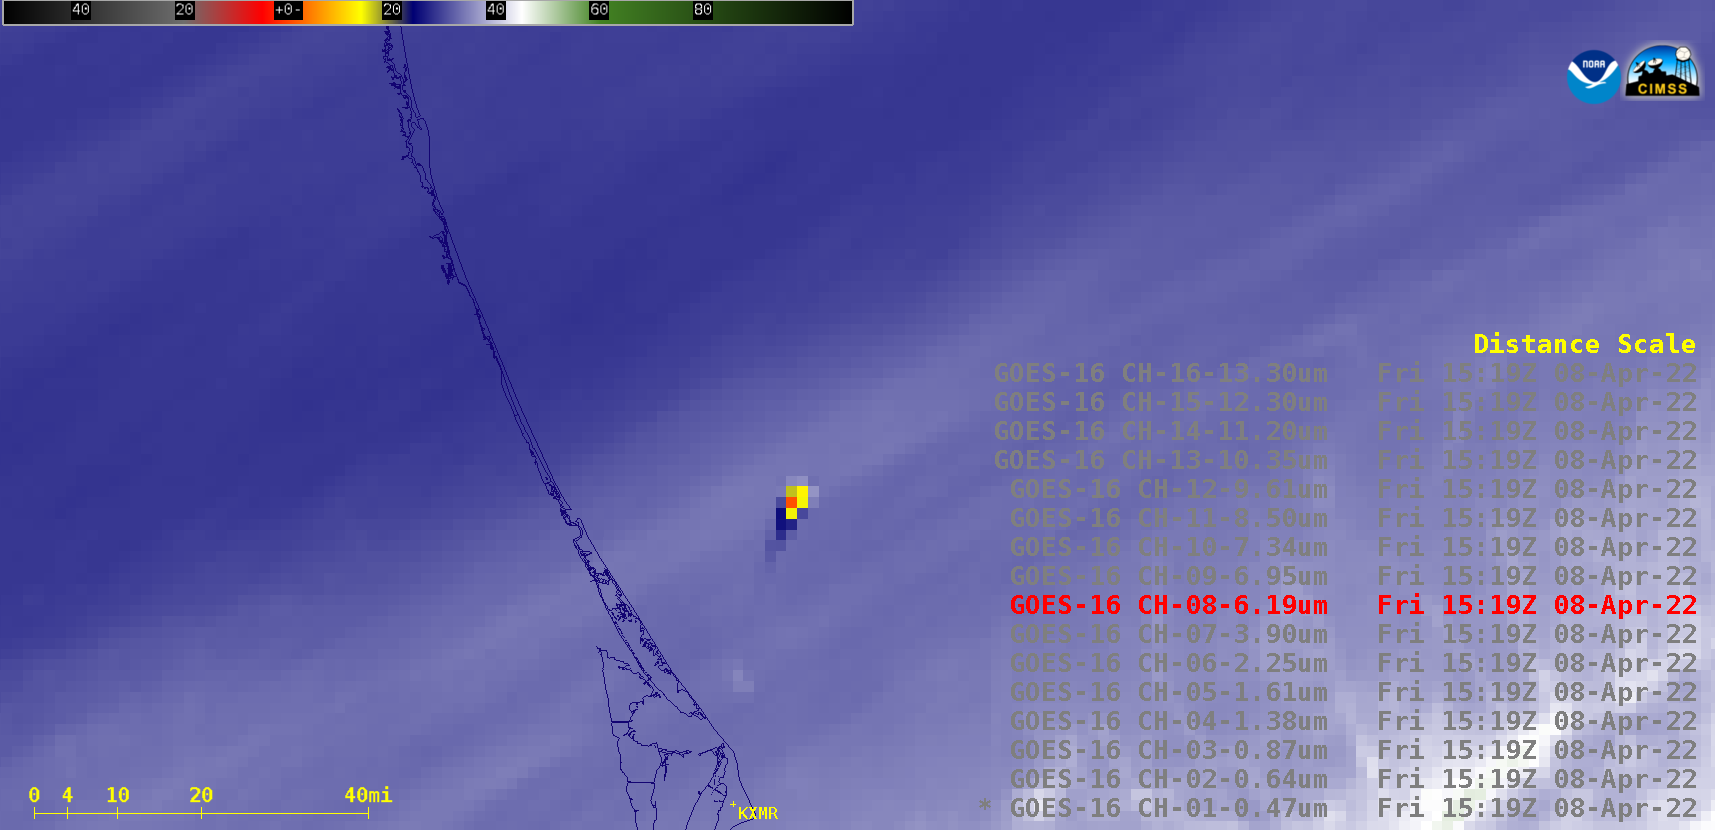
1-minute Mesoscale Domain Sector GOES-16 (GOES-East) images from all 16 ABI spectral bands (above) displayed reflectance and/or thermal signatures of the SpaceX AX-1 Mission’s Falcon 9 rocket booster as it was launched from Cape Canaveral Space Force Center on the morning of 08 April 2022.GOES-16 True Color RGB images from the CSPP GeoSphere... Read More
GOES-16 images from all 16 ABI spectral bands [click to play animated GIF | MP4]
1-minute Mesoscale Domain Sector GOES-16 (GOES-East) images from all 16 ABI spectral bands (above) displayed reflectance and/or thermal signatures of the SpaceX AX-1 Mission’s Falcon 9 rocket booster as it was launched from Cape Canaveral Space Force Center on the morning of 08 April 2022.
GOES-16 True Color RGB images from the CSPP GeoSphere site (below) showed the rocket booster condensation plume as it drifted eastward away from the launch site.
GOES-16 True Color RGB images [click to play animated GIF | MP4]
Thunderstorms were slowly but surely edging their way dangerously close to Raymond James Stadium in Tampa, FL, on April 2nd. The New York Yankees and Atlanta Braves had just completed a spring training game at the stadium, when two people were struck by lightning in one of the parking lots surrounding the stadium (they were... Read More
Thunderstorms were slowly but surely edging their way dangerously close to Raymond James Stadium in Tampa, FL, on April 2nd. The New York Yankees and Atlanta Braves had just completed a spring training game at the stadium, when two people were struck by lightning in one of the parking lots surrounding the stadium (they were hospitalized but reported to be in stable condition).
ProbSevere LightningCast is an experimental deep-learning model that is running in near-real time at CIMSS. It uses images of GOES-R Advanced Baseline Imager (ABI) visible, near-IR, and longwave-IR channels to predict the probability of lightning (as observed by the GOES-R Geostationary Lightning Mapper [GLM]) in the next 60 minutes.
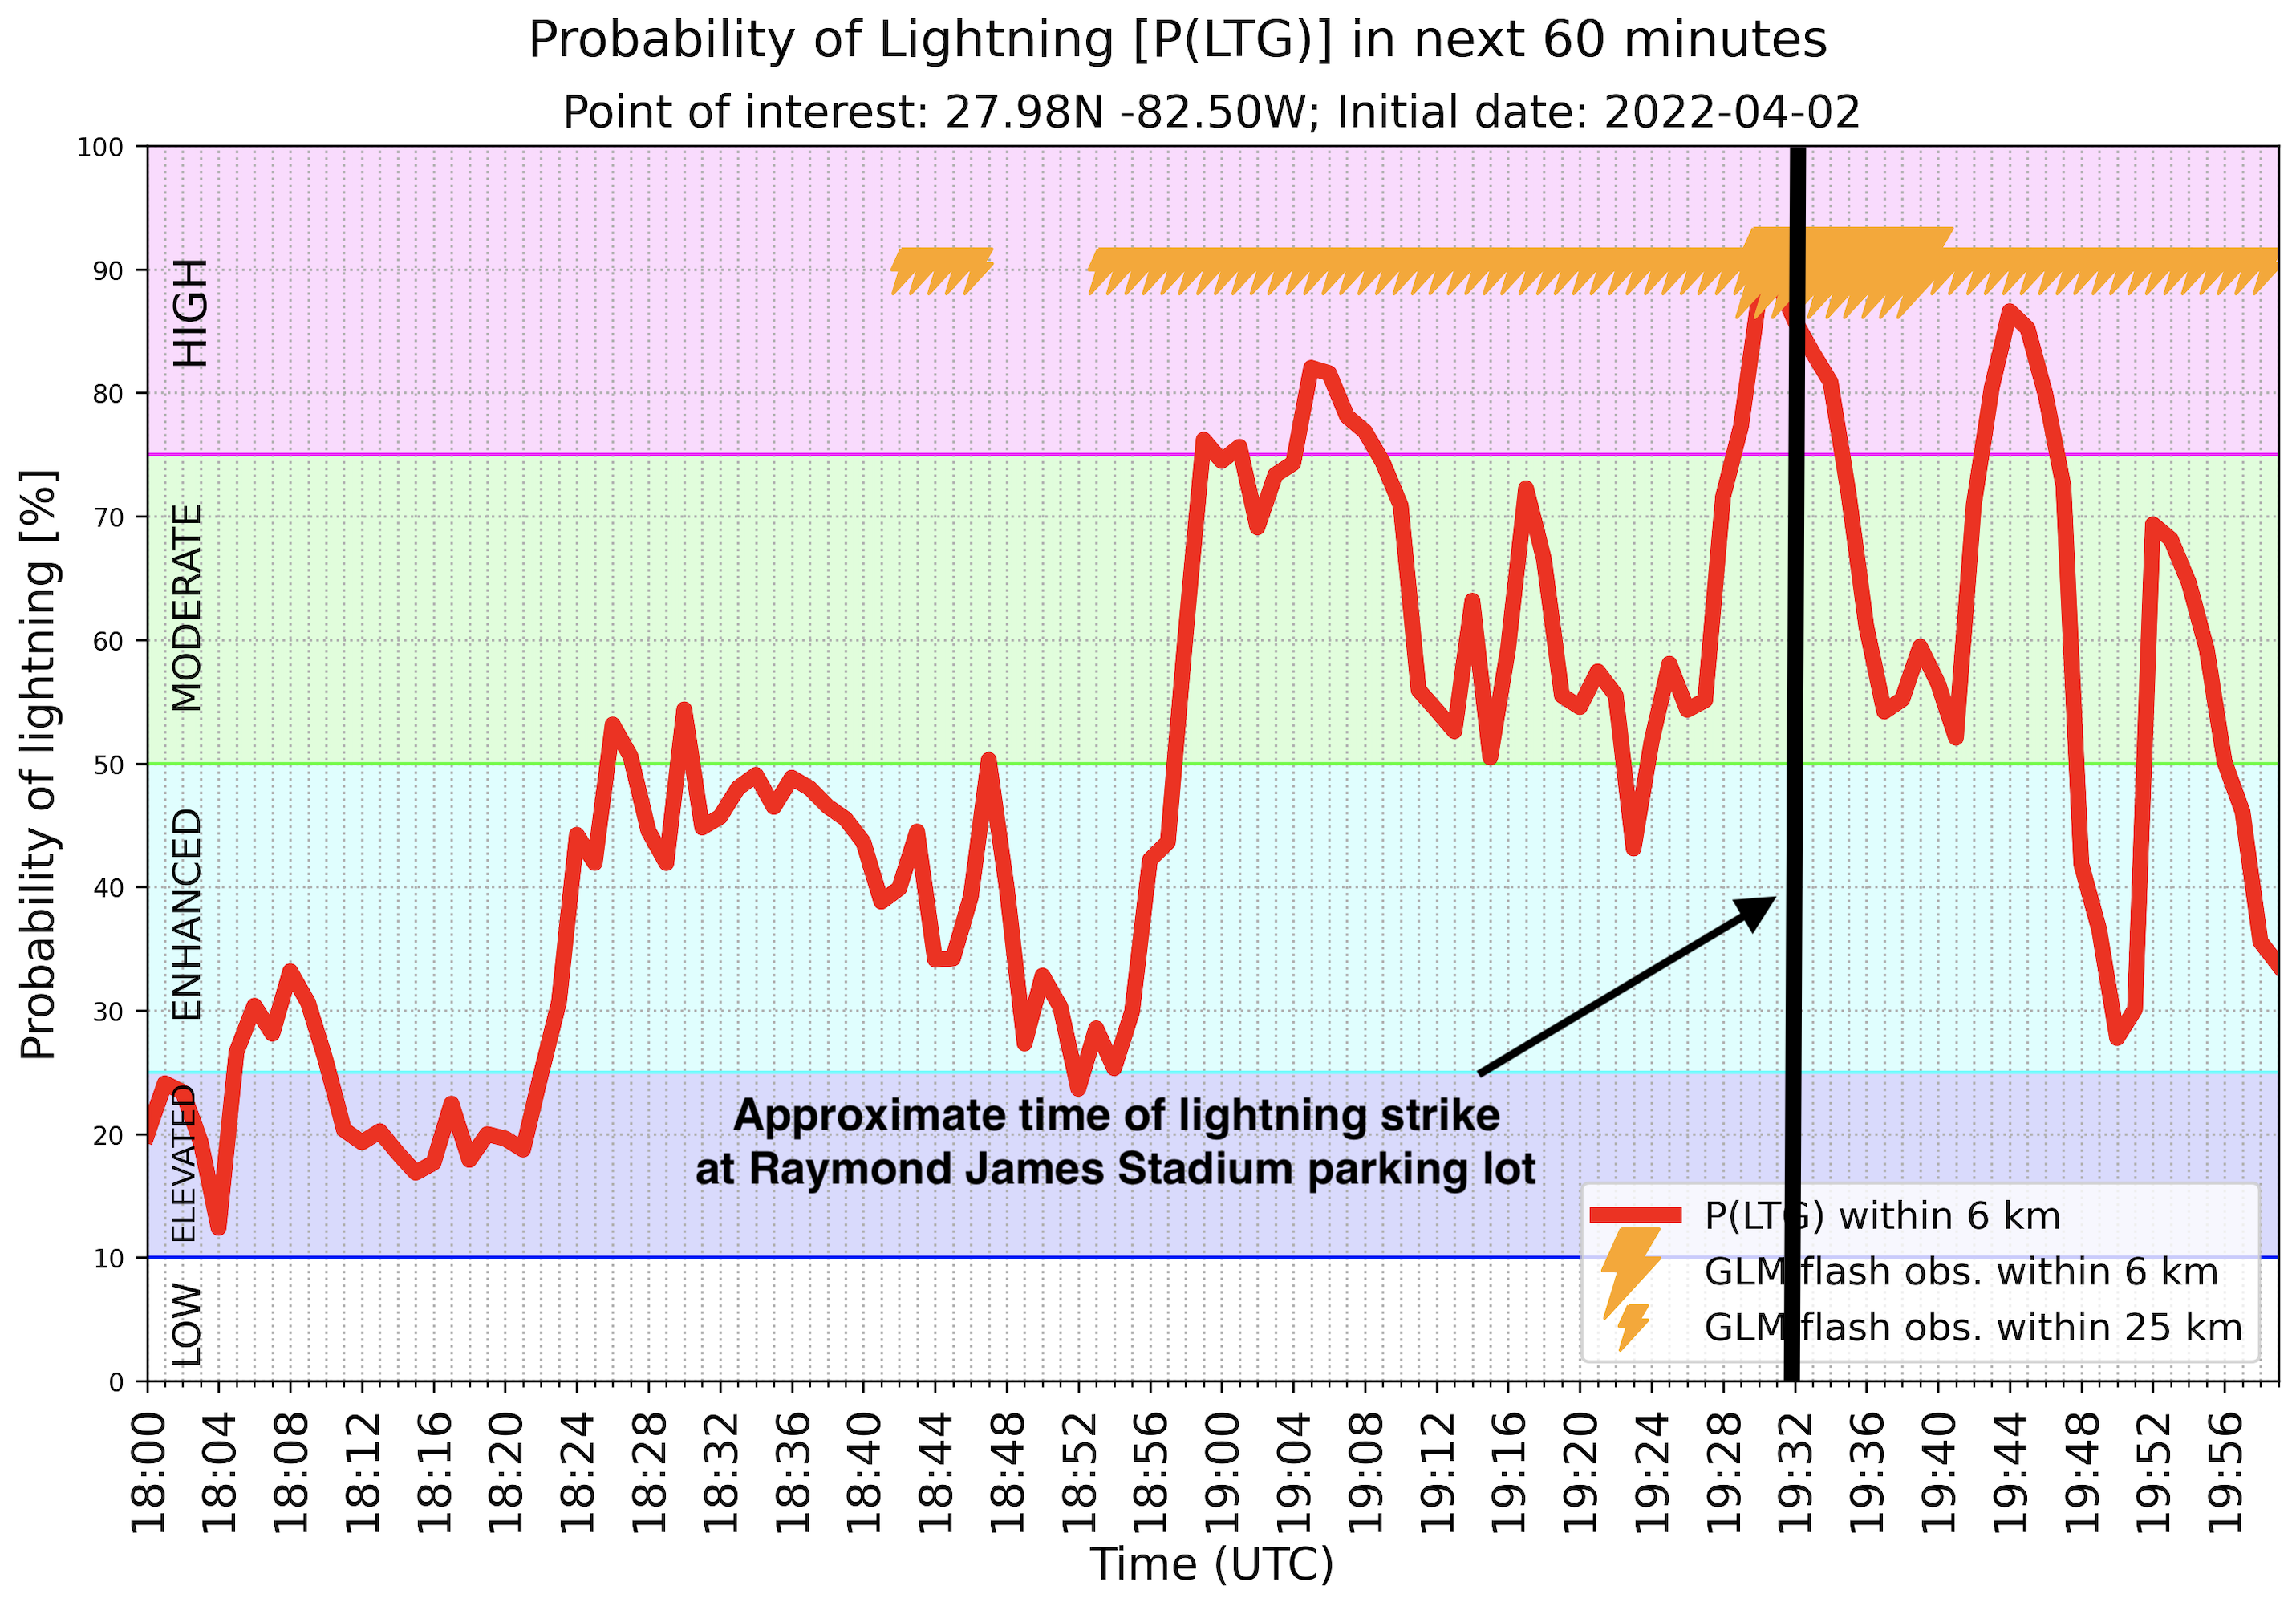
Below is a time series of the LightningCast probability and GLM-observed lightning at and near Raymond James Stadium (left panel), along with an animation of LightningCast probability contours, GOES-16 0.64-µm reflectance (from a 1-minute mesoscale sector), and GLM flash-extent density (right panel) near the stadium (red circle). In this way, users can see how the model’s probabilities evolved over time at a specific location and within the vicinity.
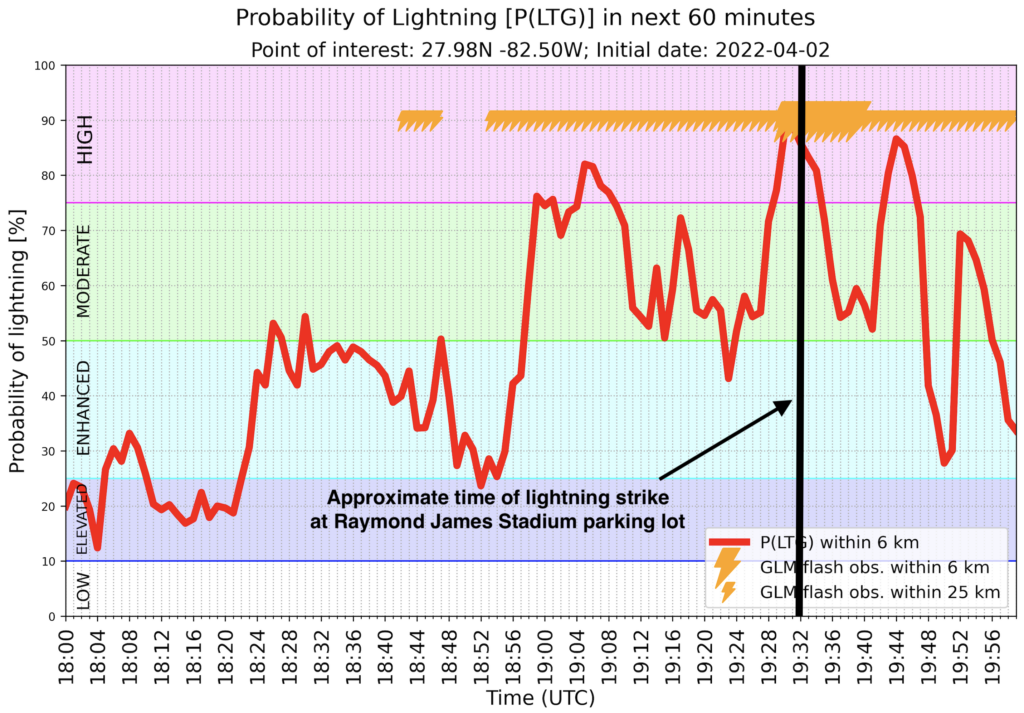
Figure 1: Time series of LightingCast probability and GLM-observed lightning at Raymond James Stadium (left). Animation of LightningCast contours, GOES-16 visible reflectance, and GLM flash-extent density (right) near the stadium (red circle).
Police officers responded to the two individuals struck by lightning at 3:45 PM local time (19:45 UTC). Based on the footprint of the GLM flash-extent density, they were struck at approximately 3:32 PM. The LightningCast probability of lightning was 75% 30 minutes before the lightning strike (remaining mostly above 50% between 3:00 and 3:32 PM). The probability of lightning first reached 50% about 1 hour before the lightning strike, and lightning started occurring within the vicinity (within 25 km) about 45 minutes before the strike.
Output from LightningCast, which leverages the high spatial, temporal, and spectral information found in GOES-R ABI, can help objectively quantify the short-term threat of convective hazards such as lightning. The model could perhaps be used by forecasters to advise outdoor venues such as stadiums to take mitigating actions sooner, or by individuals to help make safe decisions.
Figure 2: Annotated time series of LightningCast probability of lightning and GLM observations near Raymond James Stadium.