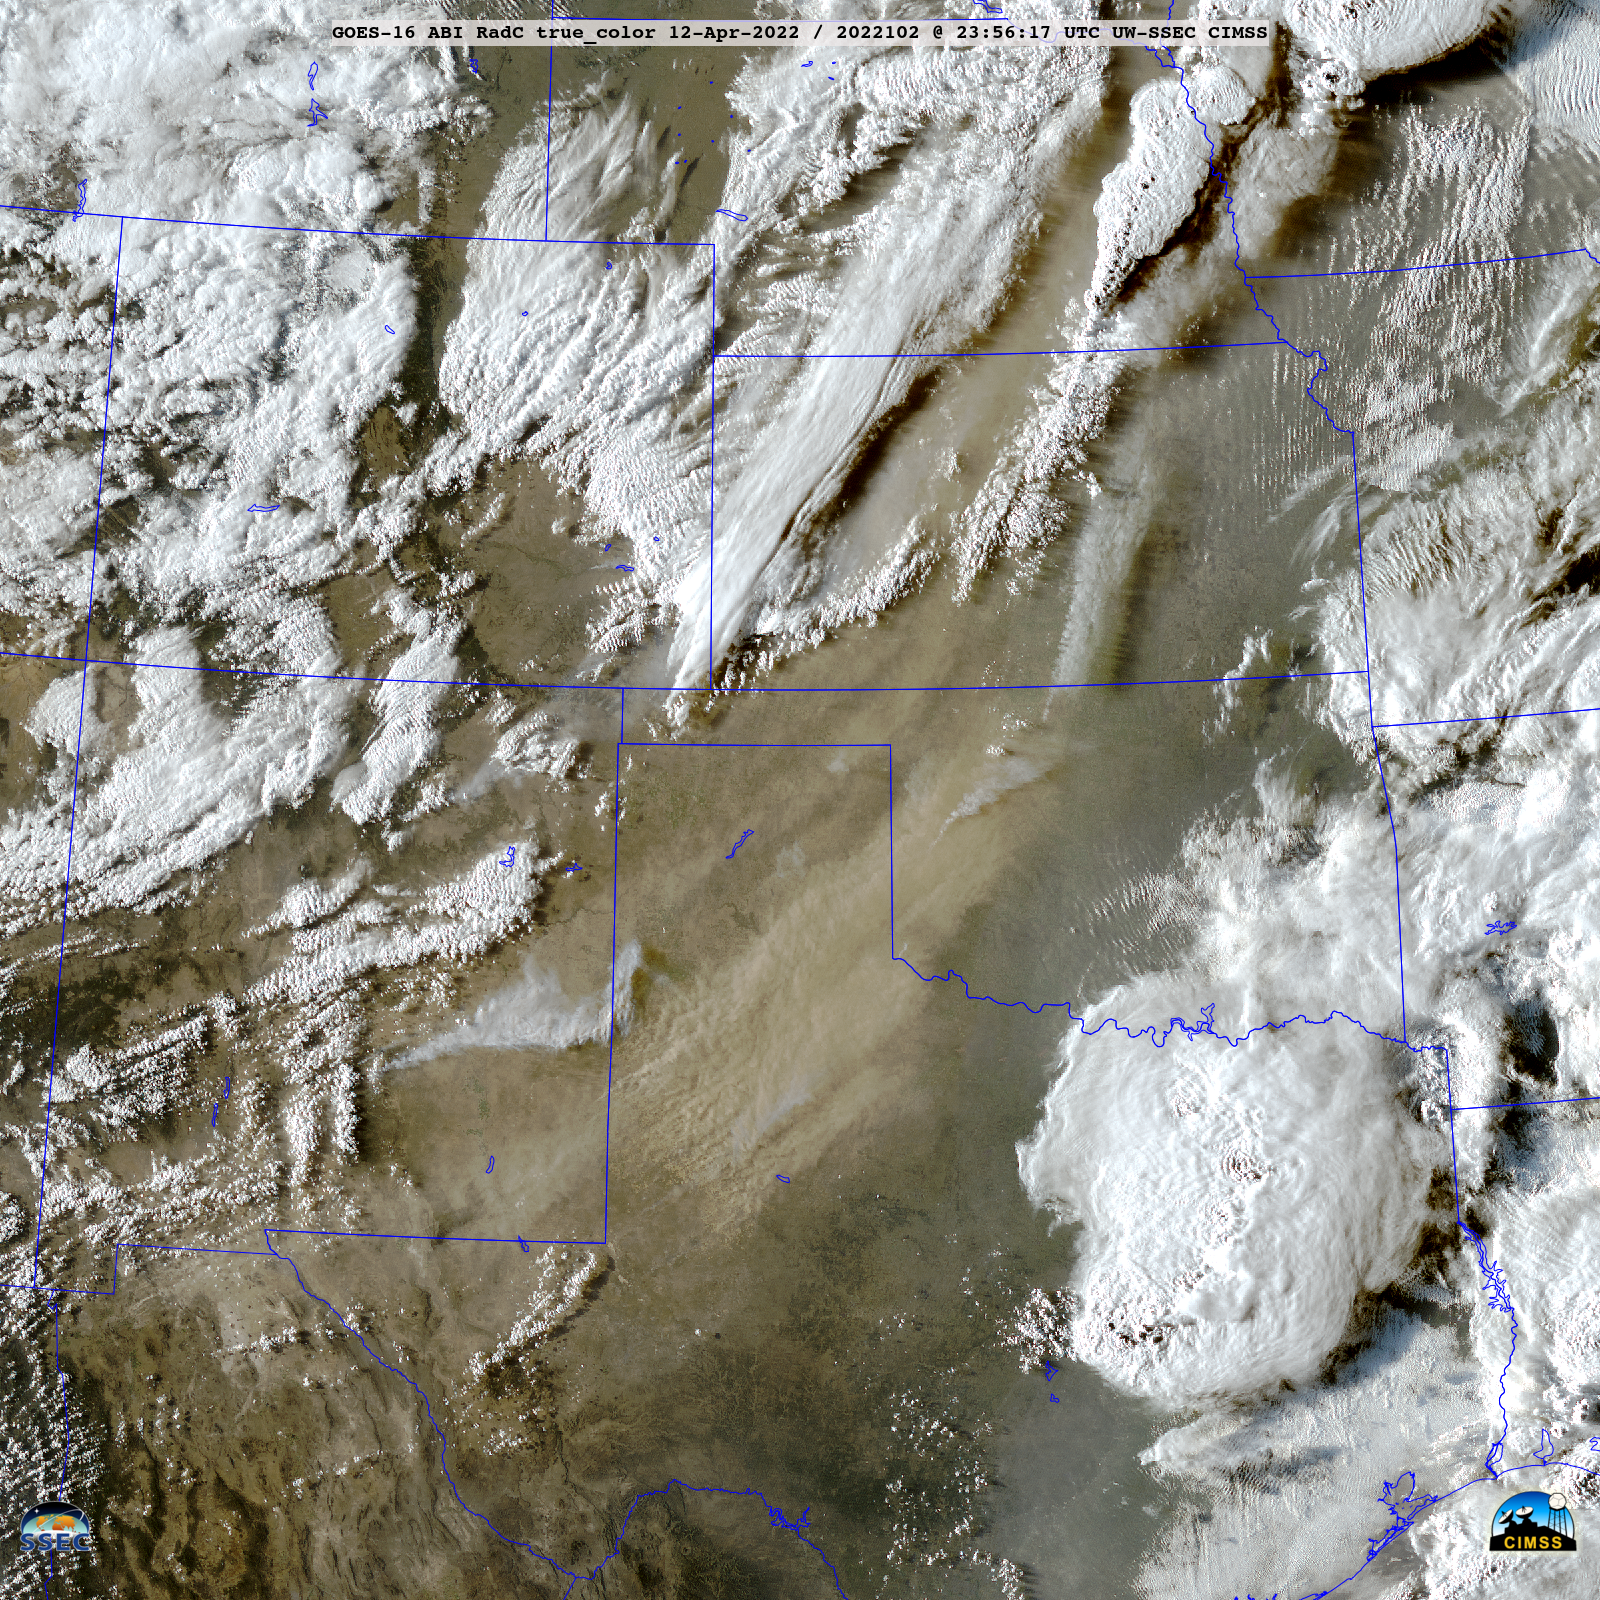

GOES-16 True Color RGB images [click to play animated GIF | MP4]
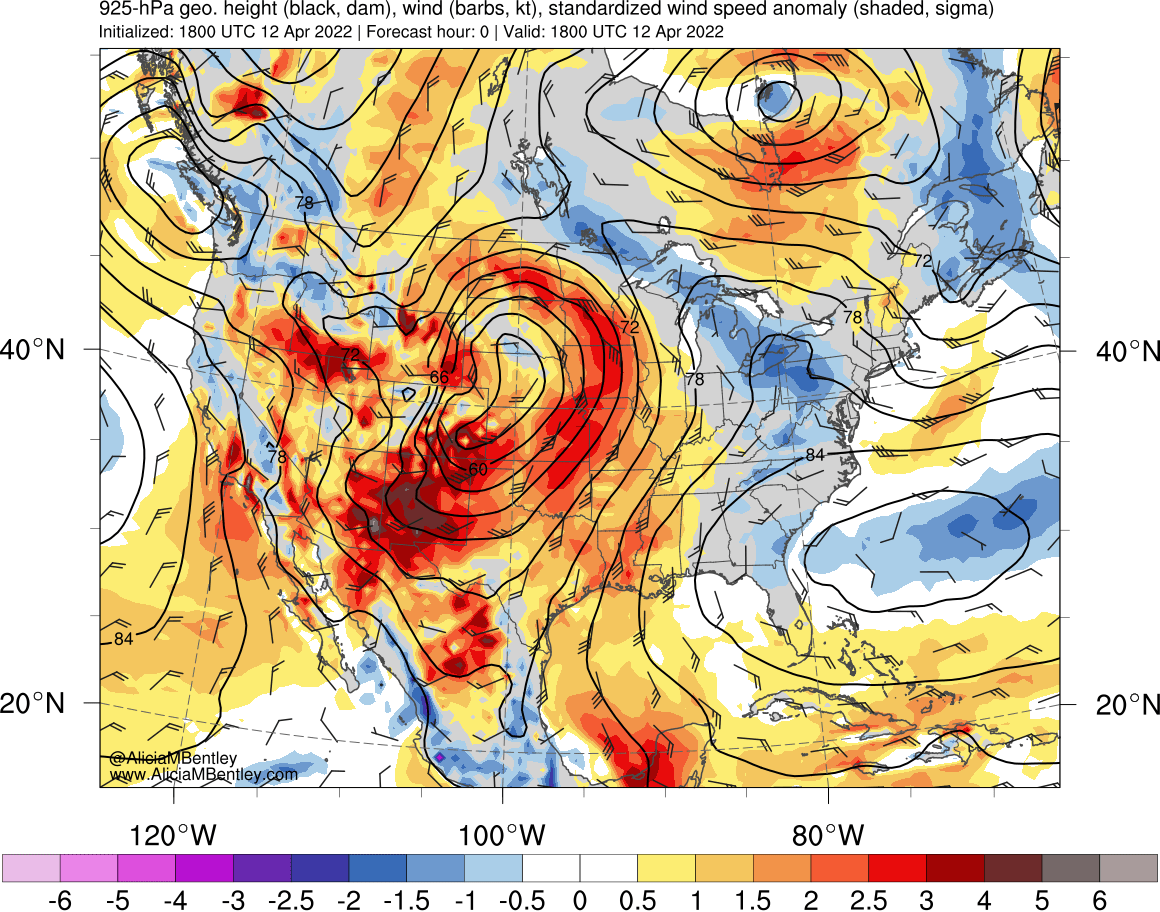
5-minute GOES-16 {GOES-East) True Color RGB images created using Geo2Grid (below) showed widespread blowing dust (shades of tan) and wildfire smoke plumes (brighter shades of white) across much of the central/southern Plains on 12 April 2022. Wind speeds were anomalously strong behind a dryline within the warm sector of an anomalously-deep surface low, which were responsible for the spread of wildfires and blowing dust.
In southeastern Colorado, 1-minute Mesoscale Domain Sector GOES-16 “Red” Visible (0.64 µm) and Shortwave Infrared (3.9 µm) images along with 5-minute Fire Power and Fire Temperature products (below) displayed a smoke plume and thermal signatures of 2 grass fires that rapidly intensified between La Junta (where the peak wind gust was 53 knots) and Lamar. The Fire Temperature and Fire Power derived products are components of the GOES Fire Detection and Characterization Algorithm FDCA.
GOES-16 “Red” Visible (0.64 µm, top left), Shortwave Infrared (3.9 µm, top right), Fire Power (bottom left) and Fire Temperature (bottom right) [click to play animated GIF | MP4]
Farther to the south, 1-minute GOES-16 “Red” Visible (0.64 µm) and “Clean” Infrared Window (10.35 µm) images (below) include plots of time-matched SPC Storm Reports for severe thunderstorms in central Texas — which produced tornadoes and hail as large as 5.50 inches in diameter. Note that 2 of these storms exhibited Above-Anvil Cirrus Plumes (AACP: reference | VISIT training) in the Visible imagery; however, the corresponding “warm AACP” signature was not evident in the Infrared images, as is frequently the case.
GOES-16 “Red” Visible (0.64 µm, top) and “Clean” Infrared Window (10.35 µm, bottom) images, with time-matched SPC Storm Reports plotted in red/cyan [click to play animated GIF | MP4]
The lack of a “warm AACP ” infrared signature was explained by 2000 UTC rawinsonde data (source) from Fort Worth, Texas (below), which indicated that stratospheric temperatures continued to cool with height.
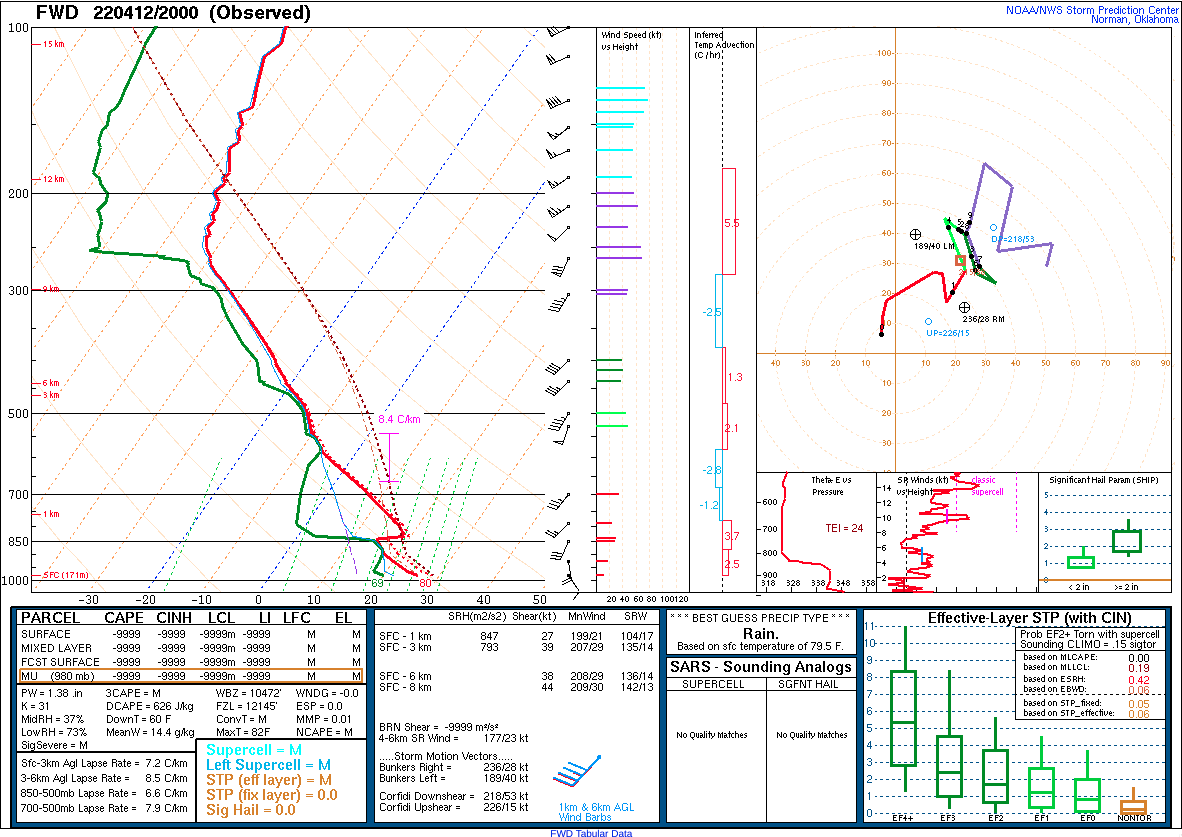
Plot of 2000 UTC rawinsonde data from Fort Worth, Texas [click to enlarge]

GOES-16 Mid-level (6.9 um) Water Vapor images, with hourly surface precipitation type plotted in red [click to play animated GIF | MP4]
Finally, across the northern Plains within the cold sector of the large surface low, blizzard conditions spread across much of North Dakota (and adjacent portions of eastern Montana, northern South Dakota and northwestern Minnesota) — as shown in 5-minute GOES-16 Mid-level Water Vapor (6.9 um) images with plots of precipitation type (above) and wind barbs/gusts (below).

GOES-16 Mid-level (6.9 um) Water Vapor images, with plots of hourly surface wind barbs and gusts in knots [click to play animated GIF | MP4]
===== 14 April Update =====

GOES-16 Mid-level (6.9 um) Water Vapor images, with hourly surface precipitation type plotted in red [click to play animated GIF | MP4]
As the Northern Plains blizzard persisted into its third day on 14 April, longer animations of GOES-16 Water Vapor images are shown with plots of precipitation type (above) and wind barbs/gusts (below). Storm total snowfall accumulations included 36 inches in North Dakota, with peak wind gusts of 72 mph in South Dakota (WPC Storm Summary). The 3-day total of 18.3 inches was Bismarck’s largest April snowfall on record.

GOES-16 Mid-level (6.9 um) Water Vapor images, with plots of hourly surface wind barbs and gusts in knots [click to play animated GIF | MP4]
===== 15 April Update =====
GOES-16 Day Snow Fog RGB images [click to play animated GIF | MP4]
On the morning of 15 April, GOES-16 Day Snow Fog RGB images (above) revealed the partial extent of new snow cover from the 3-day blizzard (darker shades of red), along with narrow plumes of “river effect snow” (shades of white) streaming southeastward from unfrozen reservoirs along the Missouri River in North Dakota and South Dakota. At one point, a plume passing directly over Hazen, North Dakota (downwind of Lake Sakakawea) was producing light snow that reduced the surface visibility to 4 miles.
View only this post Read Less


