This website works best with a newer web browser such as Chrome, Firefox, Safari or Microsoft
Edge. Internet Explorer is not supported by this website.
Florida is one of the lightning capitals of the world, so residents need to be constantly aware of lightning safety. NOAA/CIMSS LightningCast might be able to help with that. A tree and home in Sebring, Florida were suddenly struck by lightning on the morning of Saturday, May 7th. A line of storms was... Read More
Florida is one of the lightning capitals of the world, so residents need to be constantly aware of lightning safety. NOAA/CIMSS LightningCast might be able to help with that.
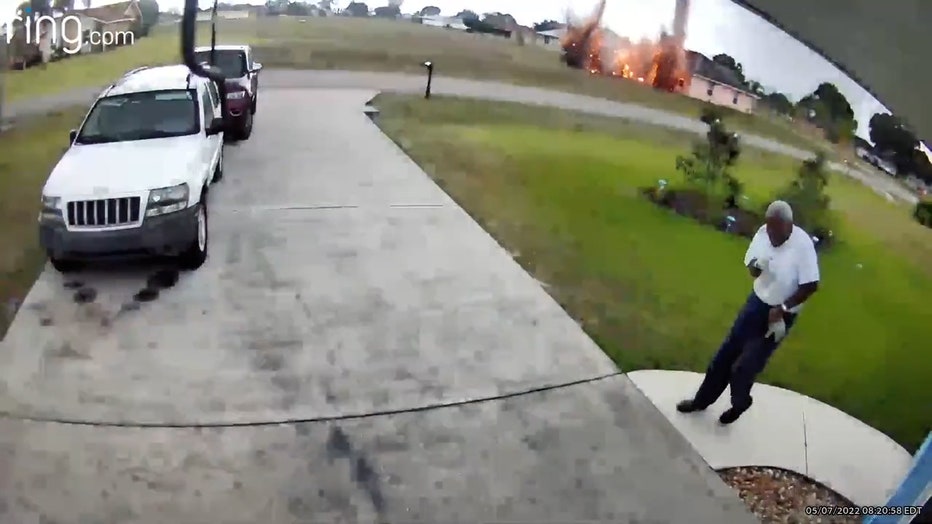
A tree and home in Sebring, Florida were suddenly struck by lightning on the morning of Saturday, May 7th. A line of storms was edging its way eastward. A neighbor who was outside at the time said, “It wasn’t raining. It was nice and warm. It was cloudy, but that was it. And then boom!” This underscores how easy it is to be caught unaware of potential lightning danger.
LightningCast can help with users’ situational awareness. LightningCast is an experimental deep-learning model trained on thousands of GOES-R ABI and GLM images to predict the probability of next-hour lightning occurrence. In the animation below, the red dot is Sebring, Florida.
LightningCast probability contours, GOES-16 ABI imagery (grayscale background), and GOES-16 GLM flash-extent density (shaded color). The red dot is the approximate location of the “bolt out of the blue”. Florida homeowner stunned by nearby lightning strike. Credit: FOX13 Tampa Bay
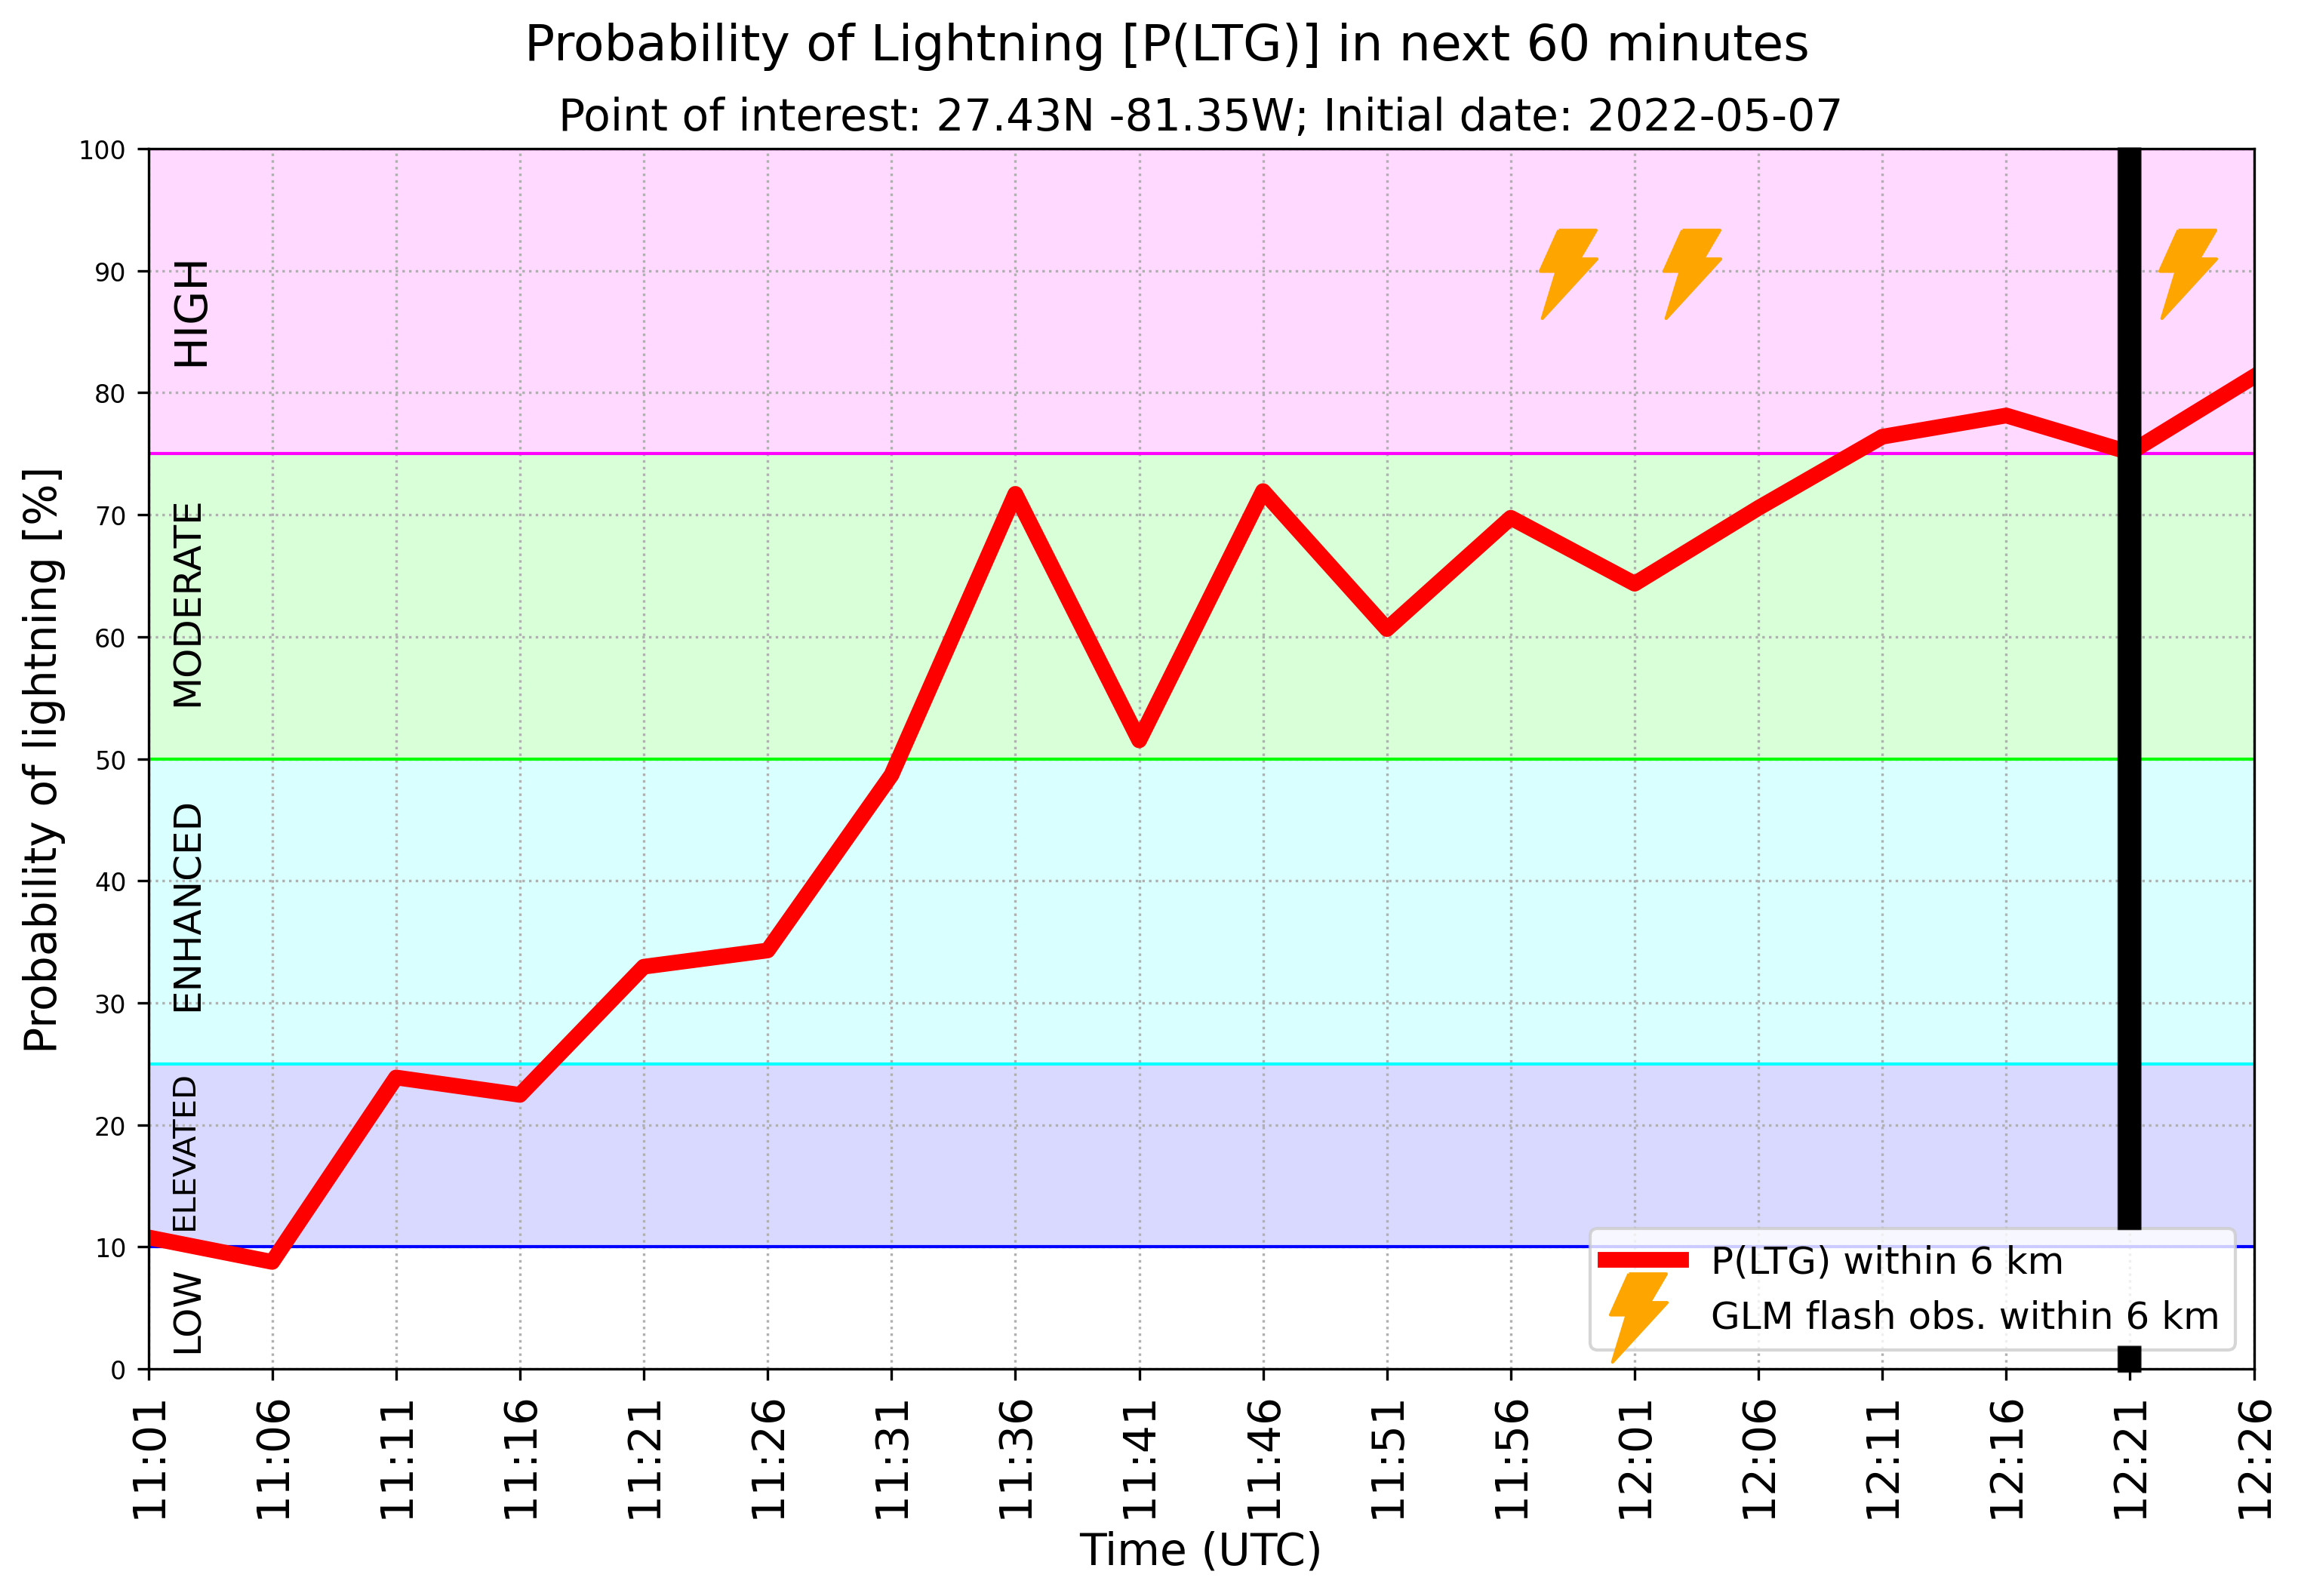
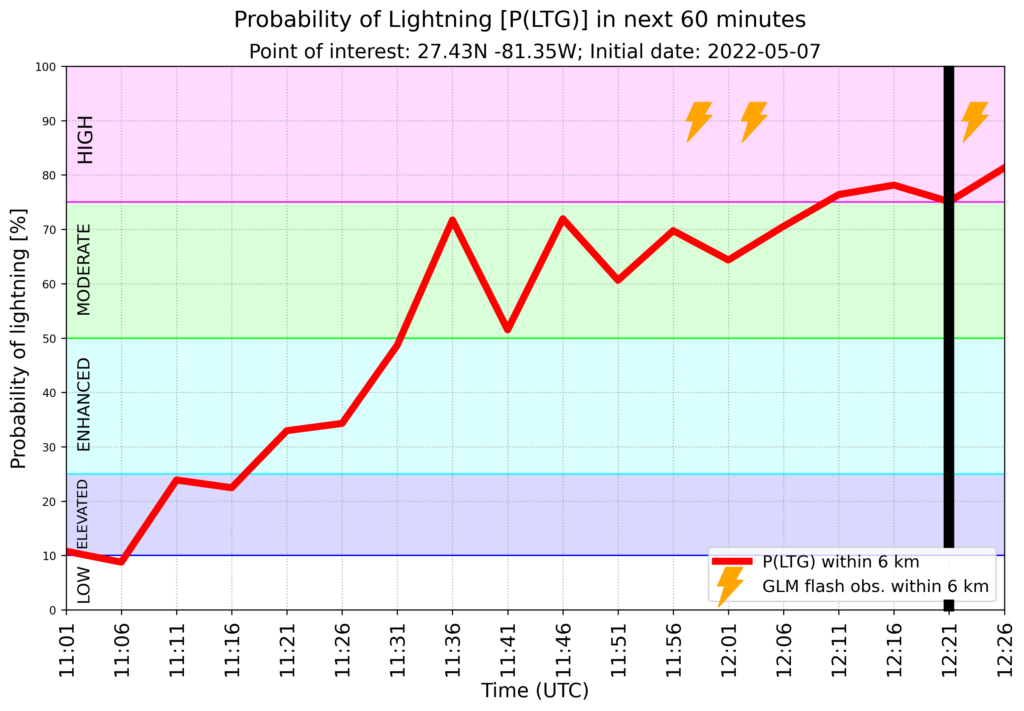
Below is a time series of LightningCast probability and GLM observations around the home in Sebring. Lightning struck the tree and home at 8:21 EDT, marked by the vertical black line below. You can see a rapid increase in probability of lightning from 11:26 to 11:36 UTC (7:26 to 7:36 EDT), reaching 70%. This was about 25 minutes before the first nearby lightning strike and 45 minutes before the Sebring home was struck.
The animation below from the National Weather Service lightning safety page shows that most lightning casualties occur before a thunderstorm is fully overhead, or before it fully departs the area, when people might not realize their vulnerability to lightning and don’t seek shelter soon enough or leave shelter too soon.
Animation depicting the threat of lightning casualties as a function of a hypothetical storm moving into the area.
Here’s a text received late on 8 May from a kid: “Hail today in Portland”. The animation above shows GOES-17 Visible (0.64 µm) imagery between 2201 UTC on 8 May and 0311 UTC on 9 May. The follow-up text answering the obvious question (What time?) was “Around 5 PM” —... Read More
GOES-17 Visible Band 2 (0.64 µm) imagery, 2201 UTC 8 May 2022 – 0311 UTC 9 May 2022 (Click to enlarge)
Here’s a text received late on 8 May from a kid: “Hail today in Portland”. The animation above shows GOES-17 Visible (0.64 µm) imagery between 2201 UTC on 8 May and 0311 UTC on 9 May. The follow-up text answering the obvious question (What time?) was “Around 5 PM” — that is, around 0000 UTC on 9 May. Infrared imagery (Band 13, 10.3 µm) from GOES-17 over the same time period — 2201 – 0311 UTC — is shown below. This loop uses a default enhancement from AWIPS (which enhancement has as its coolest temperature -109oC, perhaps too cold for this airmass; click here to see an animation with a coolest temperature of -90oC; variability in the cold cloud tops is much easier to visualize in that modified color enhancement).
GOES-17 Infrared Band 13 (10.3 µm) imagery, 2201 UTC 8 May 2022 – 0311 UTC 9 May 2022 (Click to enlarge)
The slower animation below, between 0000 UTC and 0100 UTC, highlights the cold cloud tops (west of Portand) of the system that might have produced hail. The eye is drawn to the developing cold cloud tops with the tweaked (non-default) enhancement. (By this time, having examined the imagery, I wonder about the report of the hail occurring around 5 PM; This event was also mentioned on the NWS Portland Facebook page).
GOES-17 Visible Imagery (left), Infrared (center, with default enhancement) and infrared (right, with a smaller range to the enhancement), 0000-0100 UTC on 9 May 2022 (click to enlarge)
LightningCast Probability is a product in the NOAA/CIMSS ProbSevere portfolio that predicts the likelihood of a GLM Flash Event based on a single time of the GOES-17 bands that are used in the Day Cloud Phase Distinction RGB: Bands 2 (0.64 µm), 5 (1.61 µm) and 13 (10.3 µm). The animation of that field is shown below. Contours denote probabilities of 10% (dark blue), 25% (cyan), 50% (green) and 75% (magenta). One lightning flash is shown at the of the animation; note however how the probability contours center on the strongest developing convective cell early in its lifecyle — even though it never produced lightning as detected by the GOES-17 GLM.
LightningCast Probability, 2335 UTC on 8 May 2022 – 0100 UTC on 9 May 2022 (click to enlarge)
NOAA-20 overflew the Pacific Northwest in the afternoon, with two passes over Oregon, as shown in the toggle below that also shows gridded 850-500 mb NUCAPS Lapse Rates at 1933 and 2113 UTC on 8 May. Even though the westernmost NOAA-20 has truncated data, very steep lapse rates — near 8o C/km — are evident.
Gridded 850-500 mb Lapse Rates, 1933 and 2115 UTC on 8 May 2022 (click to enlarge)
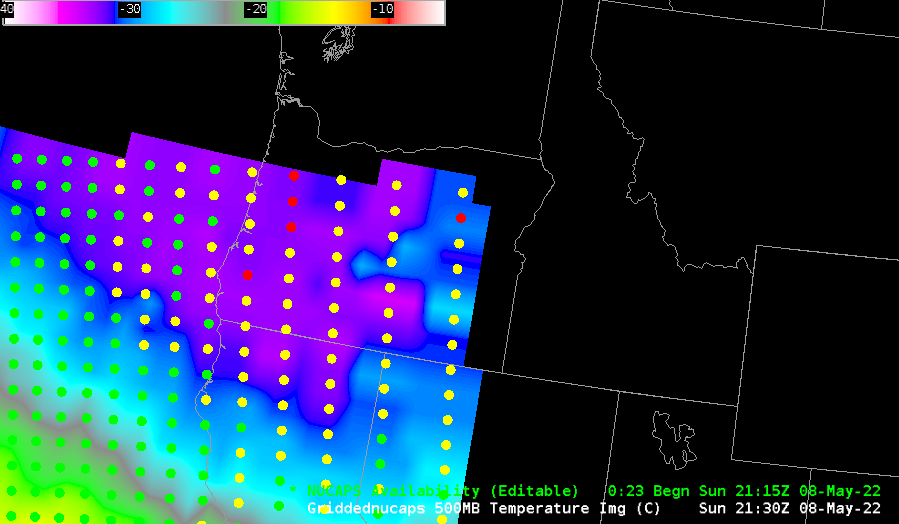
500-mb temperatures are shown below, with Portland deep within the cold air (500-mb temperatures are at/below -30o C!). The gridded fields look smooth despite the abundance of yellow and red points in the NUCAPS fields, designating regions where the infrared retrieval did not converge (yellow) or where the infrared and microwave retrievals both failed! This example shows that profiles that do not converge because of low-level clouds/moisture/rain may nevertheless produce useful upper-air information. The 2113 UTC 500-mb temperature field here, shows a red profile in the Willamette Valley in the northernmost row of profiles, and a green profile in the same row just west of the Oregon Coast. The toggle of profiles at those two points is shown below; both have useful information around 500 mb (and above) even though near-surface values in the red profile are of dubious value. Note the steep lower-tropospheric lapse rates in the sounding that is just offshore!
Gridded 500-mb Temperature derived from NUCAPS profiles, 1933 UTC and 2115 UTC on 8 May 2022 (click to enlarge)NUCAPS profiles at circled (in black) locations, 2138 UTC on 8 May 2022 (click to enlarge)
NUCAPS imagery was created with the NOAA/TOWR-S AWIPS Cloud instance. Thank you!
1-minute Mesoscale Domain Sector GOES-17 (GOES-West) Fire Temperature RGB and Shortwave Infrared (3.9 µm) along with 5-minute GOES-16 (GOES-East) Fire Power and Fire Temperature (above) displayed thermal signatures of the Calf Canyon Fire and the Cerra Pelado Fire in northern New Mexico on 08 May 2022. The Fire Temperature and Fire Power derived products are components of... Read More
GOES-17 Fire Temperature RGB (top left) and Shortwave Infrared (3.9 µm, top right), with GOES-16 Fire Power (bottom left) and Fire Temperature (bottom right) [click to play animated GIF | MP4]
1-minute Mesoscale Domain Sector GOES-17 (GOES-West) Fire Temperature RGB and Shortwave Infrared (3.9 µm) along with 5-minute GOES-16 (GOES-East) Fire Power and Fire Temperature (above) displayed thermal signatures of the Calf Canyon Fire and the Cerra Pelado Fire in northern New Mexico on 08 May 2022. The Fire Temperature and Fire Power derived products are components of the GOES Fire Detection and Characterization Algorithm FDCA.
The northern portion of the Calf Canyon Fire exhibited extreme behavior, with rapid intensification and rates of spread that led to evacuation orders being issued for 2 communities just north of Mora. That part of the fire also exhibited maximum 3.9 µm brightness temperatures of 138.71ºC — which is the saturation temperature of ABI Band 7 detectors — beginning around 1900 UTC.
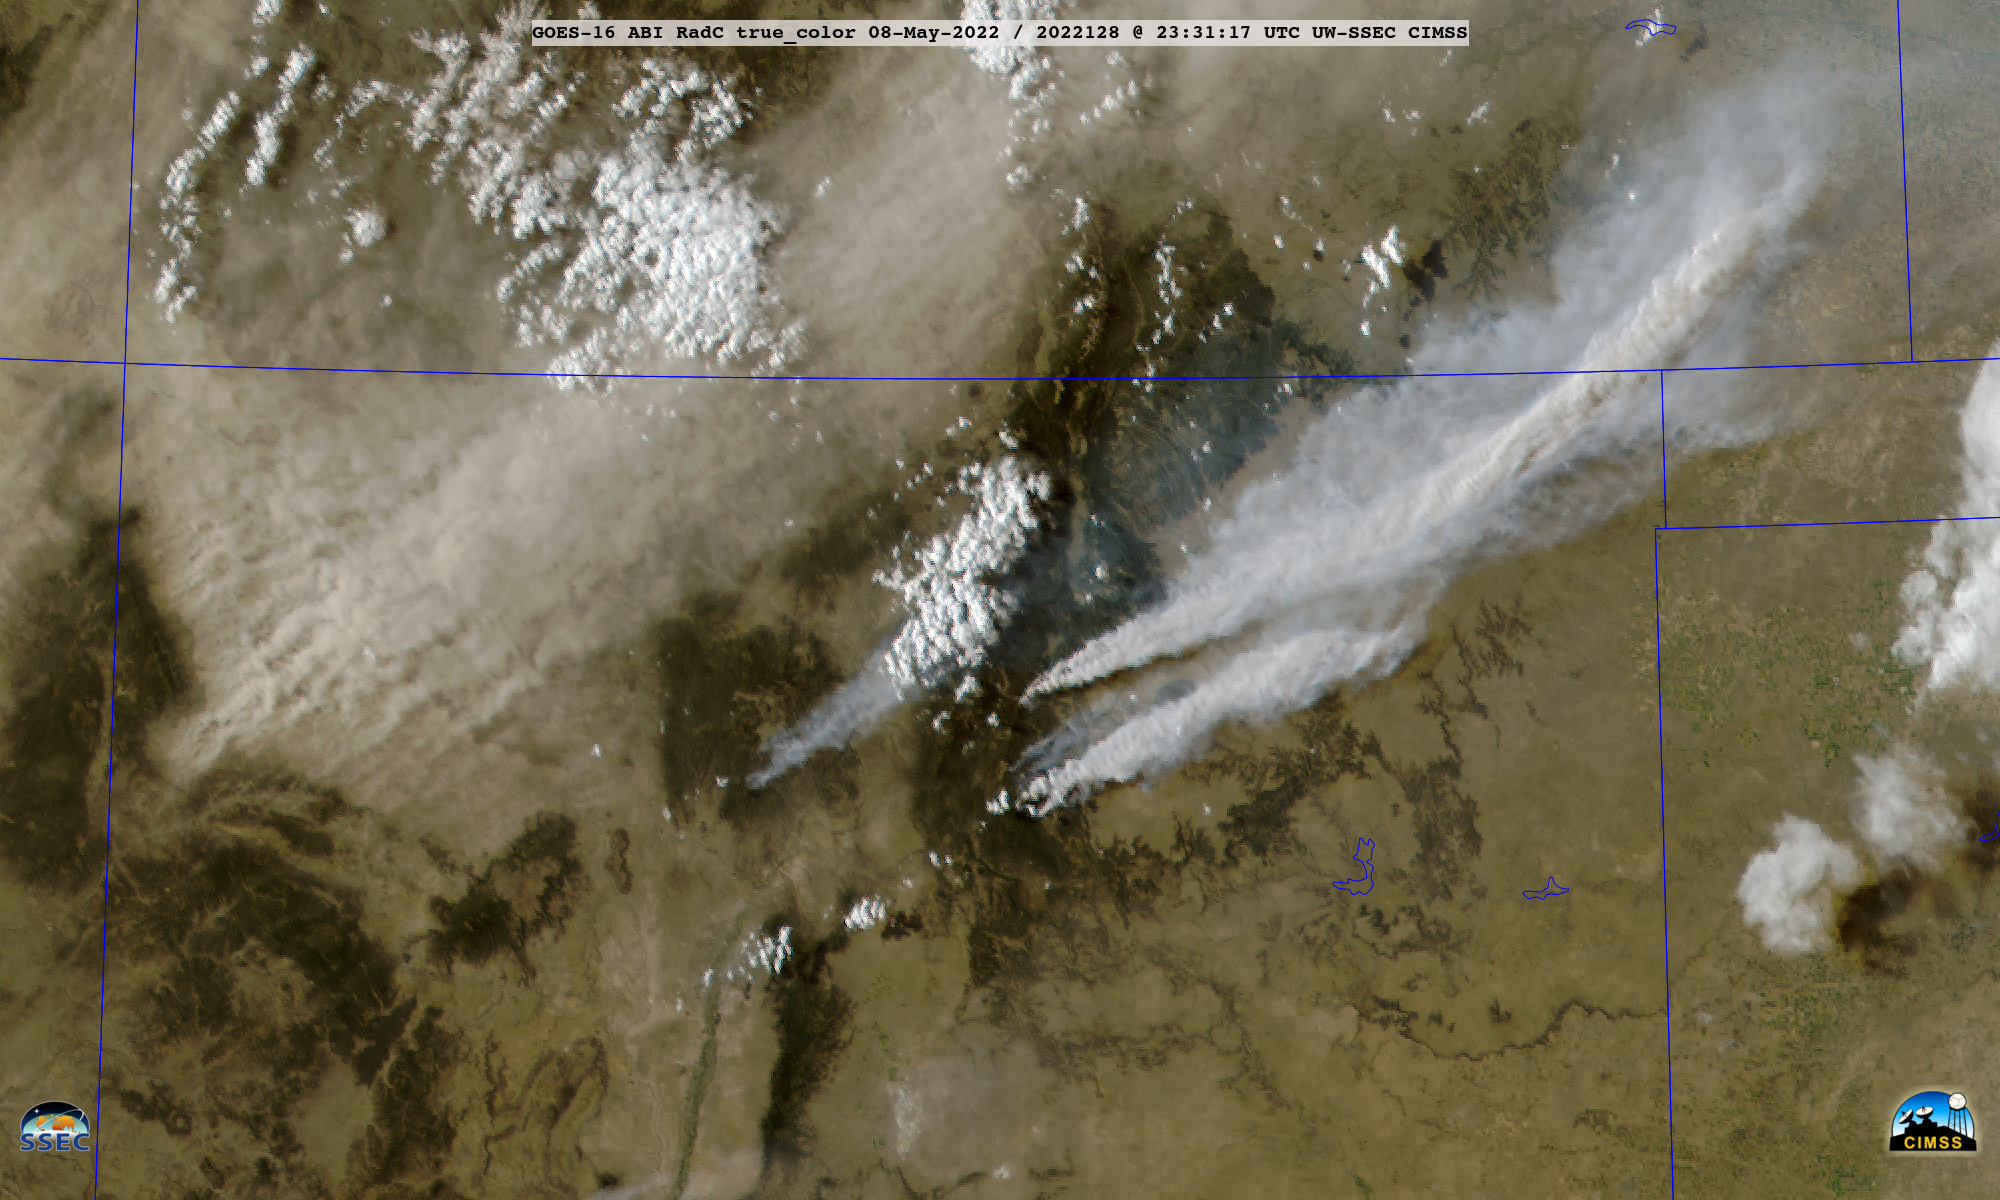
GOES-16 True Color RGB images created using Geo2Grid(below) revealed the dense smoke plumes (pale shades of white) from the the wildfires, in addition to broad plumes of blowing dust (shades of tan) originating in northwestern New Mexico — strong winds across the region aided in the rapid northeastward transport of these aerosols.
GOES-16 True Color RGB images [click to play animated GIF | MP4]
GOES-16 Split Window Difference (10.3 µm – 12.3 µm) images (below) include plots of hourly surface visibility — as the plume of blowing dust (shades of yellow to blue) from northwestern New Mexico was transported northeastward across Colorado, it appears to have played a role in reducing the visibility to as little as 2-3 miles at some locations (although local blowing dust sources may have also contributed to these low visibility values).
GOES-16 Split Window Difference (10.3 µm – 12.3 µm) images, with hourly surface visibility (miles) plotted in red [click to play animated GIF | MP4]
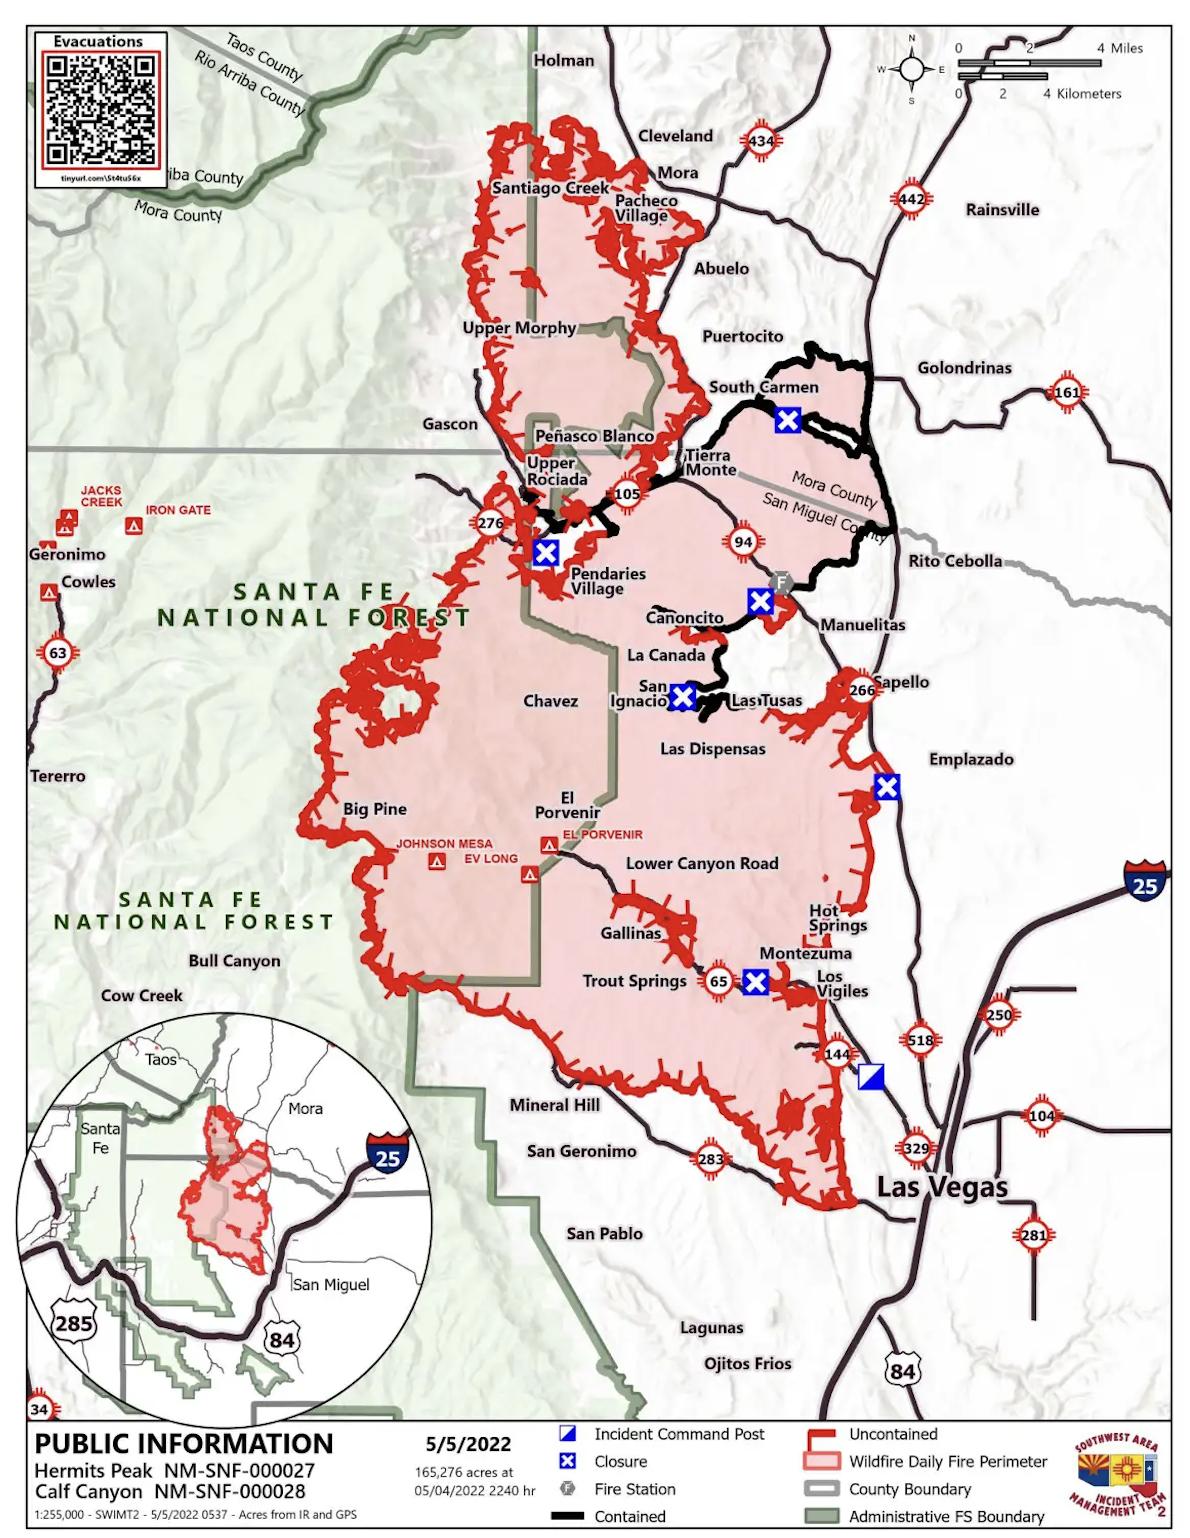
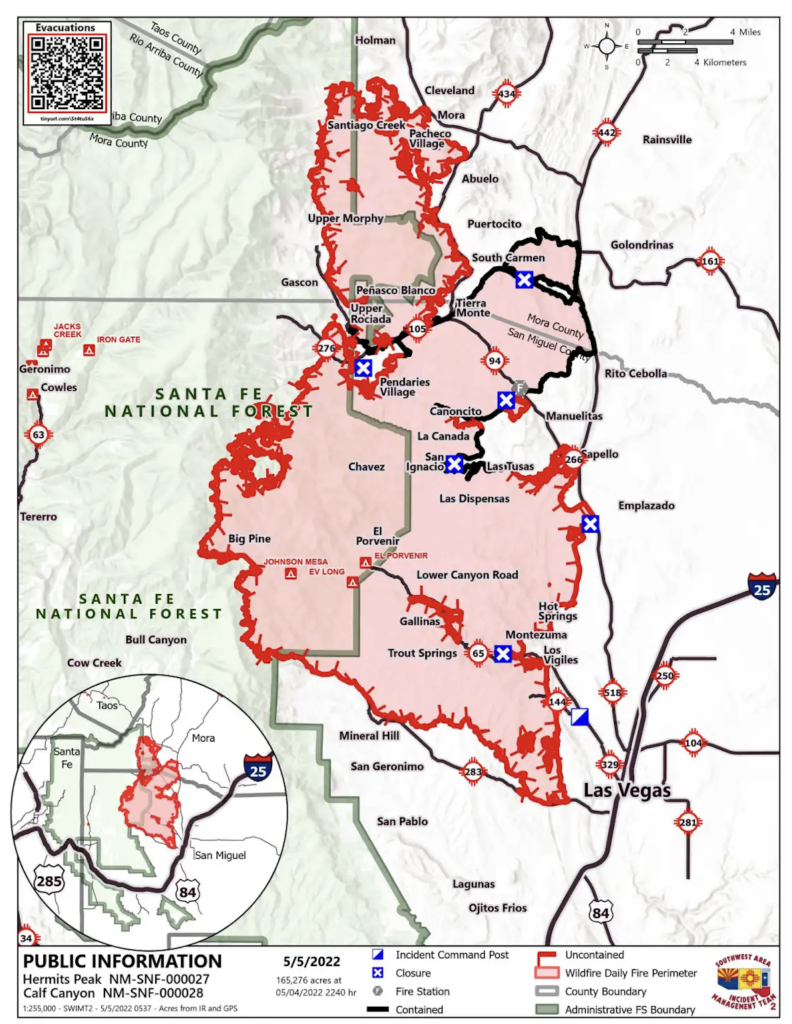
The Calf Canyon fire, which began on April 19, 2022, and the Hermits Peak fire, which began on April 6, 2022, both continue to burn in northern New Mexico. (Recently posted on the CIMSS blog here and here.) The Hermits Peak fire began as a prescribed burn under what were... Read More
The Calf Canyon fire, which began on April 19, 2022, and the Hermits Peak fire, which began on April 6, 2022, both continue to burn in northern New Mexico. (Recently posted on the CIMSS blog here and here.) The Hermits Peak fire began as a prescribed burn under what were believed to be favorable conditions. The district ranger of the Las Vegas Ranger District is quoted to have said “Our prescribed burn from last Wednesday was the cause of the Hermits Peak Fire. With that said, we take full responsibility and with a heavy heart, we are really sorry for what happened.”
The wildfires combined on April 23, 2022, but can be seen in the GOES-16 imagery below to now exist in two separate areas in western Mora and San Miguel counties.
GOES-16 visible Band 2 (0.64 micron) imagery showing wildfire burning in New Mexico from 15:51 UTC to 16:46 UTC on 05-May-2022.GOES-16 derived fire temperature overlayed on Band 2 imagery, from 15:51 UTC to 16:46 UTC on 05-May-2022.
A containment map of the Hermits Peak and Calf Canyon fires as of 05-May-2022.


