Tropical Storm Wanda
CSPP GeoSphere imagery, above, (click here for a direct link to the animation above in CSPP Geosphere; it will remain there for about 2 weeks before the data are overwritten) shows the evolution of Tropical Storm Wanda on 2 November 2021. (Wanda had transitioned to a Subtropical Storm on 31 October). Convection developed near the storm center and wrapped about halfway around the center. Dry air is also affecting this storm. A 24-hour animation of MIMIC Total Precipitable Water (from this site), below, shows an absence of deep moisture, with the driest air to the west and south.
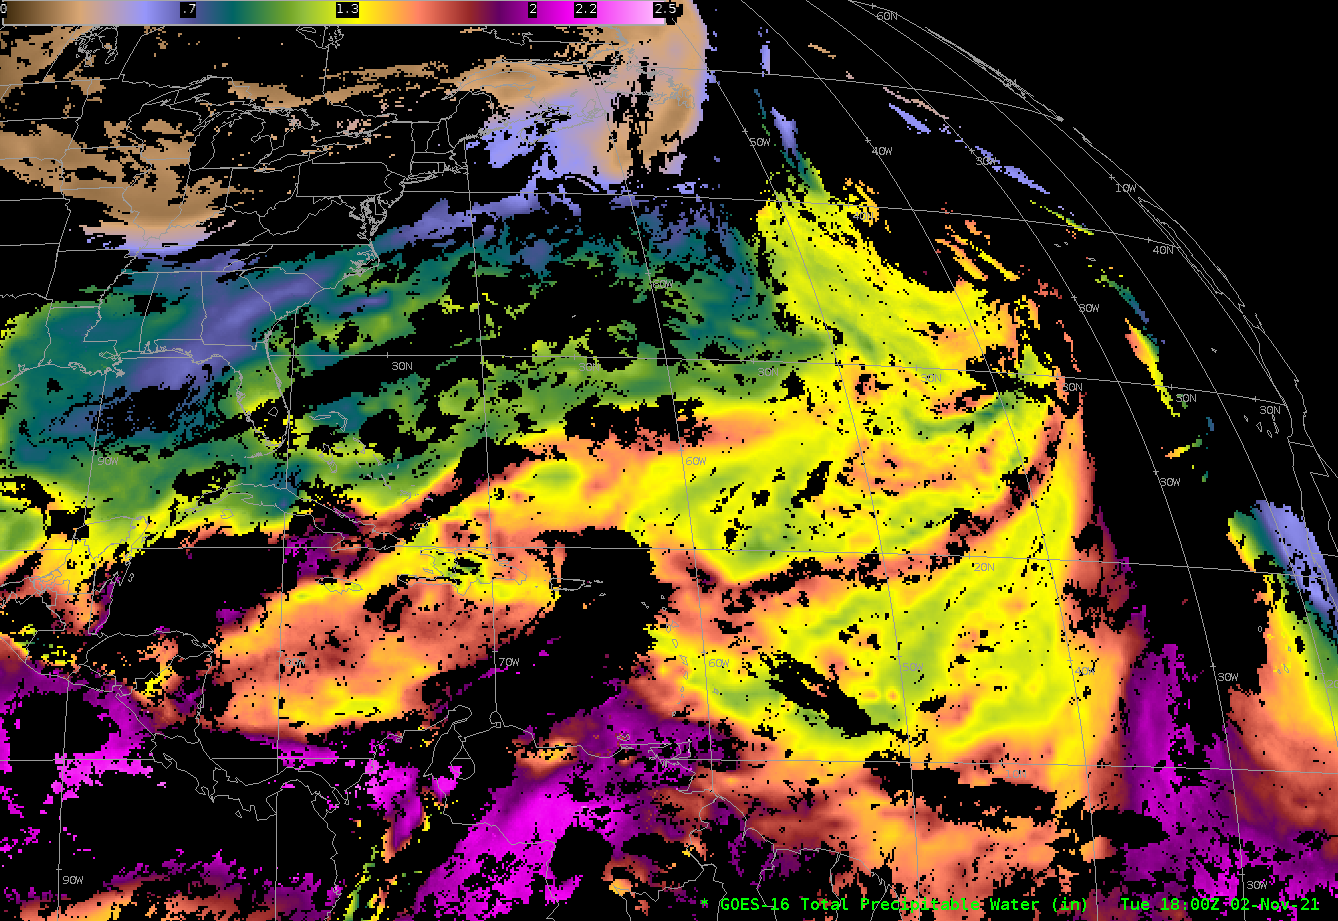
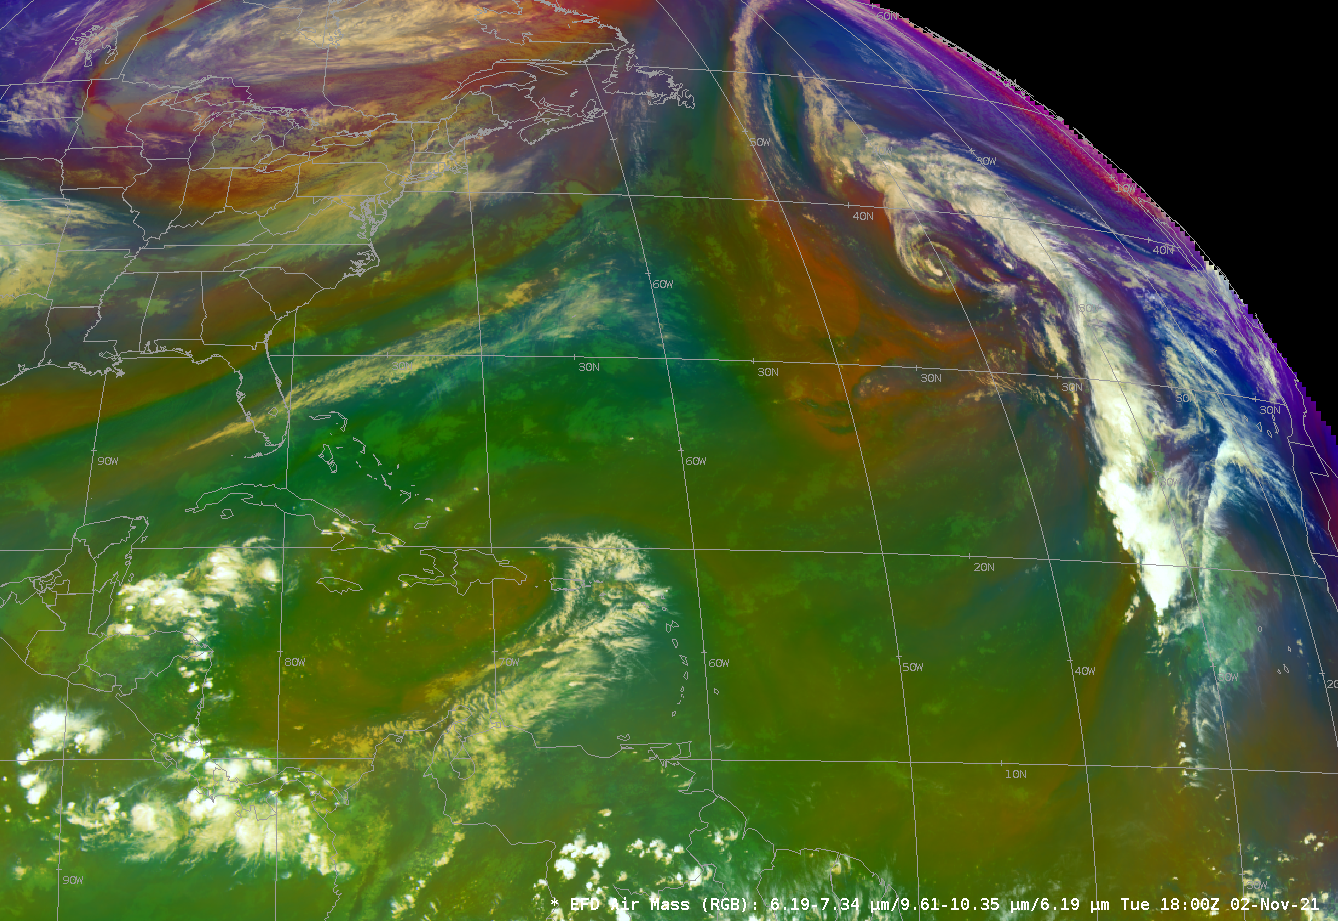
GOES Imagery also shows dry air near Wanda. Both the low-level water vapor (Band 10, 7.34 µm) and the level 2 Total Precipitable Water product (a clear-sky only product) show dry air signatures: for the water vapor imagery, orange and yellow enhancements; for the total precipitable water, yellow and green enhancements signifying values around 1.3″. The airmass RGB shows Wanda far removes from the tropical airmass that is characterized by a deep green color.