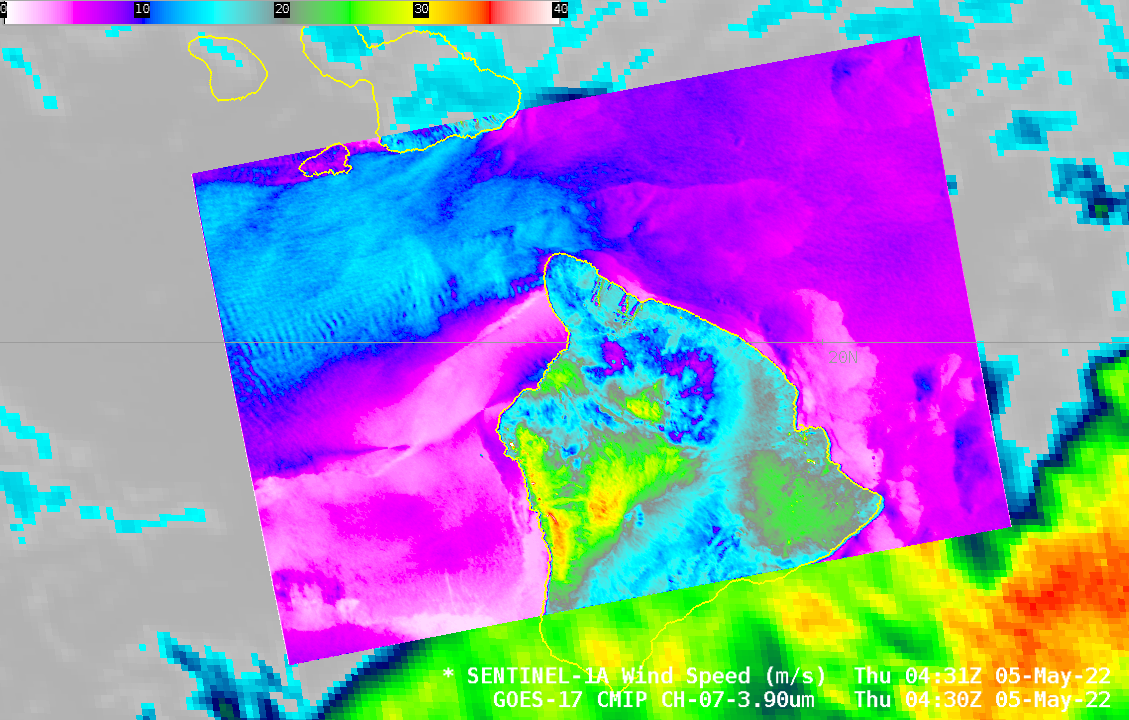

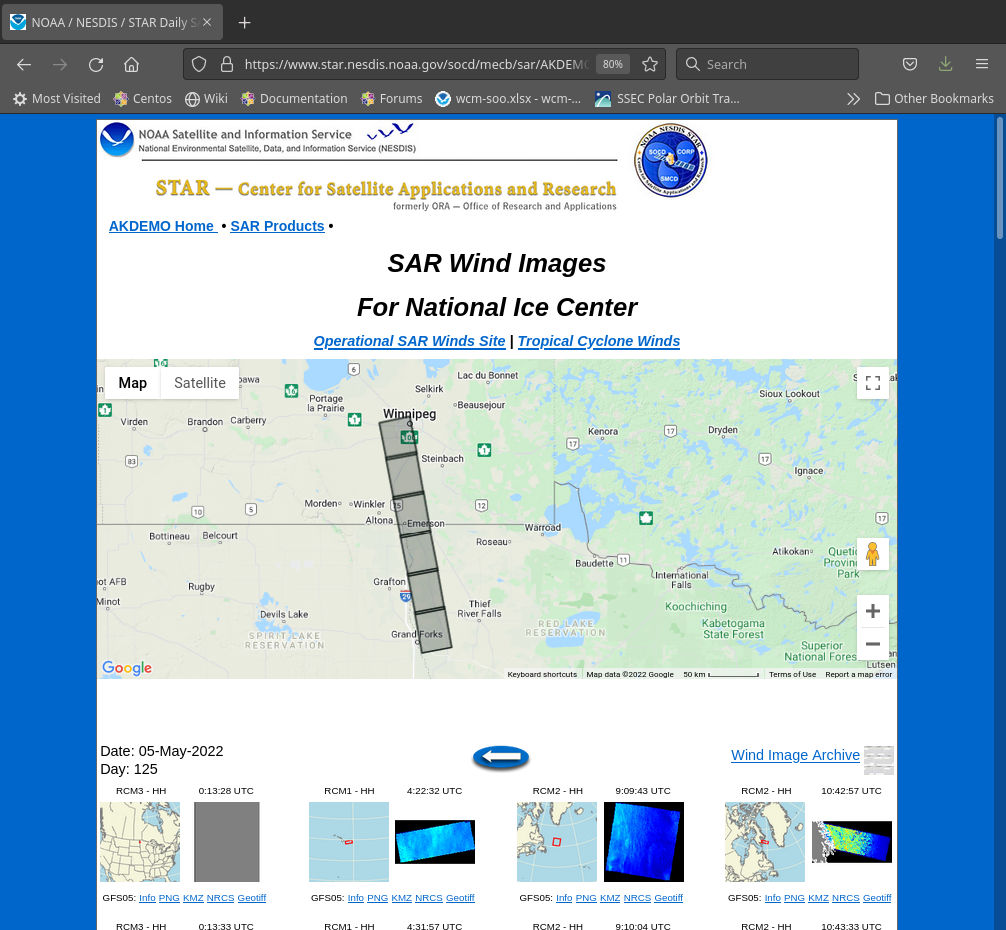
This NOAA/OSPO website shows regions where SAR data are available each day. SAR data can also be imported into AWIPS, as shown in the animation above, which animation has the SAR data overlain on top of GOES-17 Band 7 (Shortwave IR, 3.9 µm) data. Note that SAR winds are not valid over the land — the stronger returns over the islands are instead telling you something about the surface. (Compare this image to a Landsat image — there’s a good correlation!)
A zoomed-in version of the imagery over the ?Alenuih?h? Channel between the Big Island of Hawai’i and Maui is shown below as a toggle between the 3.9 µm and the winds. The significant funneling between the two islands is readily apparent, with winds increasing from about 15 knots northeast of the Big Island to closer to 25 knots within the channel.
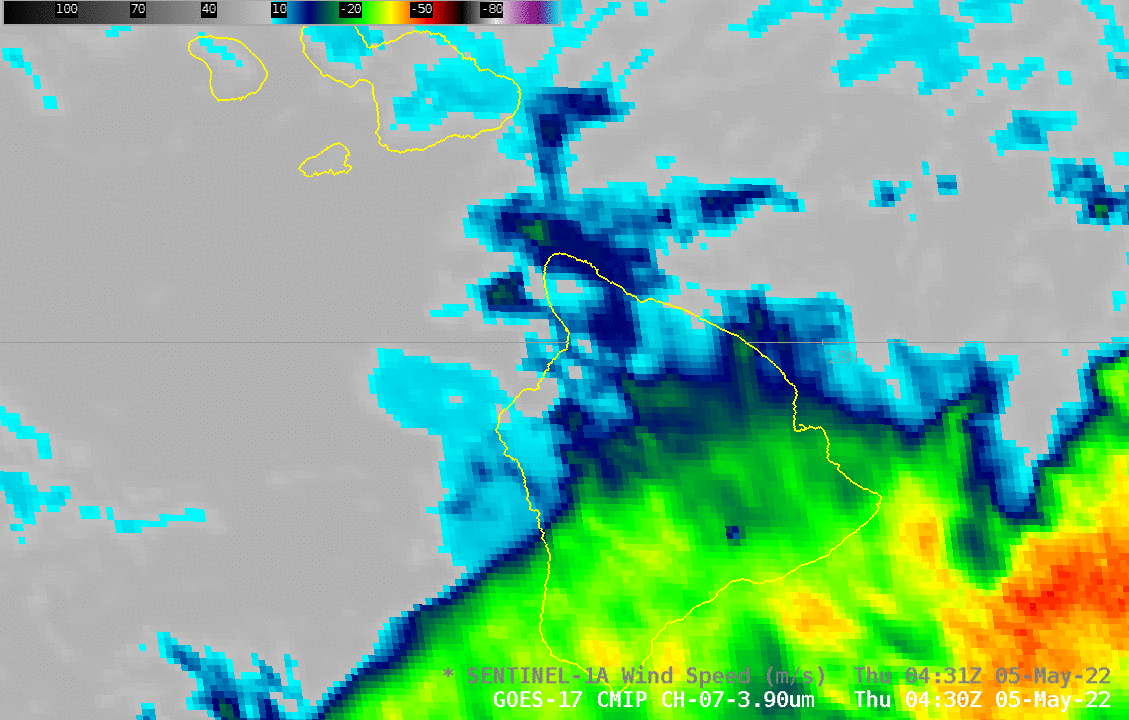
A zoom-in over Maui and Molokai, below, details winds around those islands as well, with strong winds between Molokai and Lanai, and an apparent col to the lee of Maui.
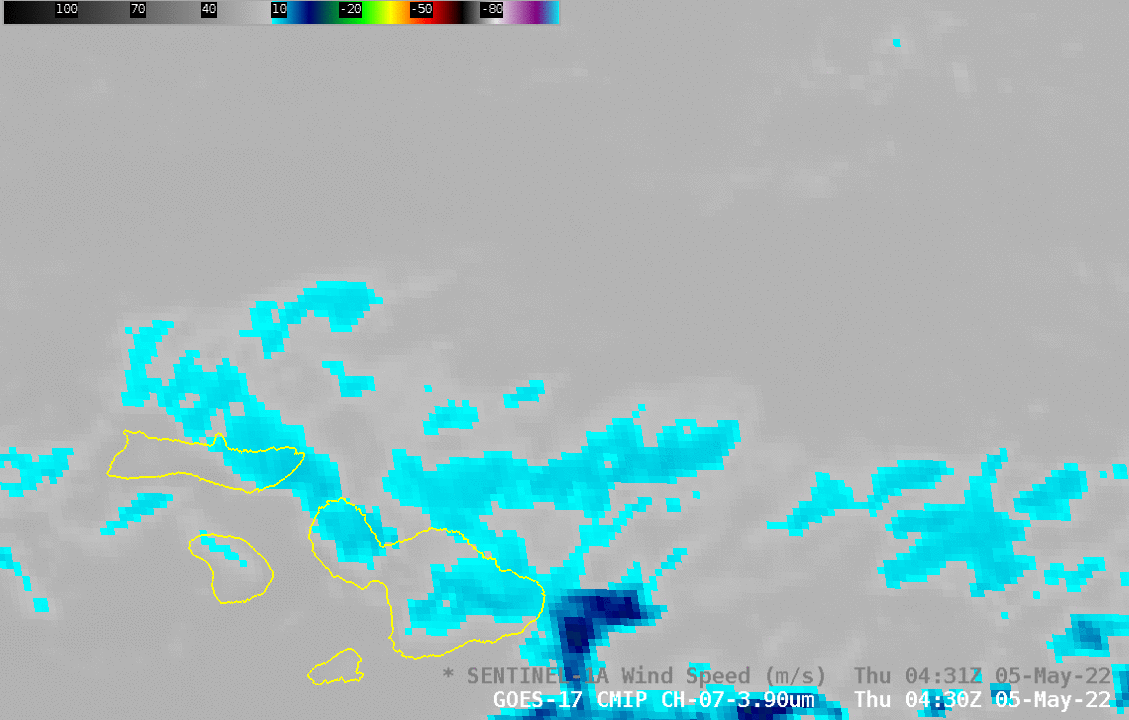
Farther north, over the open Pacific to the north of the Hawai’ian Islands, SAR data shows enhancements in wind underneath structures that are apparent in the Band 7 imagery!
View only this post Read Less


#/media/File:Island_of_Hawai'i_-_Landsat_mosaic.jpg)