GOES-18 Mid-level Water Vapor (6.9 µm) images [click to play animated GIF | MP4]
* GOES-18 images shown in this blog post are preliminary and non-operational *
Following its initial Post-Launch Test (PLT) period at 89.5°W longitude, GOES-18 reached a near-operational PLT position over the Pacific Ocean at 136.8°W longitude — and began transmitting images again at 0120 UTC on 07 June 2022. Although the first few images were contaminated with striping, a 24-hour period of Full Disk GOES-18 Mid-level Water Vapor (6.9 µm) images is shown above. A “Earth from Orbit” video (GOES-18 Goes West) was produced (with image contributions from CIRA and CIMSS), as well as this Satellite Liaison Blog post. Two sources of near-realtime GOES-18 imagery include Geostationary Satellite Images and 16-panel displays.
A sequence of GOES-18 daytime CIMSS True Color RGB and nighttime Infrared Window images — created using Geo2Grid — is shown below. A similar animation using daytime Rayleigh-corrected True Color RGB images is available here.
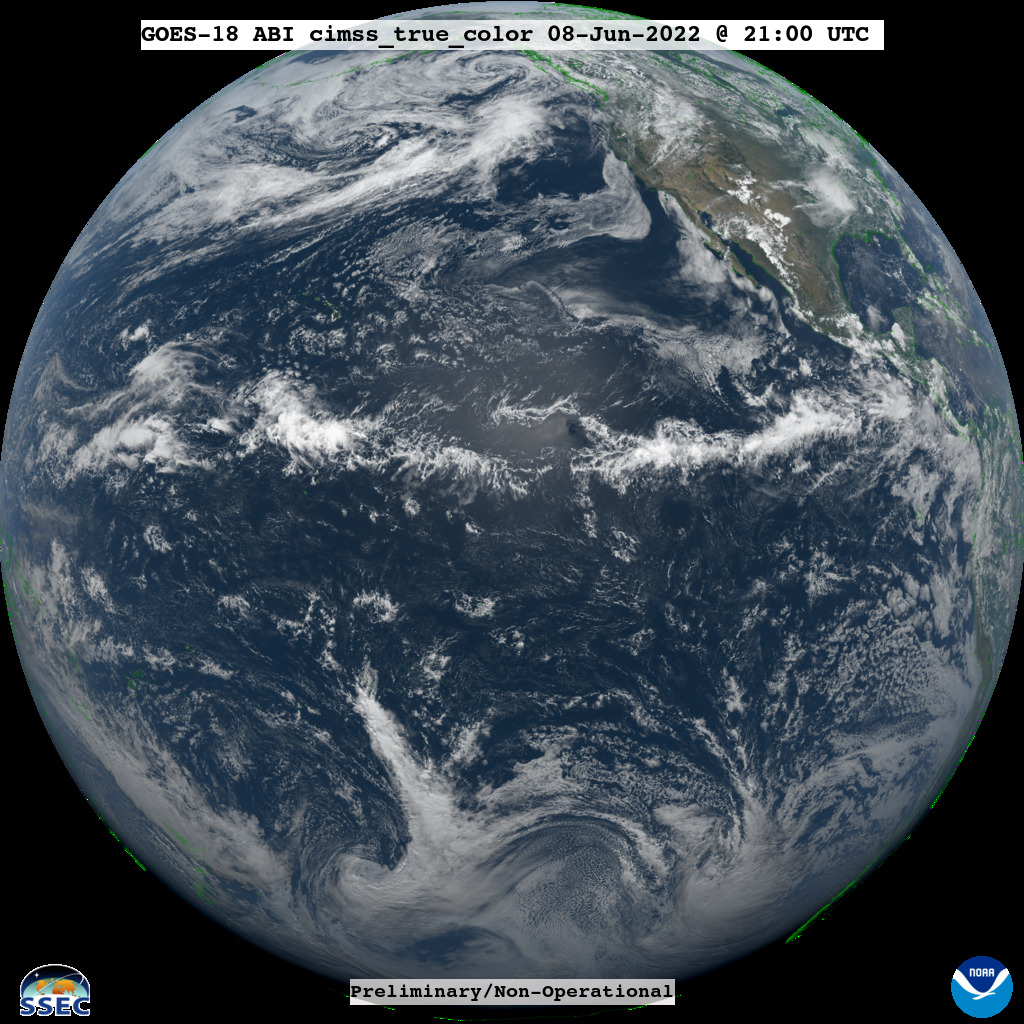
GOES-18 daytime CIMSS True Color RGB and nighttime Infrared Window images (credit: Tm Schmit, NOAA/NESDIS/ASPB) [click to play MP4 animation]
GOES-18 “Red” Visible (0.64 µm) images [click to play animated GIF | MP4]
GOES-18 “Red” Visible (0.64 µm, top) and Shortwave Infrared (3.9 µm, bottom) images [click to play animated GIF | MP4]

“Red” Visible (0.64 µm) from GOES-17 (left), GOES-18 (center) and GOES-16 (right) [click to play animated GIF | MP4]
GOES-18 “Red” Visible (0.64 µm) images (credit: Tim Schmit, NOAA/NESDIS/ASPB) [click to play MP4 animation]
===== 08 June Update =====
GOES-18 Water Vapor images (below) included plots of hourly surface wind barbs and gusts — and displayed a well-defined undular bore associated with a lee-side cold frontal gravity wave that was propagating southward through westward across Texas and New Mexico on 08 June.
GOES-18 Mid-level Water Vapor (6.9 µm) images, with plots of hourly surface wind barbs and gusts (knots) [click to play animated GIF | MP4]
View only this post Read Less

