This website works best with a newer web browser such as Chrome, Firefox, Safari or Microsoft
Edge. Internet Explorer is not supported by this website.
GOES-18 images in this blog post are preliminary and non-operationalOverlapping 1-minute Mesoscale Sectors provided GOES-18 imagery at 30-second intervals — and “Red” Visible (0.64 µm) images (above) showed the development of showers and thunderstorms across western New Mexico and far eastern Arizona on 11 June 2022.In northeastern New Mexico, another feature of interest... Read More
GOES-18 “Red” Visible (0.64 µm) images, with plots of hourly surface reports [click to play animated GIF | MP4]
GOES-18 images in this blog post are preliminary and non-operational
Overlapping 1-minute Mesoscale Sectors provided GOES-18 imagery at 30-second intervals — and “Red” Visible (0.64 µm) images (above) showed the development of showers and thunderstorms across western New Mexico and far eastern Arizona on 11 June 2022.
In northeastern New Mexico, another feature of interest was the bright reflection of sunlight from large solar panel arrays at a facility located just west of Interstate 25 in northeastern New Mexico (below). Similar to a 2019 example observed with GOES-17 in California, long vertical “stripes” emanating from the bright reflection signature — extending both northward and southward from the solar farm — were likely related to saturated ABI detector column amplifiers, due to an excess charge induced by intense sunlight reflection off the large solar panels.
GOES-18 “Red” Visible (0.64 µm) images, with plots of hourly surface reports [click to play animated GIF | MP4]
A weak line of showers moved through southern Wisconsin late in the afternoon of 10 June 2022, as depicted in the 2001 UTC toggle above of NEXRAD Composite Reflectivity and GOES-16 Day Cloud Phase Distinction RGB. What satellite-based products could be used to anticipate that line?NOAA-20 orbits over the Midwestern... Read More
GOES-16 Day Cloud Phase Distinction and Radar Composite Reflectivity, 2001 UTC on 10 June 2022 (click to enlarge)
A weak line of showers moved through southern Wisconsin late in the afternoon of 10 June 2022, as depicted in the 2001 UTC toggle above of NEXRAD Composite Reflectivity and GOES-16 Day Cloud Phase Distinction RGB. What satellite-based products could be used to anticipate that line?
NOAA-20 orbits over the Midwestern United States on 10 June (shown here, from this site) were configured such that NUCAPS profiles over Wisconsin were derived from two consecutive passes. The toggle below shows derived Total Precipitable Water at ca. 1730 and 1930 UTC. Dry air over northeastern Wisconsin is abutted by greater values of total precipitable water over the southern part of the state.
Gridded NUCAPS estimates of Total Precipitable Water for two times on 10 June 2022. NUCAPS Sounding Points are also shown (Click to enlarge)
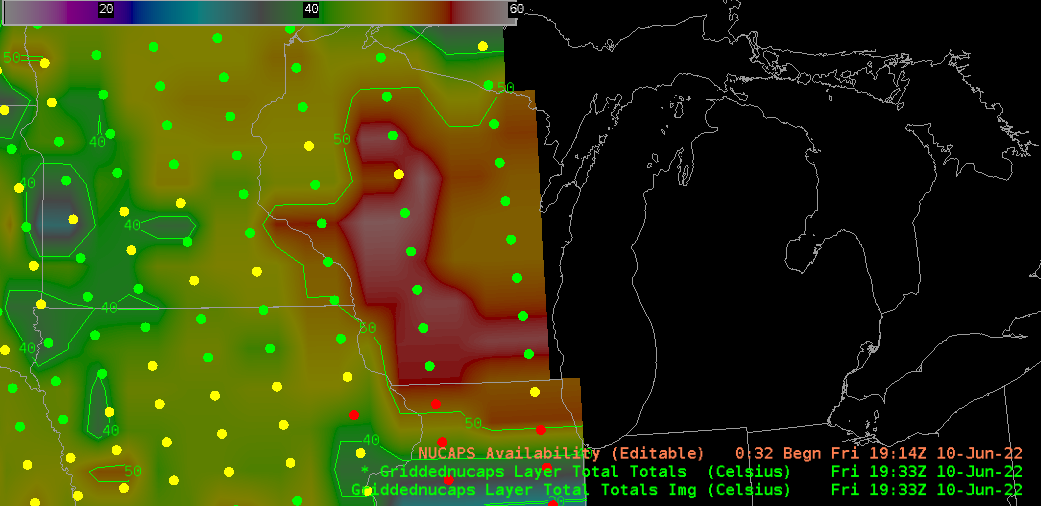
Data from NUCAPS profiles can also be used to compute various stability indices, including the Total Totals index, which is shown below from the two passes. Note in particular the gradient in the index over southern Wisconsin at 1930 UTC: a corridor of instability is present, and it is focused in that location mostly because of dryer air to the northeast (click here to view 850-mb Mixing Ratio from gridded NUCAPS at 1730 and 1930 UTC). In addition, diagnosed mid-level Lapse Rates (in this case, 700-500 mb) at 1930 UTC (shown below) show values between 7 and 8 oC/km. (Note to AWIPS Users: Gridded NUCAPS Total Totals index values can be accessed via the Product Browser, under ‘Grids’)
Total Totals index, 1751 UTC and 1933 UTC, 20 June 2022 (Click to enlarge)700-500 mb Lapse Rates, 1930 UTC on 10 June 2022 (click to enlarge)
ProbSevere LightningCast (link) is a forecast aid created to diagnose (from ABI imagery) the probability that a GLM Lightning observation will occur in the next 60 minutes. It can also alert a forecaster to developing convection, because the satellite signatures that suggest lightning might occur in the next 60 minutes often occur before radar observations of convection. The animation below shows LightningCast at 15-minute time steps, from 1800 to 2000 UTC on 10 June. Note how LightningCast keys on the developing line of cumulus long before showers develop (and more than 30 minutes before lightning occurs!)
LightningCast probabilitt readout, 1800 – 2000 UTC on 10 June 2022 (Click to enlarge)
The animation below shows GOES-16 Day Cloud Phase Distinction overlain with Geostationary Lightning Mapper (GLM) Minimum Flash Area (MFA) observations, from 2001 – 2316 UTC. Consider the smallest MFA values (in yellow) to represent vigorous, new updrafts. Larger MFA (green) are more likely in the anvil.
GOES-16 Day Cloud Phase Distinction RGB, and GLM Observations of Minimum Flash Area, 2001 – 2316 UTC on 10 June 2022 (click to enlarge)
NUCAPS and ProbSevere LightningCast added to Situational Awareness for this event.
Some imagery in this Blog Post was created using the NOAA/TOWR-S AWIPS Cloud Instance. Thank you!
The second week of the Hazardous Weather Testbed (here is the blog site) ran 6-10 June 2022, and this blog post will discuss one or two of the events that happened this week. I was away from the Testbed on the first two days, and day #4 was not an active day for severe... Read More
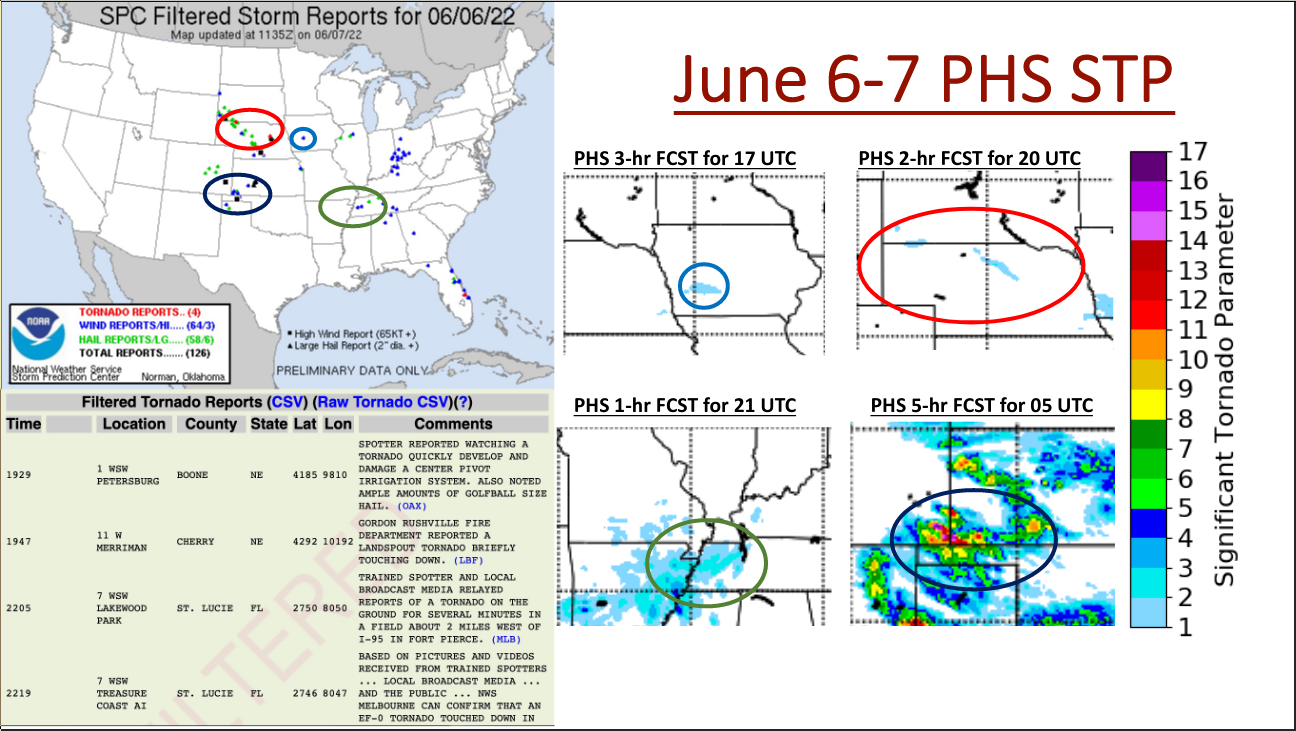
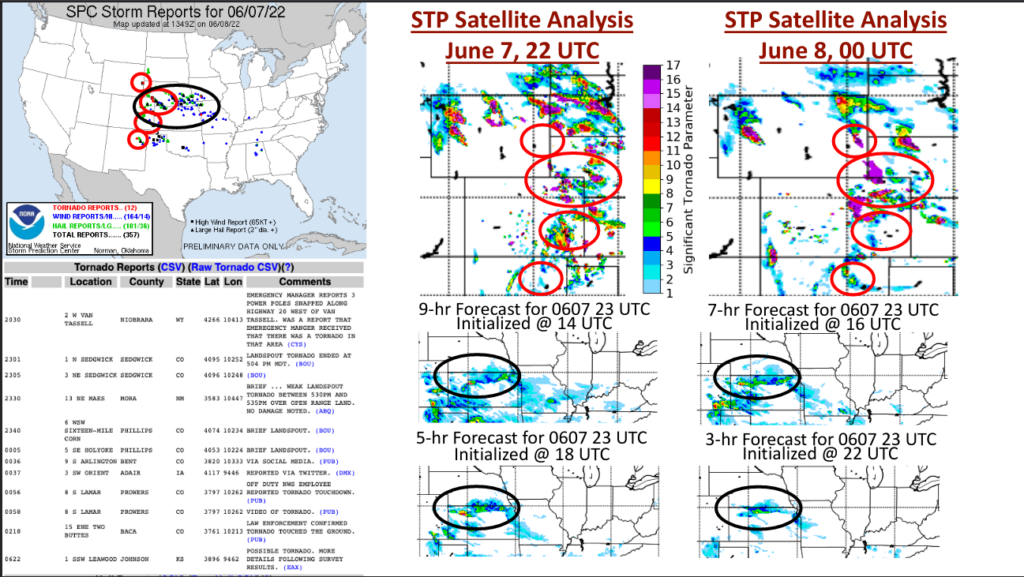
The second week of the Hazardous Weather Testbed (here is the blog site) ran 6-10 June 2022, and this blog post will discuss one or two of the events that happened this week. I was away from the Testbed on the first two days, and day #4 was not an active day for severe weather during the Testbed hours. The daily maps that summarize the short-term forecasts and the observed severe weather (courtesy Bill Smith, Sr) are shown below. On all days, the STP forecasts and analyses overlapped the region of severe weather.
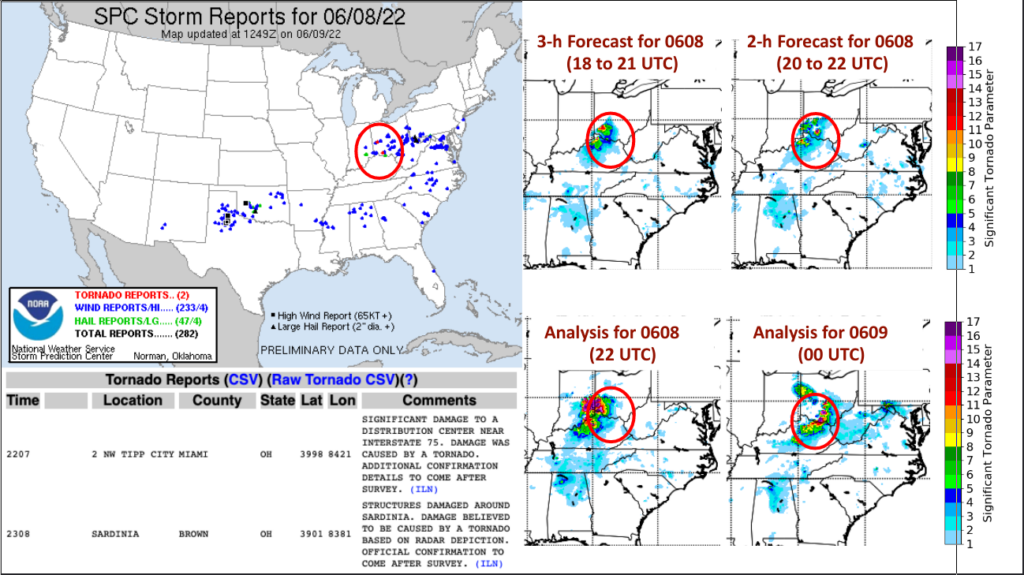
Forecasts of Significant Tornado Parameter (STP) from different forecast runs (1400, 1800, 2000, 0000) and observed severe weather associated with STP forecasts, Monday 6 June 2022 (Click to enlarge)Forecasts of Significant Tornado Parameter (STP) from different forecast runs (1400, 1800, 1800, 2200) and observed severe weather associated with STP forecasts, Tuesday 7 June 2022 (Click to enlarge)Forecasts of Significant Tornado Parameter (STP) from different forecast runs (1800, 2000) and observed severe weather associated with STP forecasts, Wednesday 8 June 2022 (Click to enlarge)
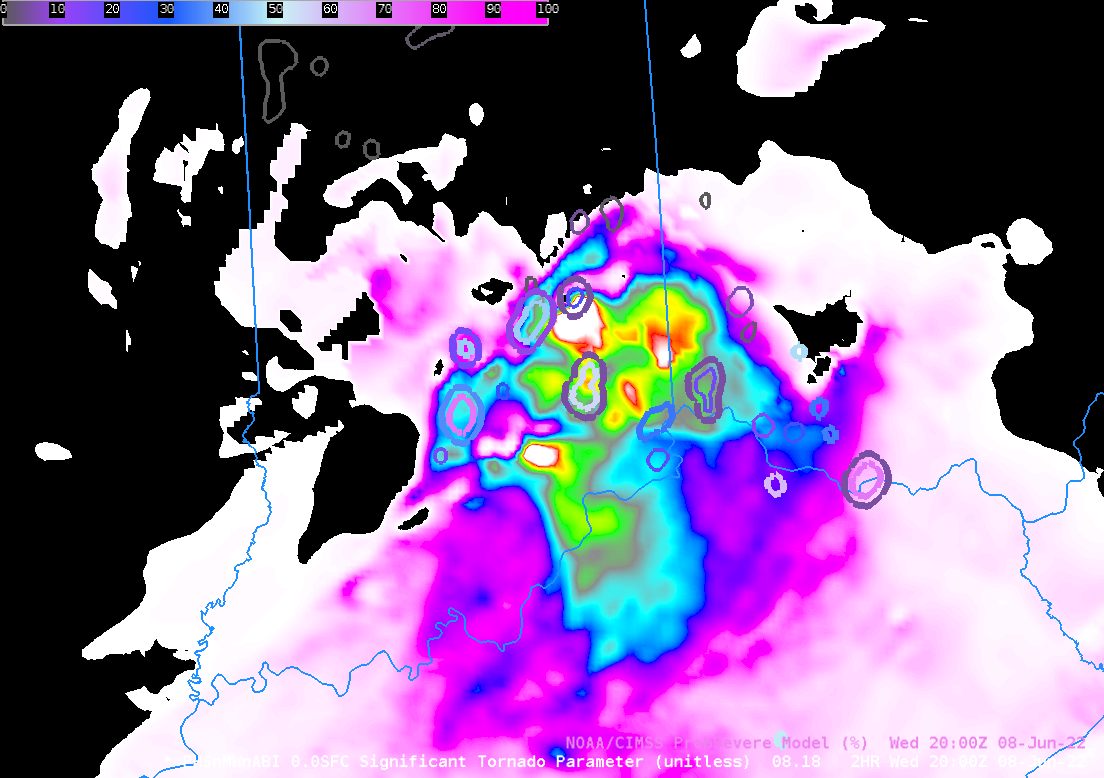
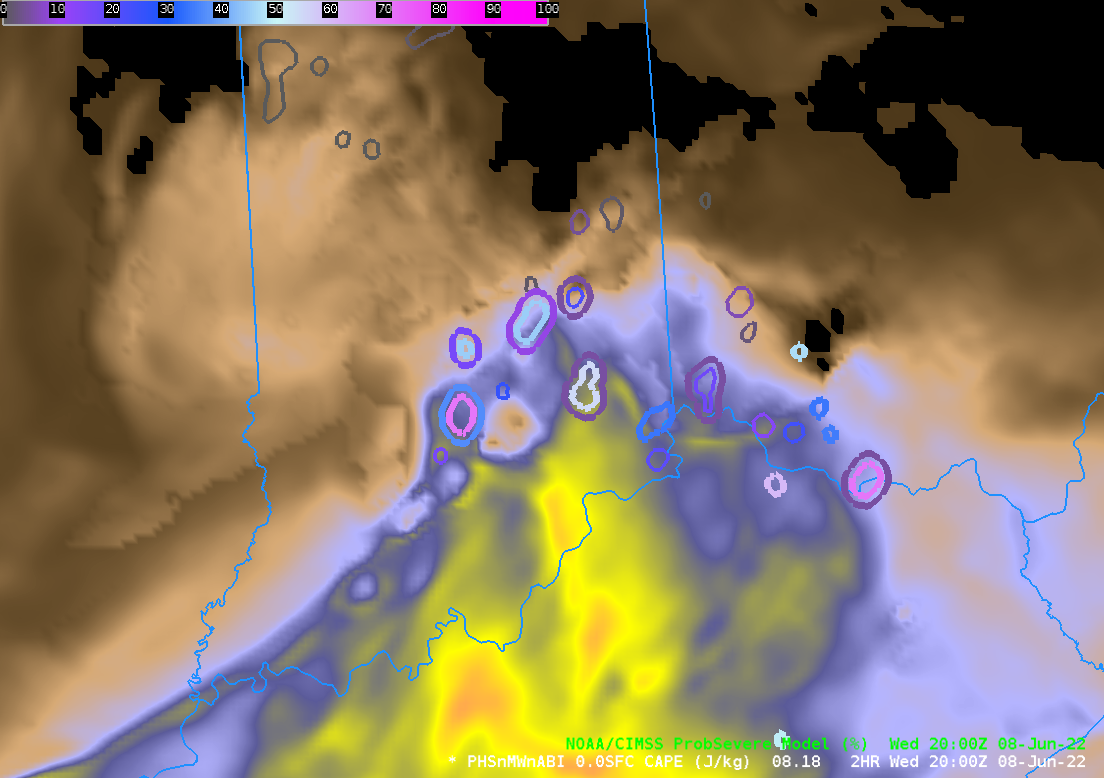
Wednesday’s STP example over southeast Indiana was one of the better predictions of the week (and it’s also discussed in this HWT blog post). The ProbSevere objects contours are surrounding maxima in the STP field. As during week 1, there were many examples that showed ProbSevere signals along the perimeter of large MUCAPE values (Most Unstable Convective Available Potential Energy; that is — in the MUCAPE gradient). Here’s an example from 2000 UTC on 8 June 2022 (the same time as the image below).
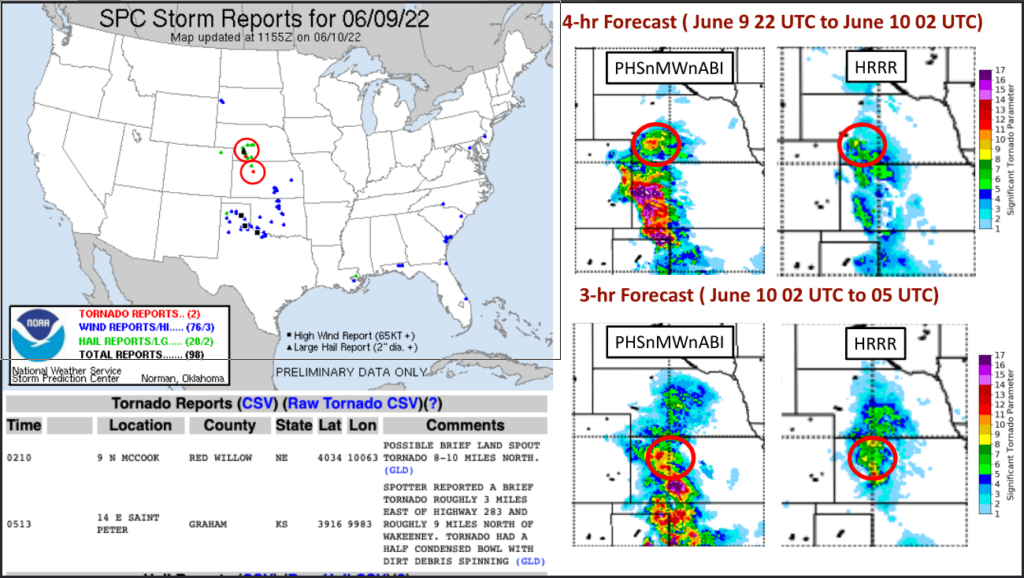
2-h forecast of STP valid at 2000 UTC on 8 June 2022, along with ProbSevere contours valid at 2000 UTC (Click to enlarge)Forecasts of Significant Tornado Parameter (STP) from different forecast runs (2200 UTC and later) and observed severe weather associated with STP forecasts, Thursday 9 June 2022 (Click to enlarge); severe weather on this day mostly occurred after HWT activities ended.
As with Week 1, forecasters found great utility in using PHSnABI model output in anticipating where convection might form; that is, it was most useful in the pre-convective environment, and forecasters found 0-4h forecasts most useful.
Even though GOES-18 is currently preliminary, non-operational, ABI 16-panels are being generated for both the Full Disk and “PACUS” (Pacific US) sectors. GOES-18 arrived near the GOES-West position to continue post-launch checkout on June 6, 2022 and the ABI was started scanning early (UTC time) on June 7. To access the images, select “GOES-18”, choose a... Read More
Even though GOES-18 is currently preliminary, non-operational, ABI 16-panels are being generated for both the Full Disk and “PACUS” (Pacific US) sectors. GOES-18 arrived near the GOES-West position to continue post-launch checkout on June 6, 2022 and the ABI was started scanning early (UTC time) on June 7. To access the images, select “GOES-18”, choose a Region (sector), and “16Panel” for the parameter. (GOES-16 and GOES-17 are available as well). The sector choices are called “CONUS” and “Full Disk” but for GOES in the West location the CONUS sector is often referred to as “PACUS” since it includes the NE Pacific Ocean and western part of the contiguous United States (plus Hawaii).
NOAA and NASA recently released the first ABI (Advanced Baseline Imager) imagery from GOES-18 (including this 2-min video). GOES-T was launched on March 1st and both GOES-16 and GOES-17 monitored the rocket signature. GOES-18 is the third in the GOES-R series and is currently located at approximately 136.8W, having been relocated from its initial geostationary checkout position at 89.5W. GOES-18 is slated to become NOAA’s operational GOES-West in early 2023 after going through many tests. Before that, the ABI on GOES-18 will become the operational imager during two GOES-17 Loop Heat Pipe times. Also see this satellite liaison post. Also see these other GOES-18 related blog posts.
Thanks to the many (thousands) who made the GOES-18 ABI possible. These GOES-18 ABI are early images (preliminary and non-operational, calibration improvements are possible. McIDAS-X software was used in generating these images. More about GOES-16 and GOES-17.


