This website works best with a newer web browser such as Chrome, Firefox, Safari or Microsoft
Edge. Internet Explorer is not supported by this website.
GOES-18 images in this blog post are preliminary and non-operational Overlapping 1-minute Mesoscale Sectors provided 30-second GOES-18 Water Vapor, Near-Infrared and Shortwave Infrared images (above) that revealed thermal signatures of the SpaceX launch of the SARah-1 Mission from Vandenberg Space Force Station in California at 14:19:00 UTC on 18 June... Read More
GOES-18 Water Vapor, Near-Infrared and Shortwave Infrared images [click to play animated GIF | MP4]
GOES-18 images in this blog post are preliminary and non-operational
Overlapping 1-minute Mesoscale Sectors provided 30-second GOES-18 Water Vapor, Near-Infrared and Shortwave Infrared images (above) that revealed thermal signatures of the SpaceX launch of the SARah-1 Mission from Vandenberg Space Force Station in California at 14:19:00 UTC on 18 June 2022.
GOES-18 Water Vapor, Near-Infrared and Shortwave Infrared images at 14:21:55 UTC [click to enlarge]
Signatures of Falcon 9’s Stage 1 booster were seen immediately post-launch (for example, at 14:21:55 UTC, above), as well during its “entry burn” to initiate a launch site landing (at 14:26:25 UTC, below).
GOES-18 Water Vapor, Near-Infrared and Shortwave Infrared images at 14:26:25 UTC [click to enlarge]
Of particular interest was the brief expansion of hot water vapor and CO2 produced by initiation of the Stage 1 “boostback burn” (as seen in Water Vapor and Shortwave Infrared images at 14:22:55 UTC, below).
GOES-18 Water Vapor, Near-Infrared and Shortwave Infrared images at 14:22:55 UTC [click to enlarge]
Plume RGB images (below) provided an integrated view of the rocket booster’s hot/bright thermal signature as well as the expanding cloud of water vapor / CO2.
Plume RGB images [click to play animated GIF | MP4]
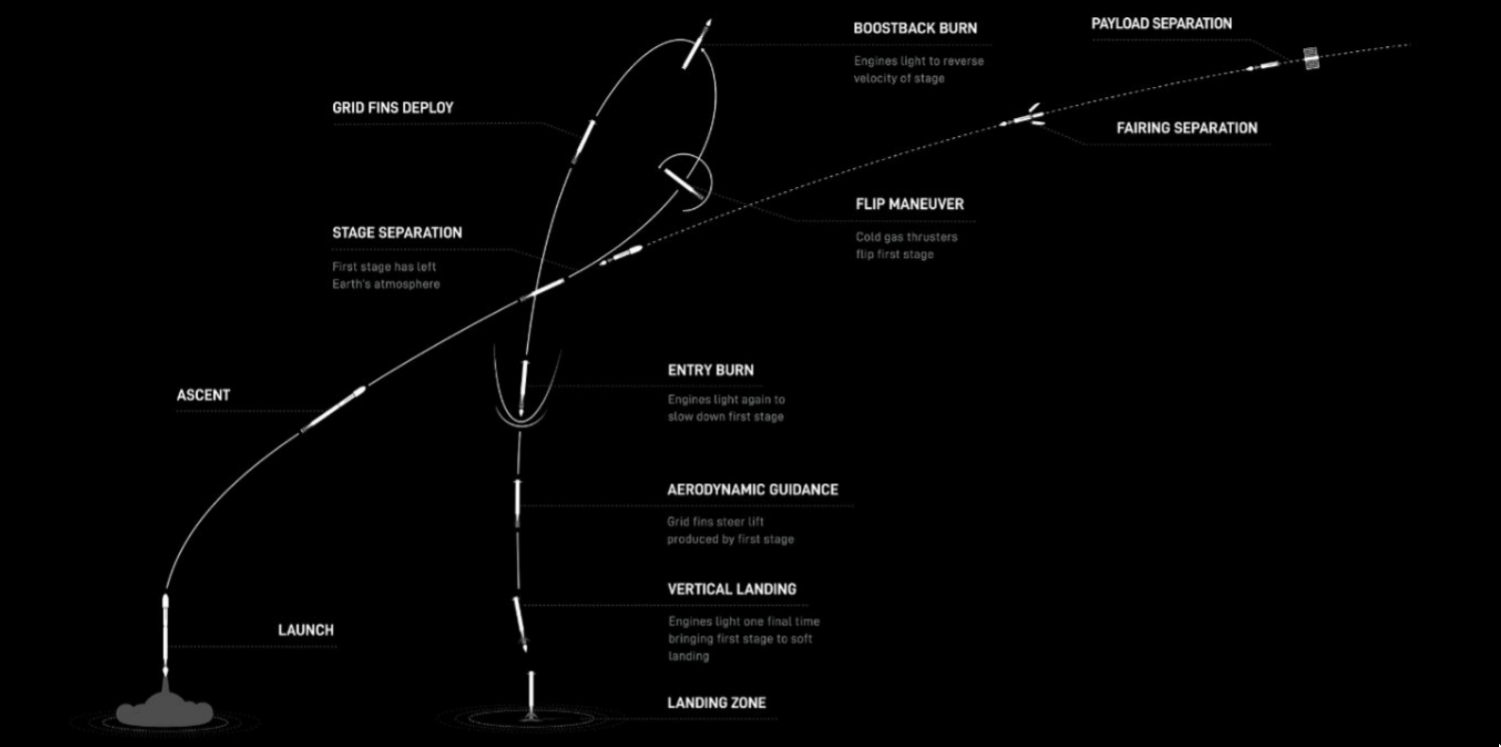
A schematic of the Stage 1 trajectory is shown below.
Schematic of Falcon 9 Stage 1 booster rocket trajectory [click to enlarge]
Kudos to Todd Beltracci, The Aerospace Corporation, for providing a heads-up on this rocket launch.
With the help of NASA, private industry and others, NOAA’s GOES-2 (as GOES-B) was launched on June 16, 1977. Similar to SMS-1/2 and GOES-1/3, there were 2 spectral bands: one visible and one longwave infrared. A still image with a map overlay is also available to provide geo-referencing for the images... Read More
With the help of NASA, private industry and others, NOAA’s GOES-2 (as GOES-B) was launched on June 16, 1977. Similar to SMS-1/2 and GOES-1/3, there were 2 spectral bands: one visible and one longwave infrared.
GOES-2 Visible (left) and Infrared (right) spectral bands from June 16, 1978 over the Eastern portion of the U.S.
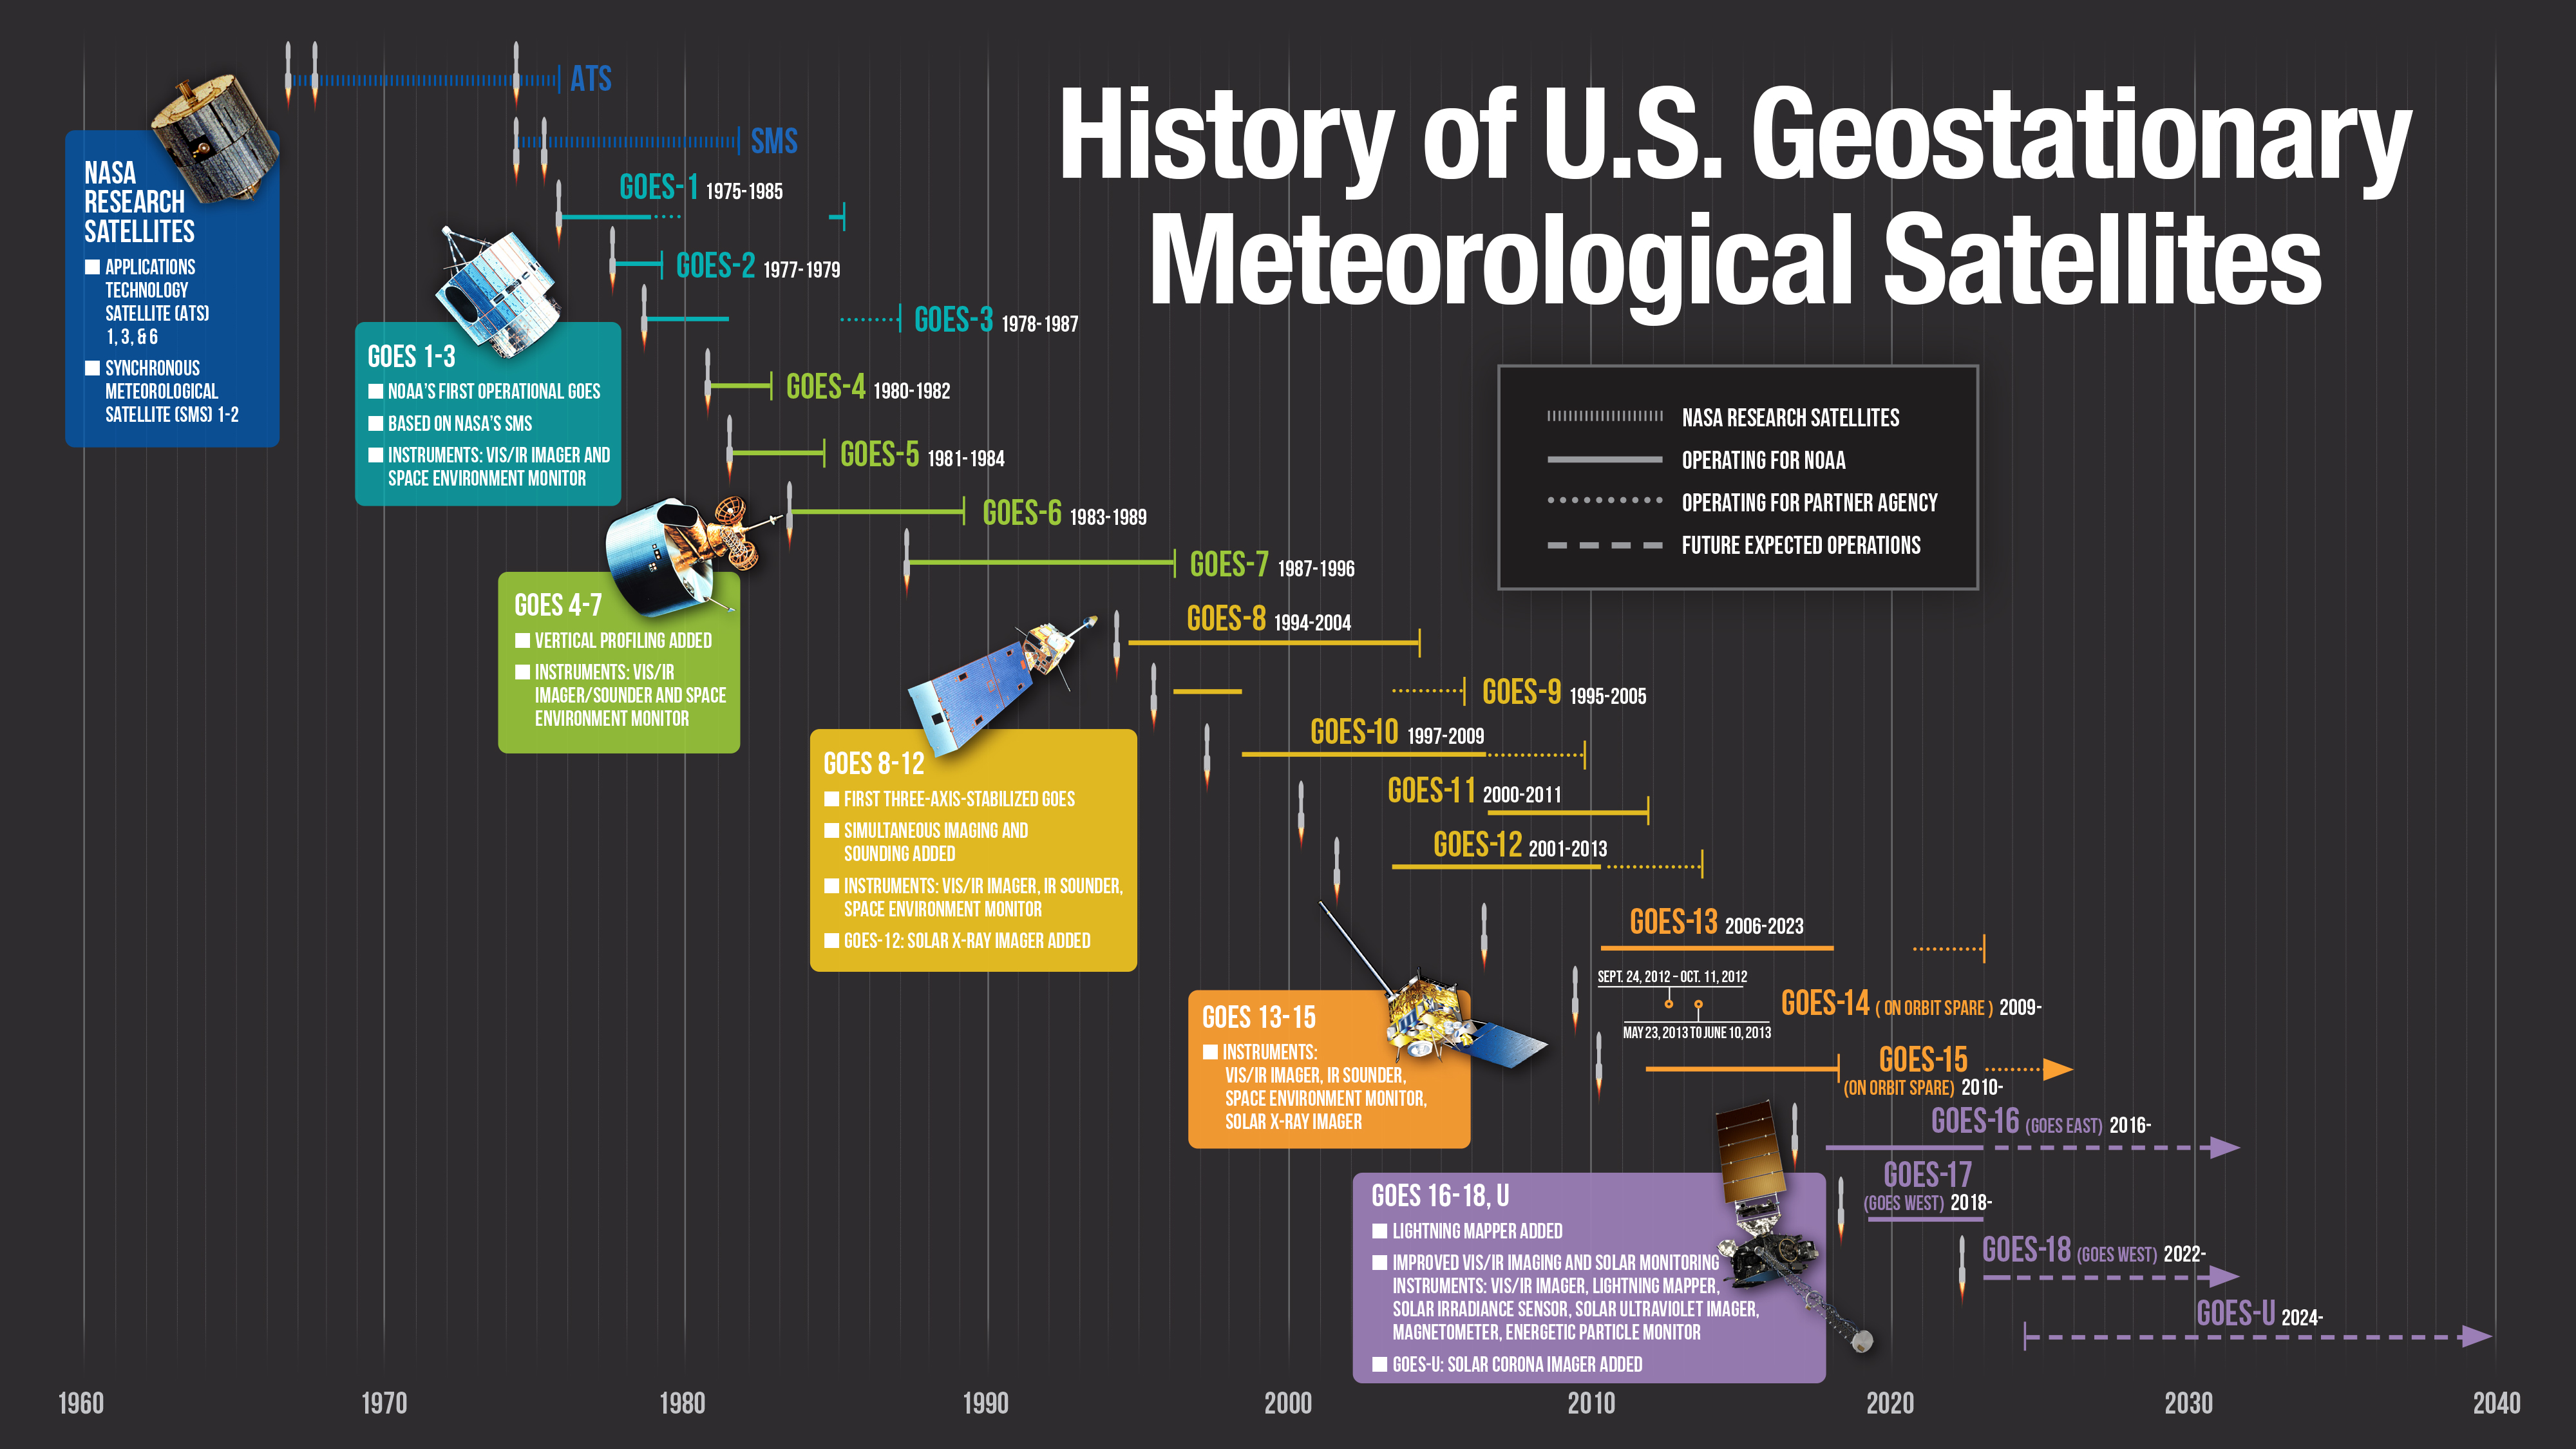
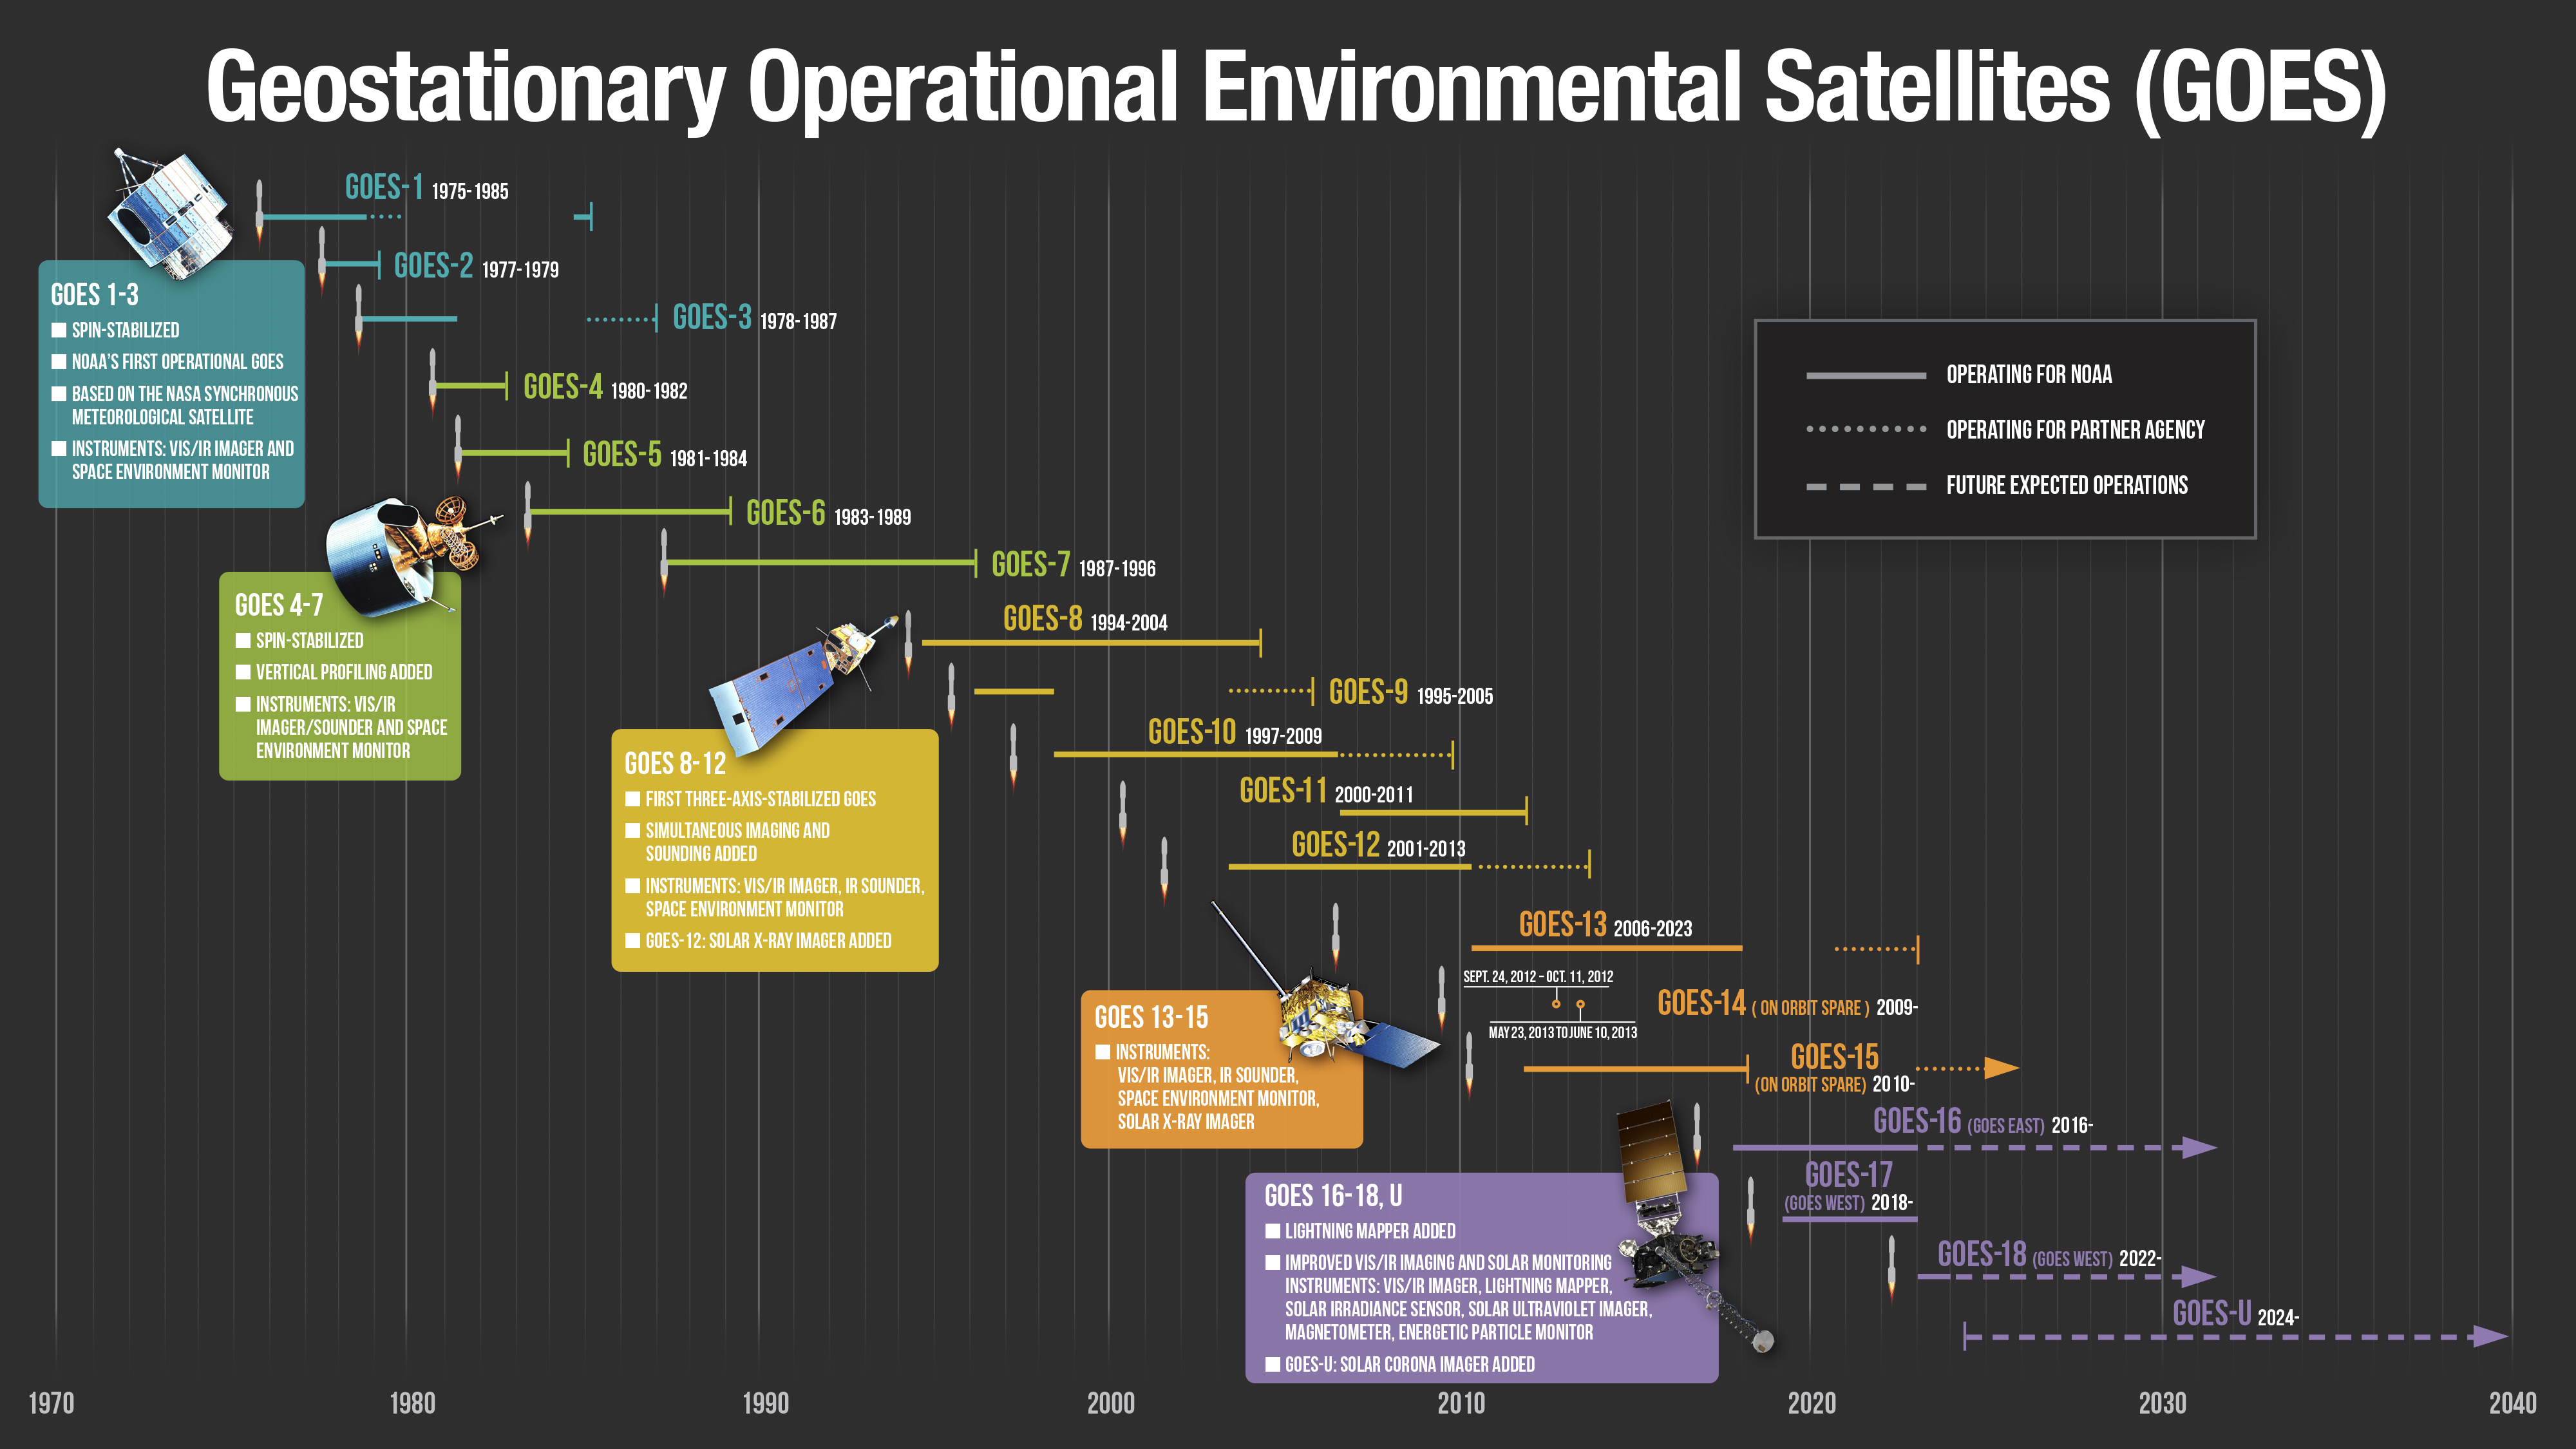
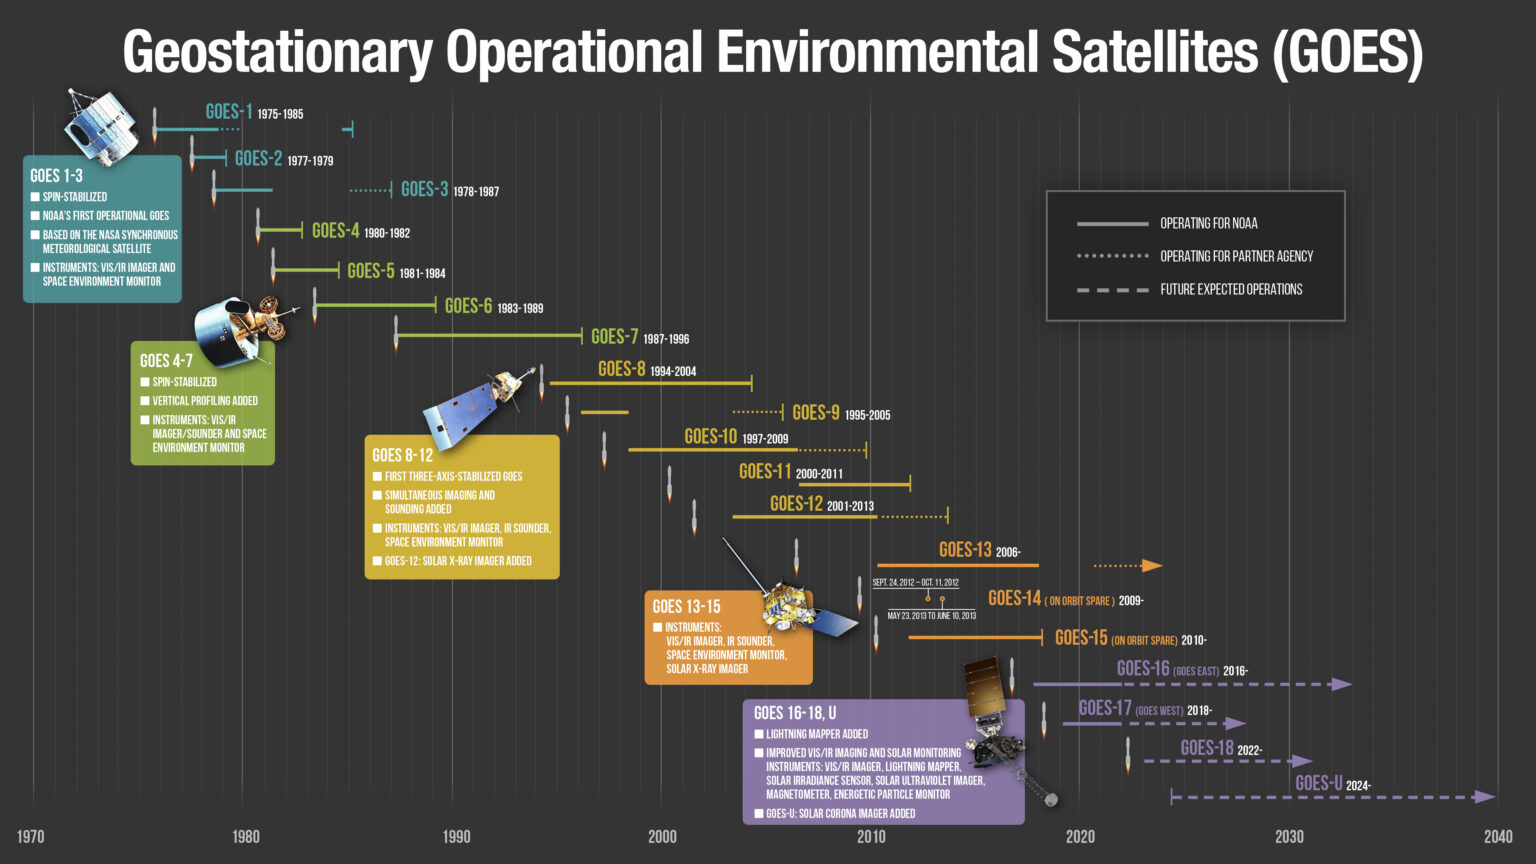
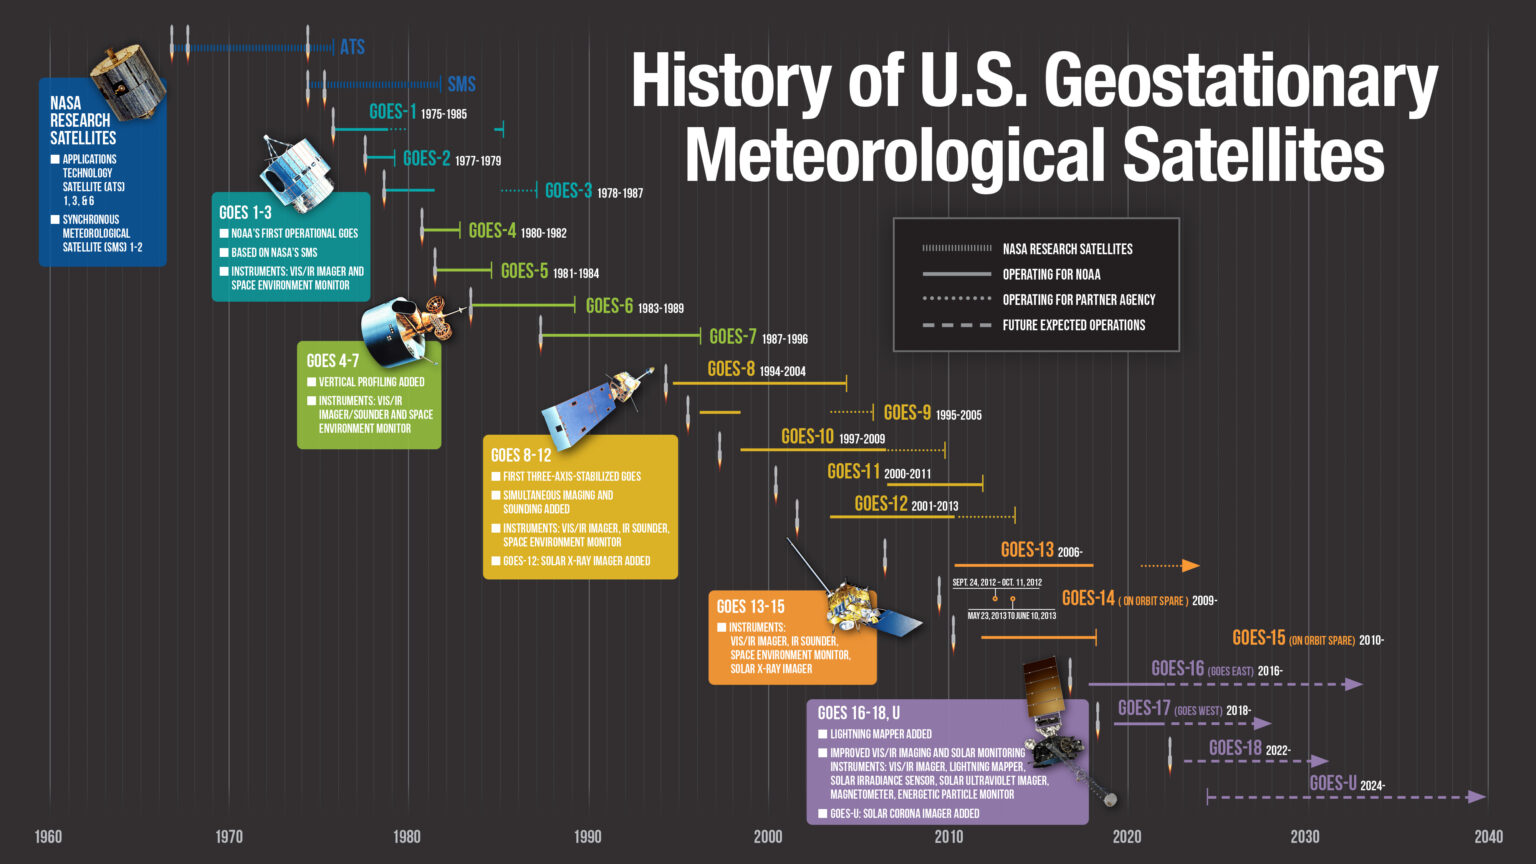
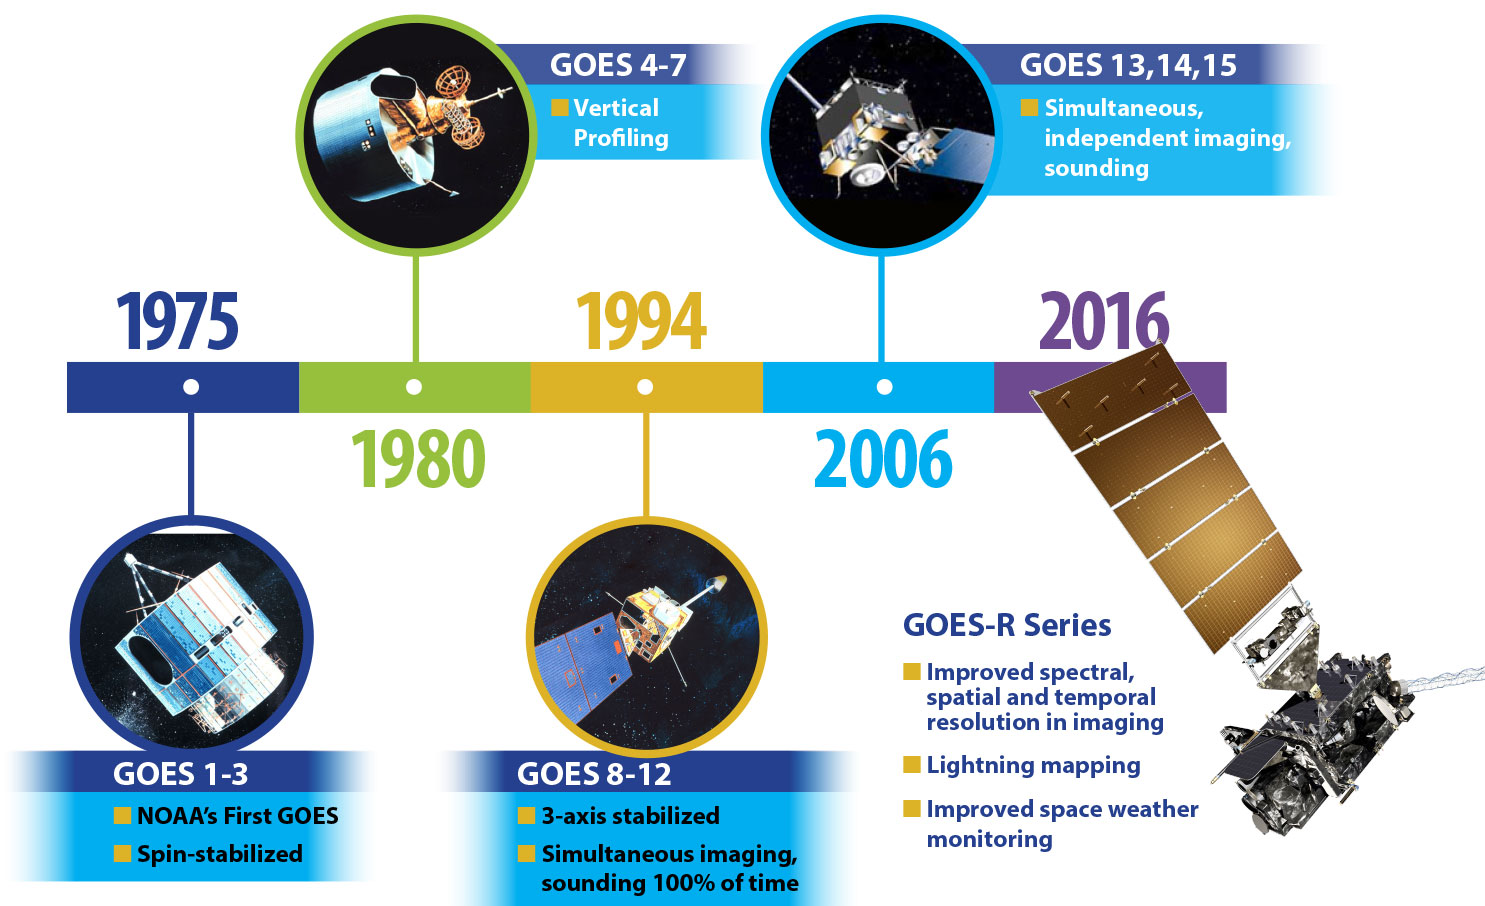
An updated timeline of the GOES, from GOES-1 to GOES-U. Figure credit: GOES-R Program Office. (Click to show larger image.)An updated timeline of the U.S. geo imaging, from ATS/SMS to GOES-U. Figure credit: GOES-R Program Office. (Click to show larger image.)
The timelines show the periods when the satellites were operational. Yet, there were other times when they might have been operating. For example, when an on-orbit spacecraft comes out of storage once a year, often in August, for a routine check-out of several weeks. Another example was GOES-14, as it provided over 5 months of 1 min data (SRSOR) data to better prepare for the meso-scale sectors on the ABI. These campaigns were in 2012, 2013, 2014, 2015 and 2016. Some of these times were:
Start Date
End Date
16-Aug-2012
31-Oct-2012
13-Aug-2013
28-Aug-2013
08-May-2014
25-May-2014
14-Aug-2014
28-Aug-2014
18-May-2015
11-Jun-2015
10-Aug-2015
28-Aug-2015
01-Feb-2016
25-Feb-2016
18-Apr-2016
15-May-2016
09-Aug-2016
29-Aug-2016
01-Aug-2017
11-Aug-2017
08-Aug-2018
17-Aug-2018
31-Jul-2019
13-Aug-2019
11-Aug-2020
21-Aug-2020
11-Aug-2021
19-Aug-2021
GOES-14 times (as start/end pairs) of being operated, though not operational. All dates are approximate.
In addition, GOES-15 was operated several times to supplement GOES-17 operations:
Start Date
End Date
20-May-2018
09-March-2020
04-Aug-2020
04-Sep-2020
04-Feb-2021
19-Feb-2021
02-Aug-2021
05-Nov-2021
17-Feb-2022
18-April-2022
GOES-15 times (as start/end pairs) of being operated, though not operational. All dates are approximate.
The second timeline above includes not only the U.S. GOES imagers, but also their precursors: ATS-1, 3 (including the Spin Scan Cloud Cameras) and 6 (with the 2-channel GVHRR; including an infrared band) and SMS-1/2. The GOES-R Program Office also has a more simple GOES timeline.
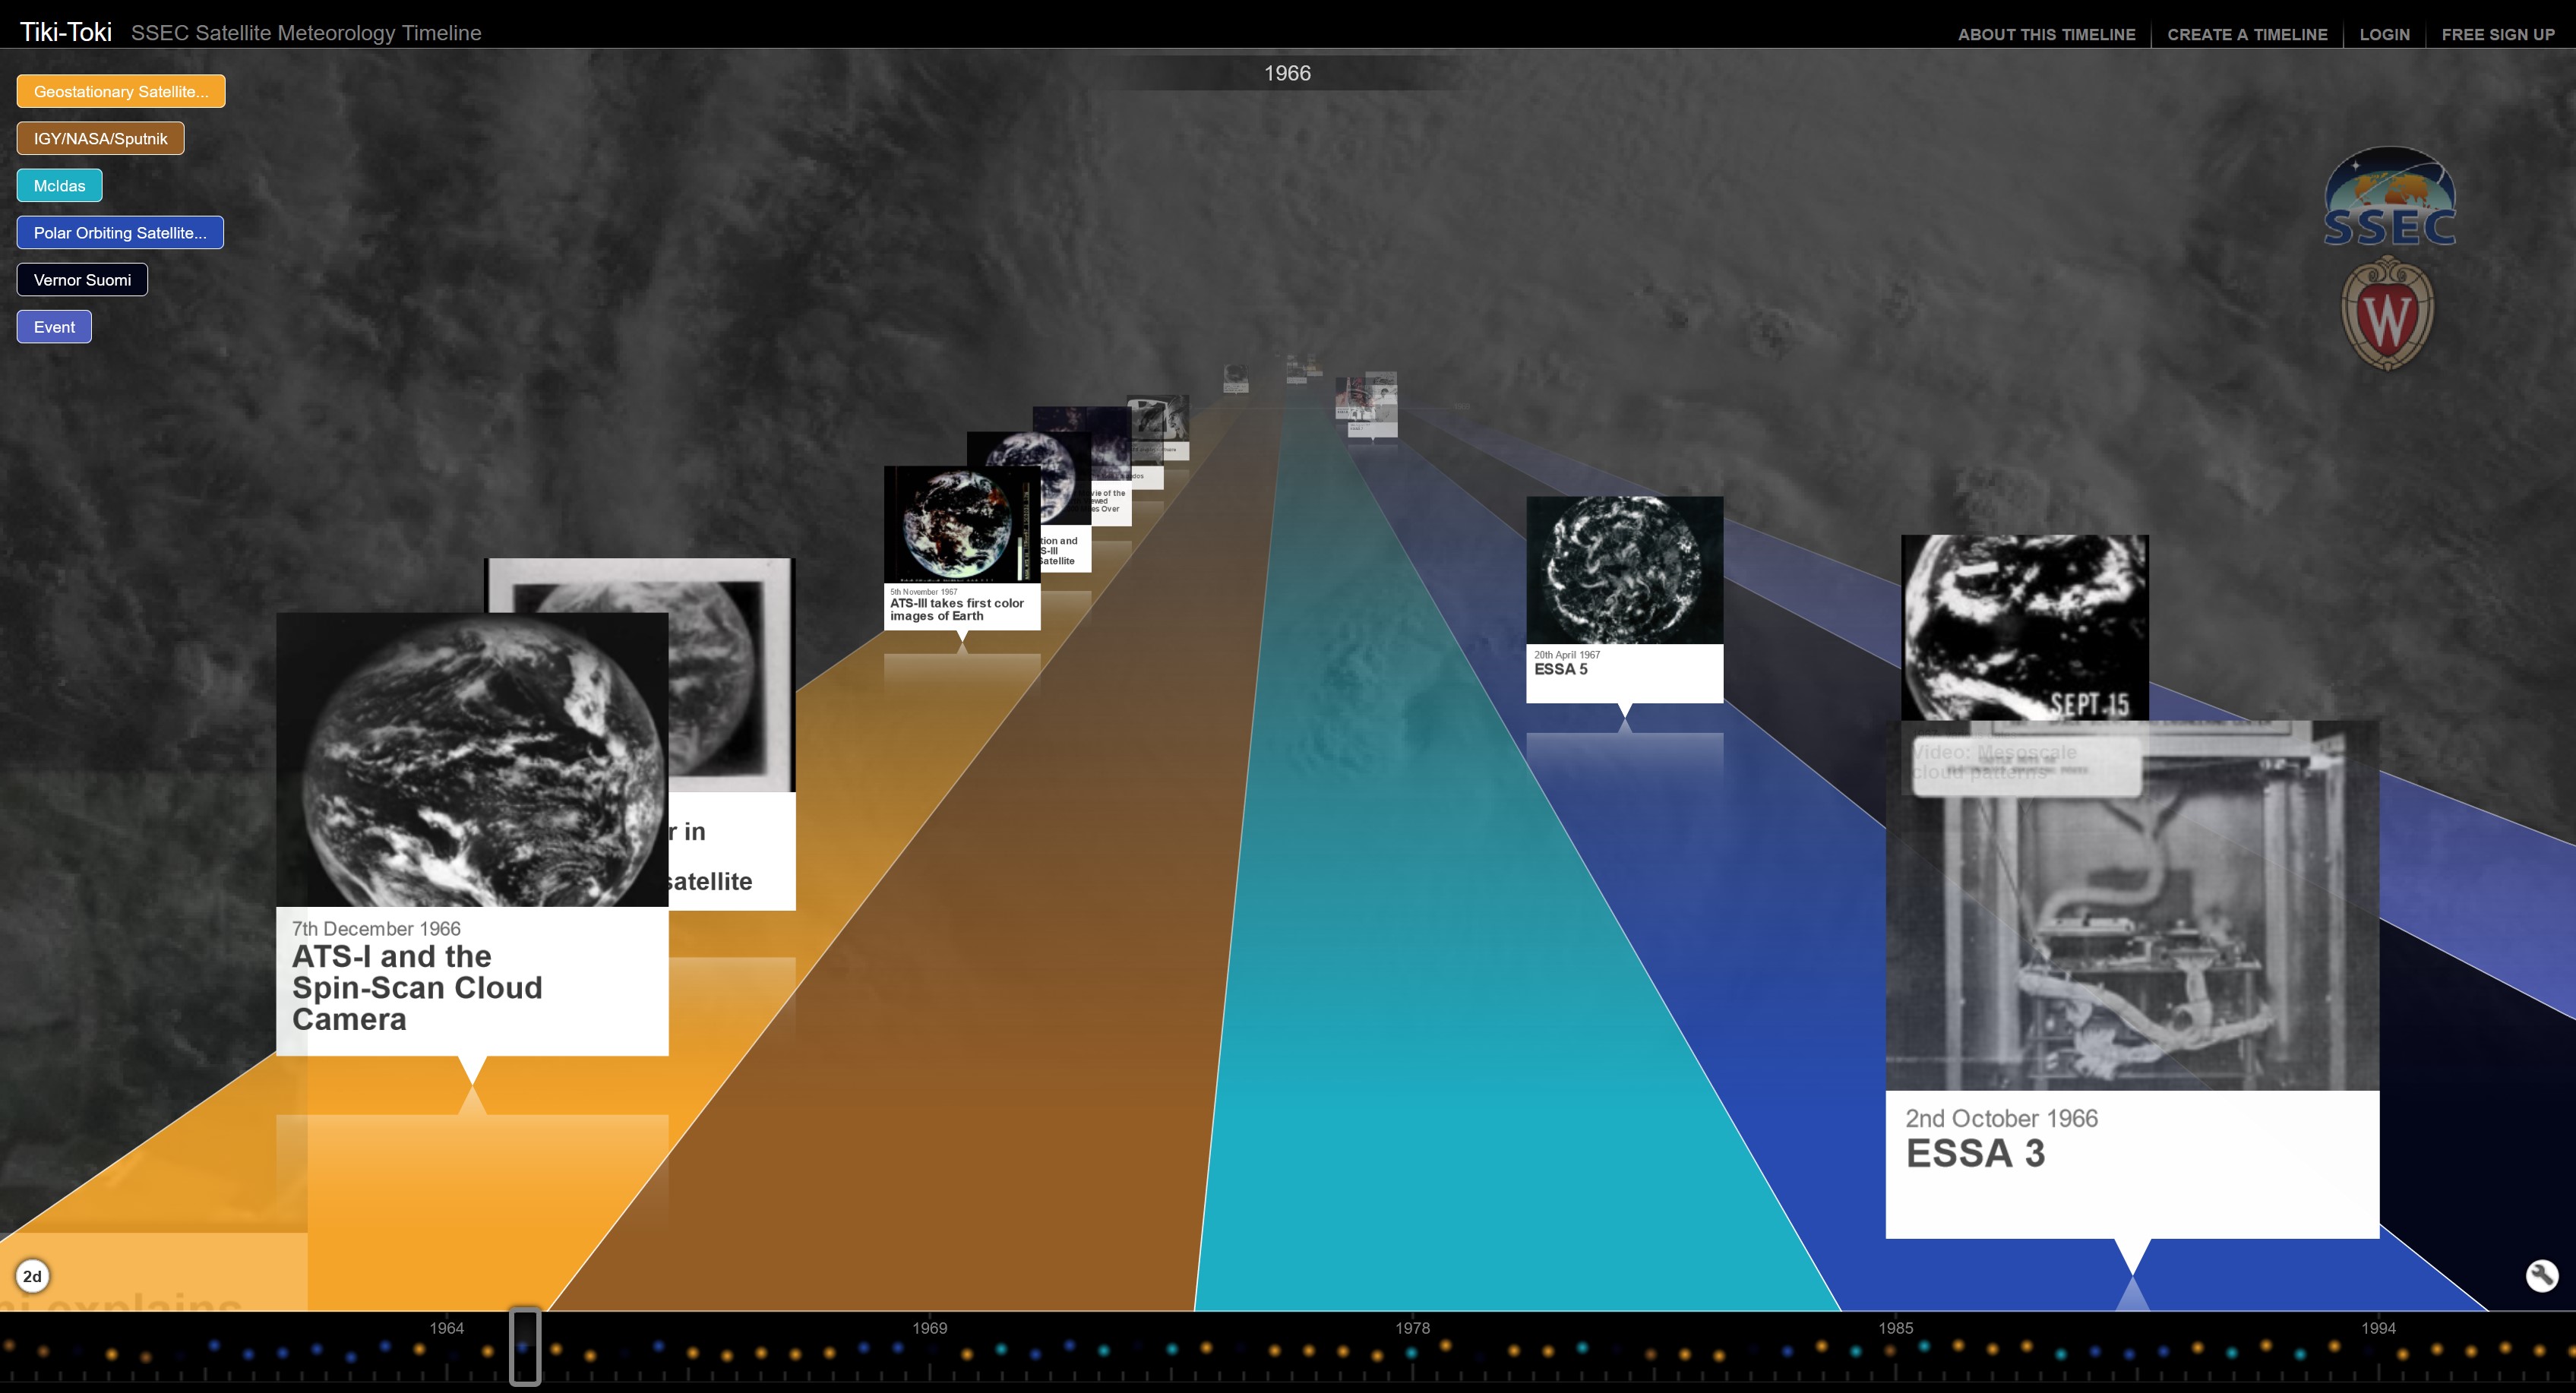
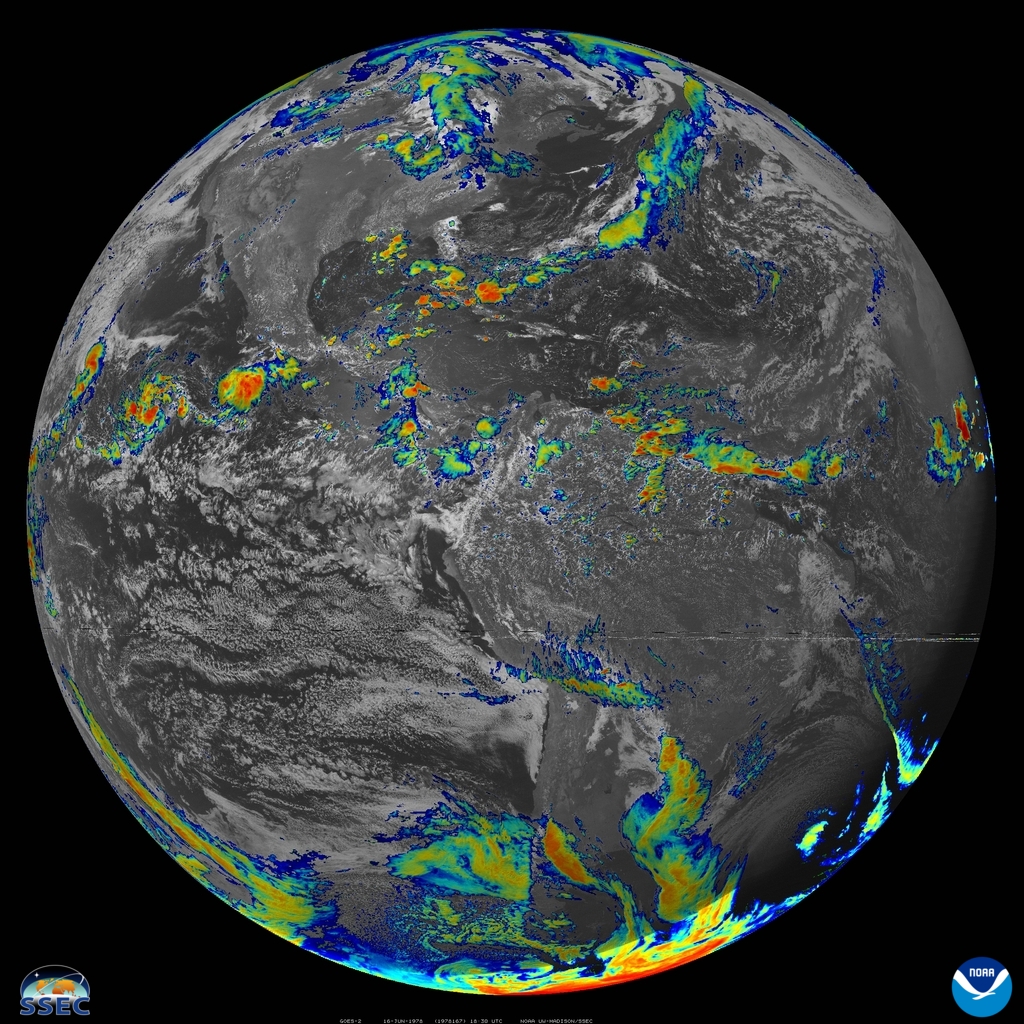
Snapshot of the UW/SSEC timeline, the orange line relates to the geostationary orbit. (Click to better show image.)A GOES-2 Full Disk image from June 16, 1978. The visible band is shown, along with cold IR values. (Click to show larger image.)
The above image shows a color-coded transparency for cold clouds over the gray-scale visible image.
After GOES-U, NOAA is planning on the next generation U.S. geostationary imager as part of the Geostationary Extended Observations (GeoXO) program.
A timeline of the GOES, from GOES-1 to GOES-U. Figure credit: GOES-R Program Office. (Click to show larger image.)A timeline of the U.S. geo imaging, from ATS/SMS to GOES-U. Figure credit: GOES-R Program Office. (Click to show larger image.)
1-minute Mesoscale Domain Sector GOES-16 (GOES-East) “Red” Visible (0.64 µm) images (above) include time-matched SPC Storm Reports — and showed the development severe thunderstorms across parts of Iowa, Wisconsin and Upper Michigan during the afternoon and early evening hours on 15 June 2022. Boundary layer feeder band clouds could be seen flowing north-northeastward into some of the growing thunderstorms —... Read More
GOES-16 “Red” Visible (0.64 µm) images, with time-matched SPC Storm Reports plotted in red [click to play animated GIF | MP4]
1-minute Mesoscale Domain Sector GOES-16 (GOES-East) “Red” Visible (0.64 µm) images (above) include time-matched SPC Storm Reports — and showed the development severe thunderstorms across parts of Iowa, Wisconsin and Upper Michigan during the afternoon and early evening hours on 15 June 2022. Boundary layer feeder band clouds could be seen flowing north-northeastward into some of the growing thunderstorms — which produced a few tornadoes and damaging straight-line winds as strong as 80 mph in Wisconsin, and hail as large as 2.75 inches in diameter in Iowa. This convection developed along and ahead of an eastward-moving cold front (surface analyses).
In the corresponding 1-minute GOES-16 “Clean” Infrared Window (10.35 µm) images (below), pulsing overshooting tops exhibited cold infrared brightness temperatures in the -75 to -79ºC range (brighter white pixels embedded within areas of black).
GOES-16 “Clean” Infrared Window (10.35 µm) images, with time-matched SPC Storm Reports plotted in cyan [click to play animated GIF | MP4]
ProbSevere is a weather product that uses GOES-16 data to help predict the probability of any severe weather (hail, wind, or tornados) happening in the next 60 minutes. ProbSevere LightningCast predicts the probability that a GLM Lightning observation will occur in the next 60 minutes. Below are examples of these... Read More
ProbSevere is a weather product that uses GOES-16 data to help predict the probability of any severe weather (hail, wind, or tornados) happening in the next 60 minutes. ProbSevere LightningCast predicts the probability that a GLM Lightning observation will occur in the next 60 minutes. Below are examples of these products over the Western Wisconsin area as a convective system rolls through La Crosse, Wisconsin.
The ProbSevere probability product imaged as contours, overlayed with GOES-16 Day Cloud Convection RGB for 06-15-2022 from 20:00 to 20:22Z near La Crosse, Wisconsin [Click to enlarge].The LightningCast probability product imaged as contours of 75, 50, 25, and 10 percent, overlayed with GOES-16 Day Cloud Convection RGB for 06-15-2022 from 20:00 to 20:22Z near La Crosse, Wisconsin [Click to enlarge].


