This post explores data-filling methods for missing data in a GOES-17 Level 1B radiance time series dataset.
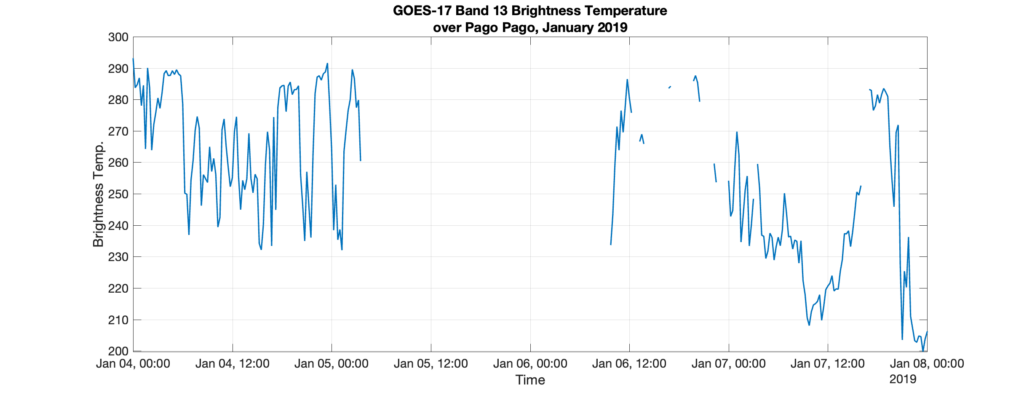
Background: SSEC’s Data Center is home to a near complete record of GOES-16 and GOES-17 Full Disk Level 1B data. With these data capabilities, it is possible to compile a time series or ‘short climatology’ of GOES data over a given location. In examples shown here, Pago Pago has been chosen. (Pago Pago, the capital of American Samoa, holds significance due to its data sparseness. Weather forecasting and nowcasting in remote Pacific regions such as Pago Pago are heavily reliant on satellite data because of a lack of ground-based observations.)
Long-term purpose: The purpose of building a continuous satellite time series is to perform a time series analysis, i.e. to determine any periodicity or patterns in the data.
Short-term goal: The goal is to build a continuous, gap-free, time record for GOES-17 Band 13 radiance over Pago Pago from 2019-2021. Brightness temperature is computed from radiance. Compiling the existing data is trivial, but when data is missing, it can present problems. The data must be gap-free for a time series analysis. For the GOES-17 Level 1 record from January 1, 2019 – December 31, 2021, 1.14% of radiance data is missing. Some gaps are as large as 31 hours.
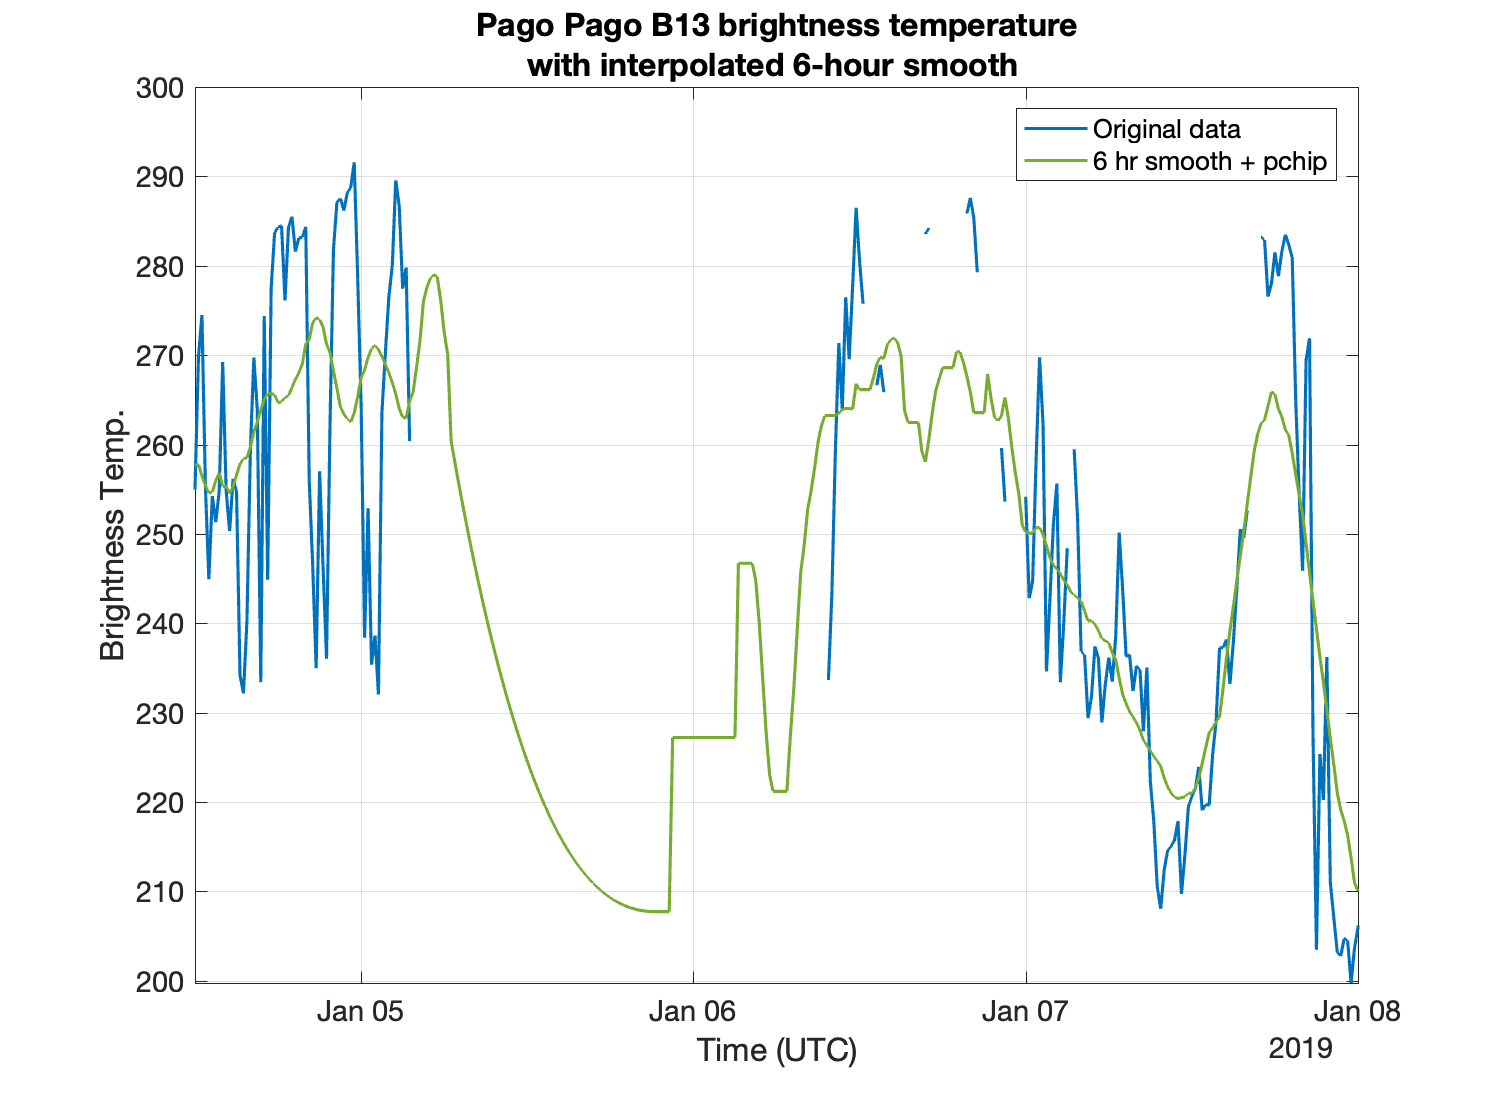
Approach: To build a continuous data record, data gaps must be identified and filled. The original raw data, which exists as frequently as every ten minutes, is first sampled at every fifteen minutes. Then, it is smoothed using a moving mean method. The moving mean computes a mean over a sliding window of length k. As a last step, the smoothed data are run through a shape-preserving piecewise cubic spline interpolation (nicknamed ‘pchip’ interpolation) to fill remaining gaps [1].
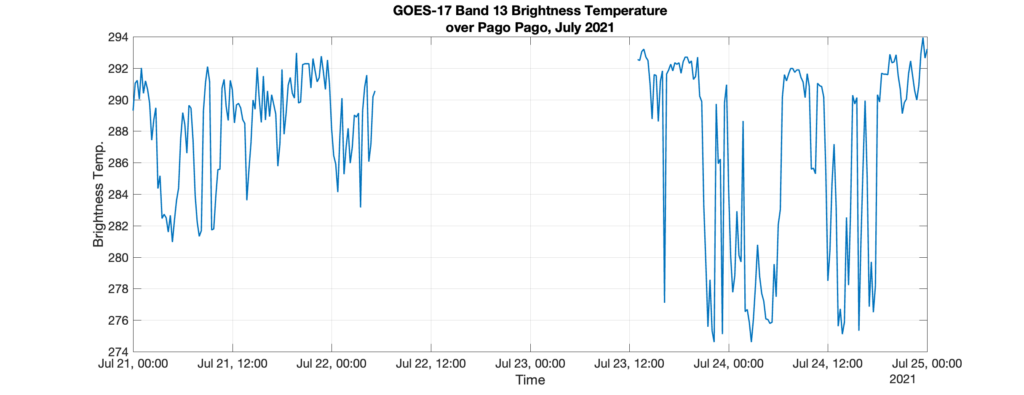
Results: In examples below, we investigate samples of the time series for k = 6 hours, 12 hours, 24 hours, and 48 hours over the two example gaps: January 2019 and July 2021. As the data is smoothed, precision is lost when comparing to the original time series. However, smoother data also results in a more “natural” looking interpolation. For example, when examining the 48-hr smoothed data [red lines in panels (d)], the data hardly looks interpolated.
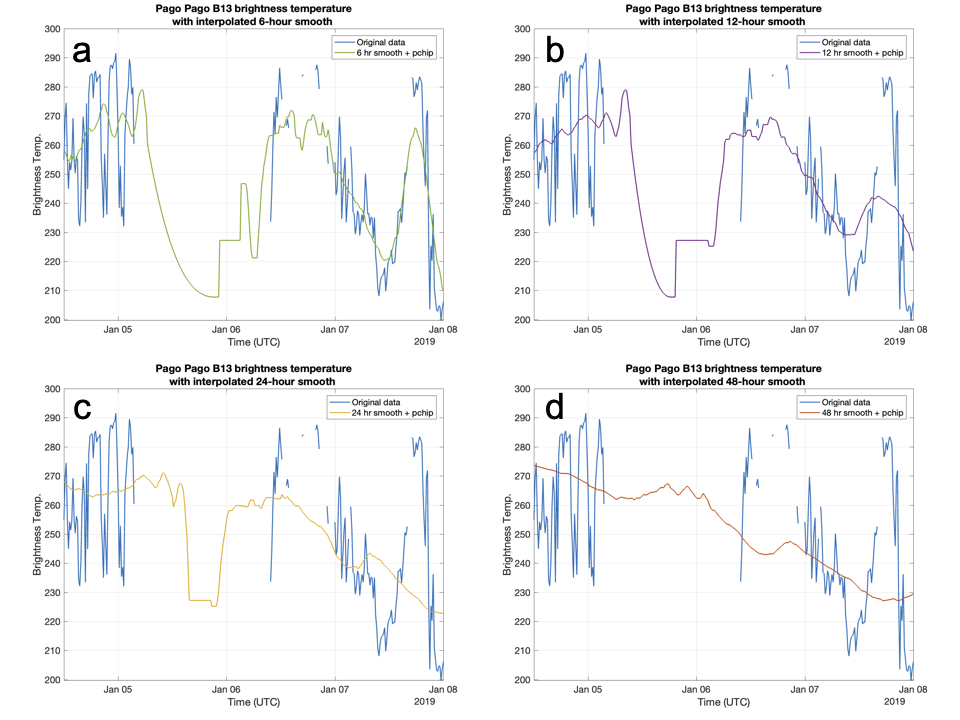
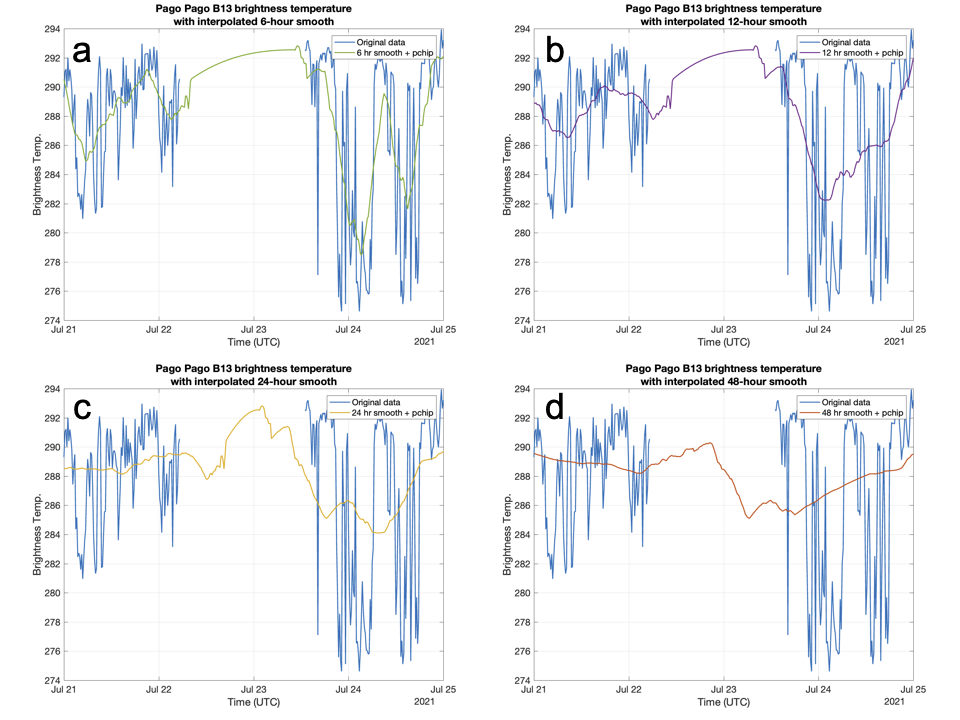
How smoothed must the data be for the time series to look convincingly ‘real’ after interpolation? And will the data smoothing and loss of precision affect results from a time series analysis? These questions remain unanswered.
View only this post Read Less


