
1-minute Mesoscale Domain Sector GOES-16 (GOES-East) “Red” Visible (0.64 µm) and “Clean” Infrared Window (10.35 µm) images (above) showed Fiona as it intensified to a Category 4 Hurricane just east of The Bahamas at 0900 UTC on 21 September 2022. The coldest cloud-top 10.35 µm infrared brightness temperatures were around -81ºC.GOES-16 Infrared images with and without a overlay... Read More
GOES-16 “Red” Visible (0.64 µm) and “Clean” Infrared Window (10.35 µm) images [click to play animated GIF | MP4]
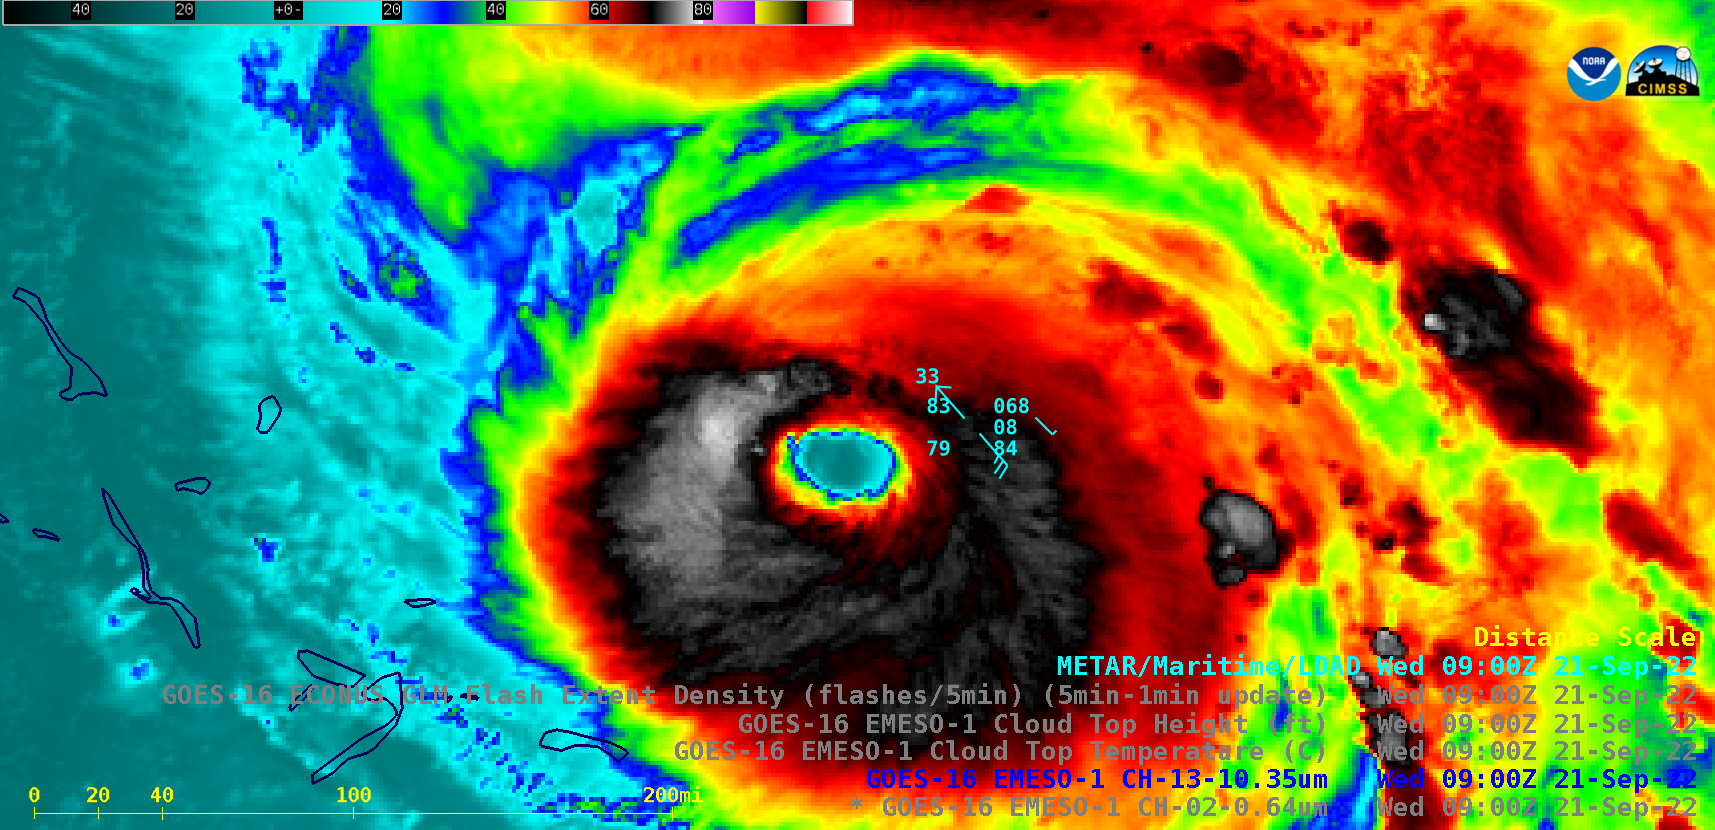
1-minute Mesoscale Domain Sector GOES-16
(GOES-East) “Red” Visible (
0.64 µm) and “Clean” Infrared Window (
10.35 µm) images
(above) showed
Fiona as it intensified to a Category 4 Hurricane just east of The Bahamas at
0900 UTC on 21 September 2022. The coldest cloud-top 10.35 µm infrared brightness temperatures were around -81ºC.
GOES-16 Infrared images with and without a overlay of GLM Flash Extent Density (below) did reveal isolated brief periods of lightning in the eyewall region of Fiona — but most of the lightning activity was associated with convection well east of the eye.
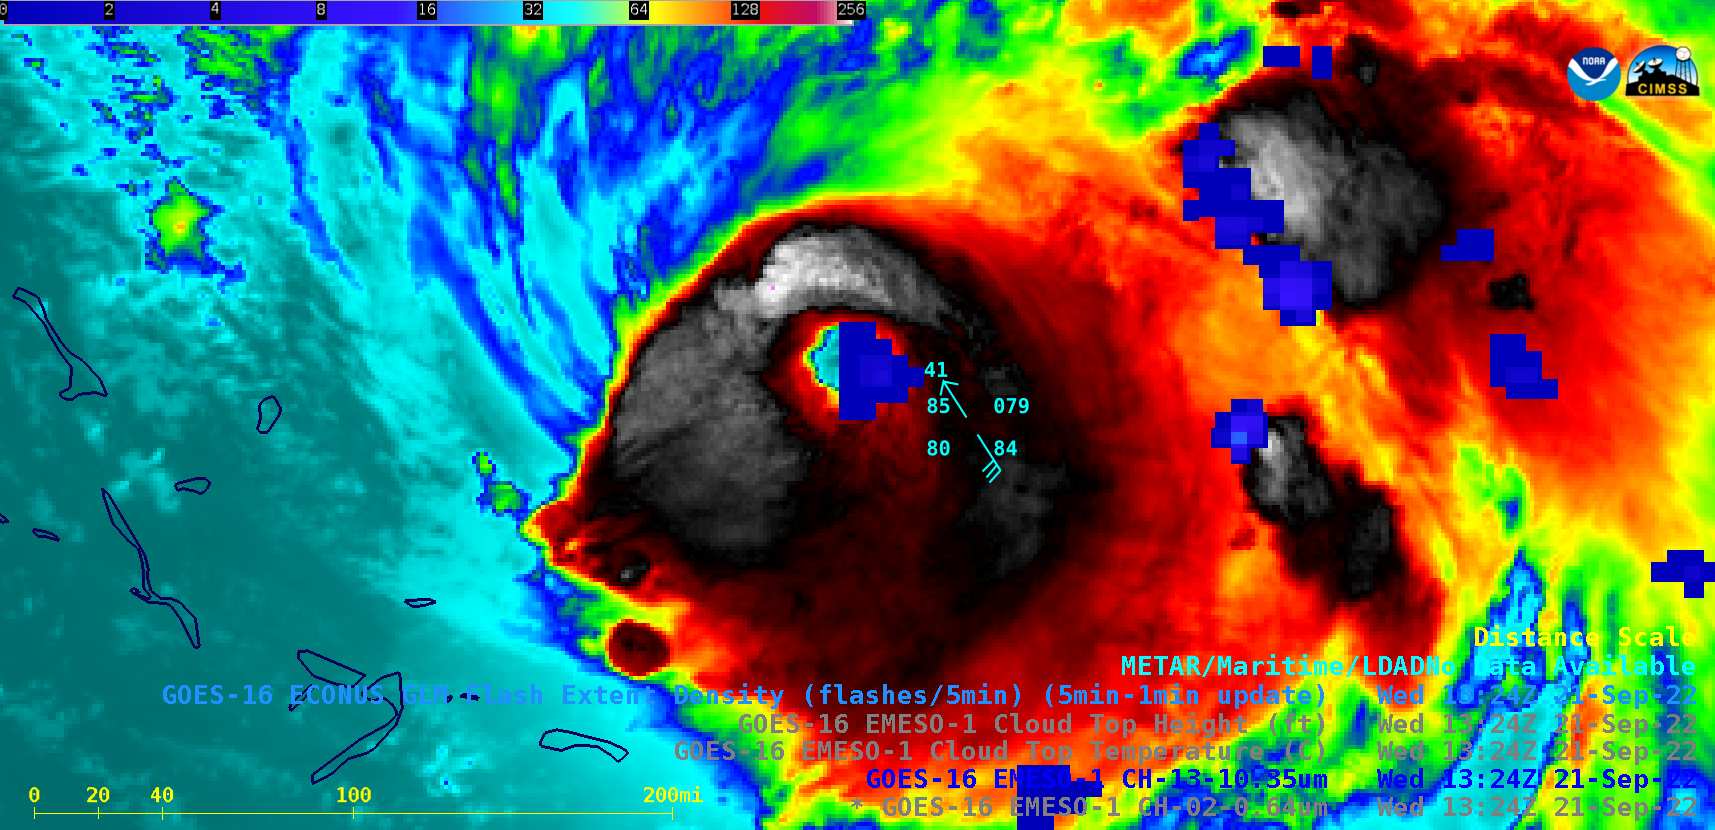
GOES-16 “Clean” Infrared Window (10.35 µm) images, with and without a overlay of GLM Flash Extent Density [click to play animated GIF | MP4]
The corresponding 1-minute GOES-16
Cloud Top Temperature and
Cloud Top Height derived products are shown below — the coldest Cloud Top Temperature values were around -84ºC, while maximum Cloud Top Height values were around 58,000 feet.
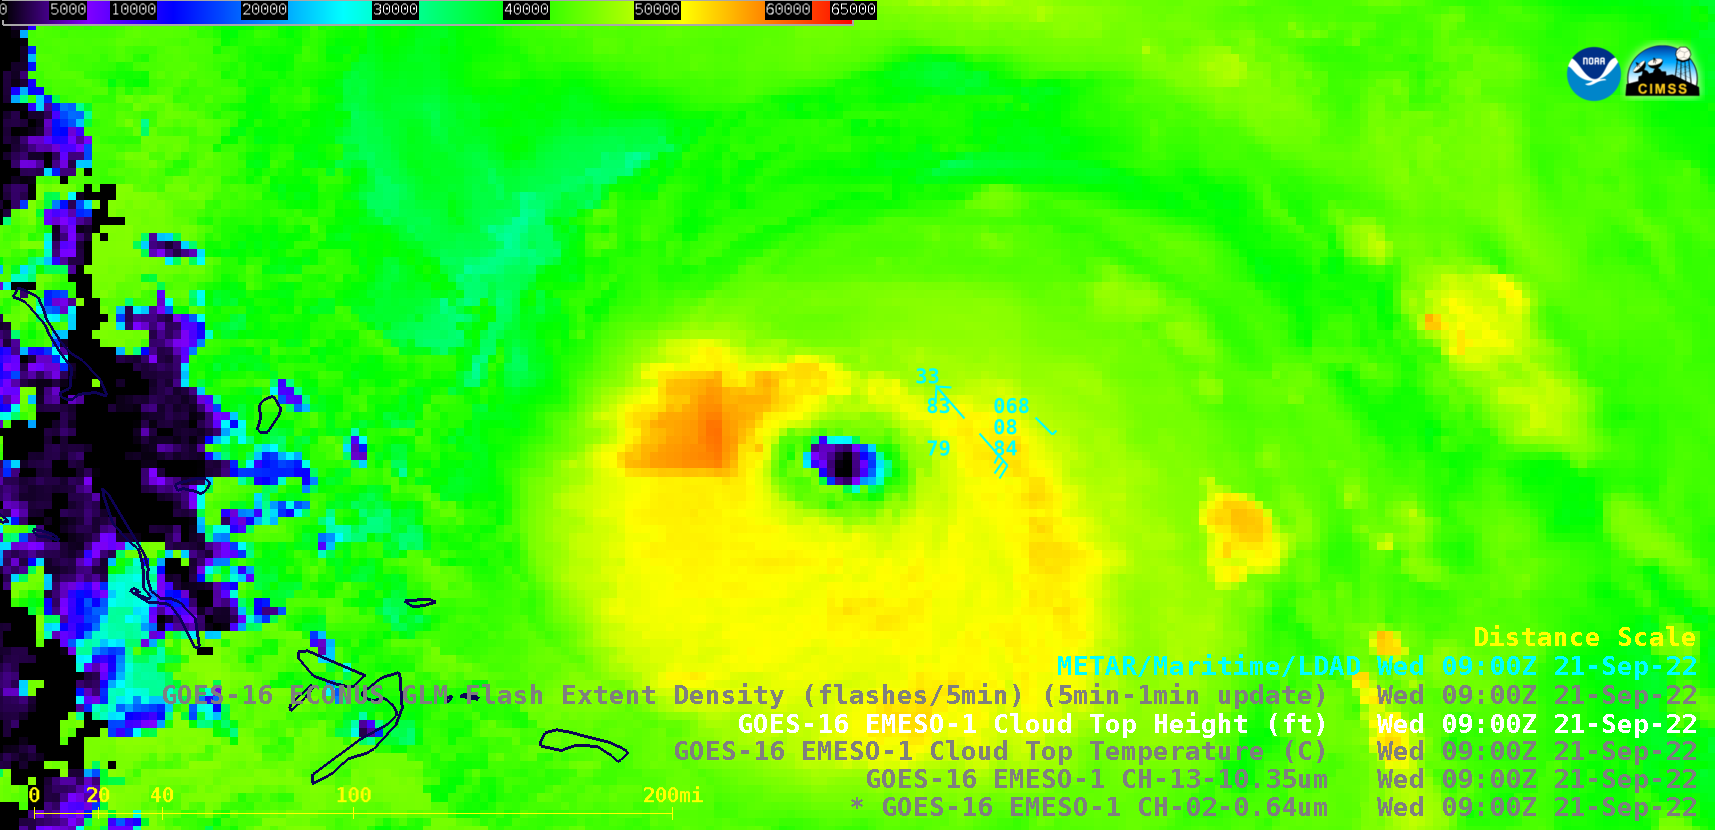
GOES-16 Cloud Top Temperature and Cloud Top Height derived products [click to play animated GIF | MP4]
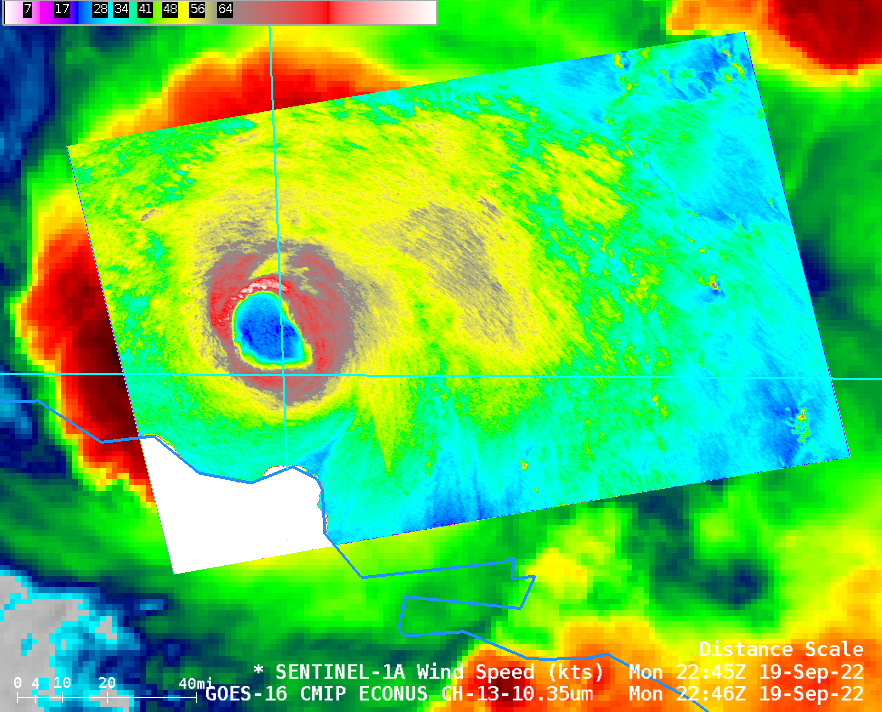
In a time-matched comparison of Infrared Window images from Suomi-NPP and GOES-16 at 0700 UTC
(below), the coldest cloud-top infrared brightness temperatures were -86ºC and -81ºC, respectively. A slight northwestward
parallax displacement was evident with the GOES-16 image.
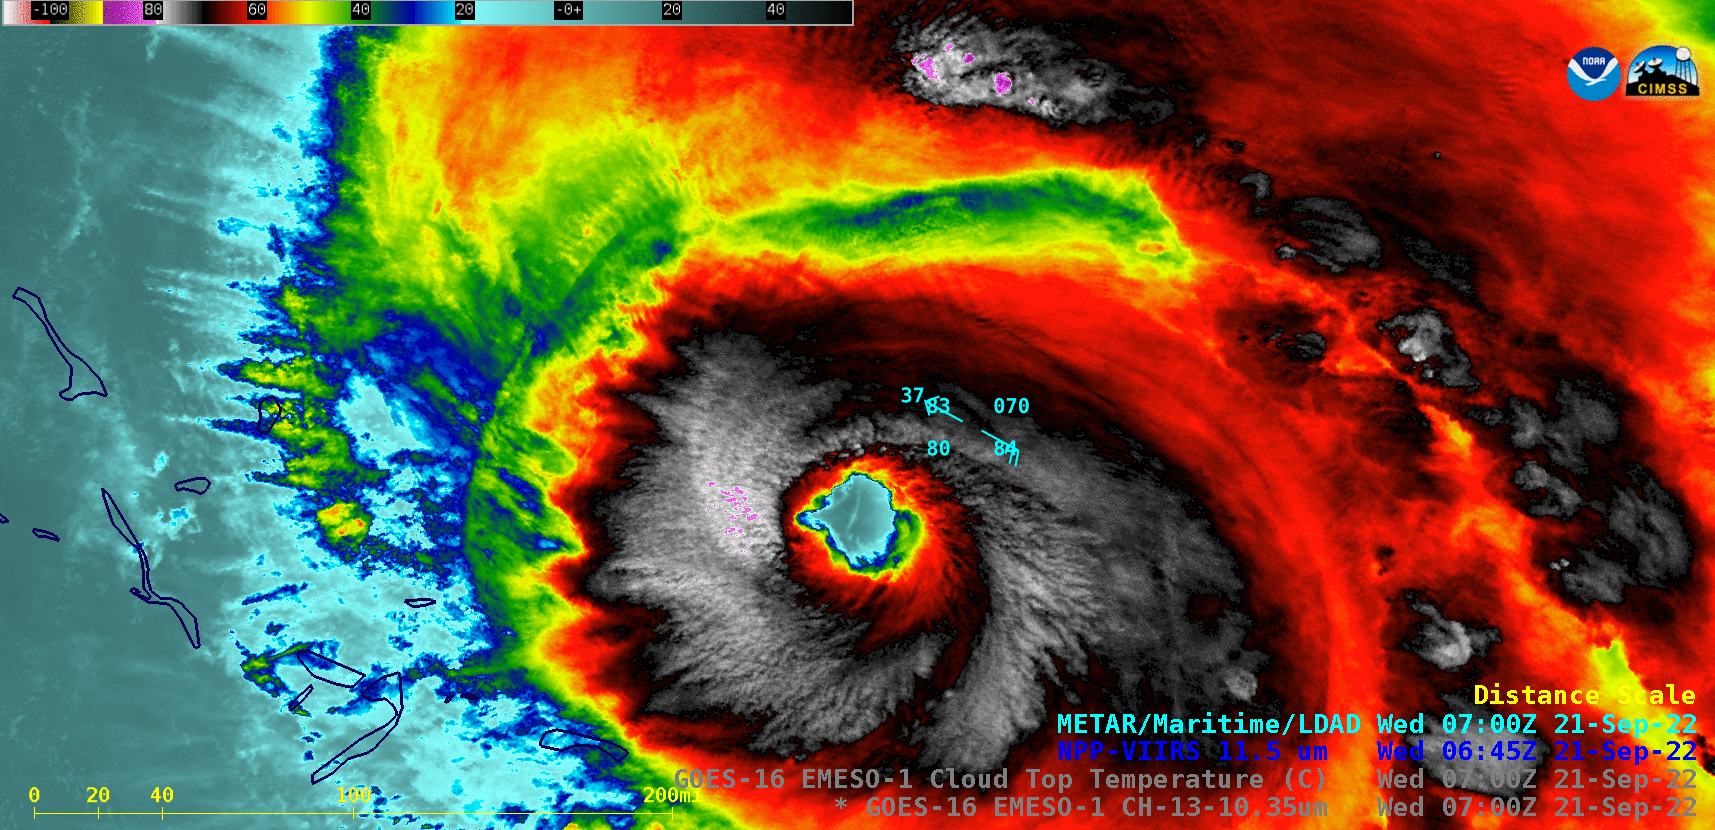
Infrared Window images from Suomi-NPP (11.45 µm) and GOES-16 (10.35 µm) [click to enlarge]
===== 23 September Update =====
GOES-16 “Clean” Infrared Window (10.35 µm) images [click to play animated GIF | MP4]
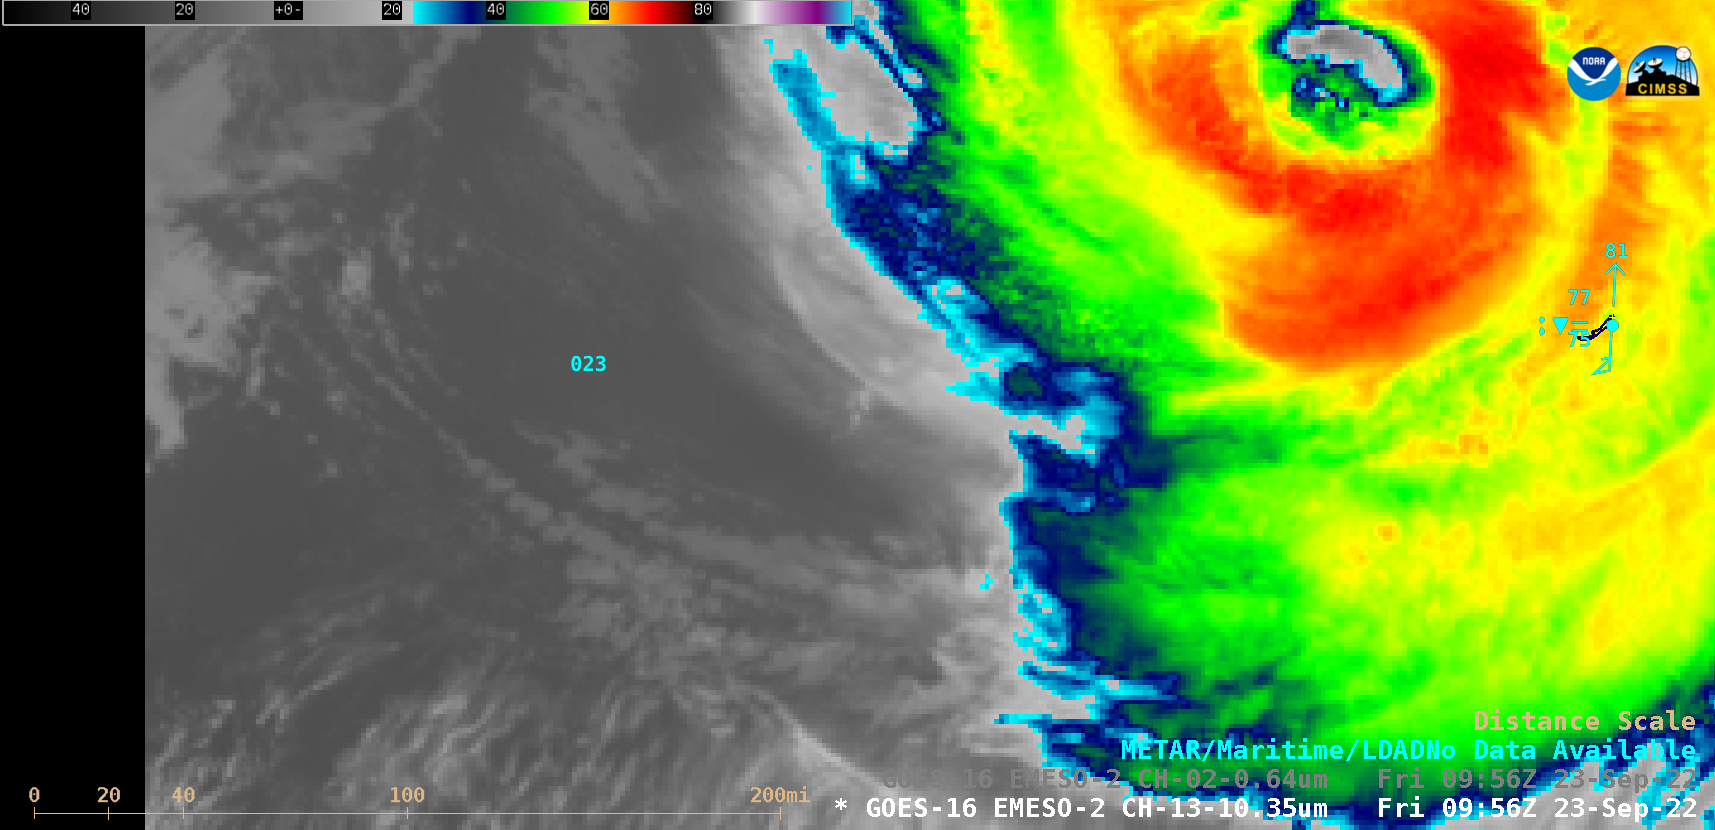
As Fiona passed just to the northwest of Bermuda during the nighttime hours on 22-23 September, it was briefly downgraded to a Category 3 storm at 0600 UTC (before being again upgraded to Category 4 at 1200 UTC on the following morning) — but a wind gust to 81 knots (93 mph) was recorded at Bermuda Naval Air Station (station identifier TXKF) shortly before 10 UTC while that airport was temporarily closed to air traffic (
Bermuda discussion). 1-minute GOES-16 Infrared images
(above) showed Fiona during the 0000-1000 UTC period on 23 September.
A DMSP-17 SSMIS Microwave (85 GHz) image at 1053 UTC from the CIMSS Tropical Cyclones site (below) exhibited the eye and eyewall structure about an hour after the peak wind gust at Bermuda.
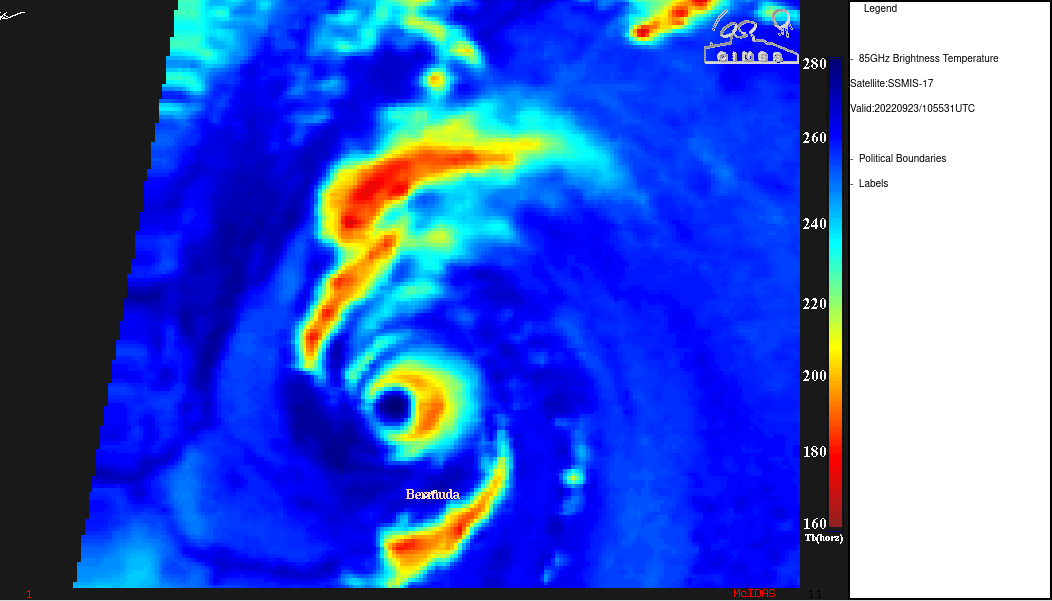
DMSP-17 SSMIS Microwave (85 GHz) image at 1053 UTC [click to enlarge]
View only this post
Read Less


