
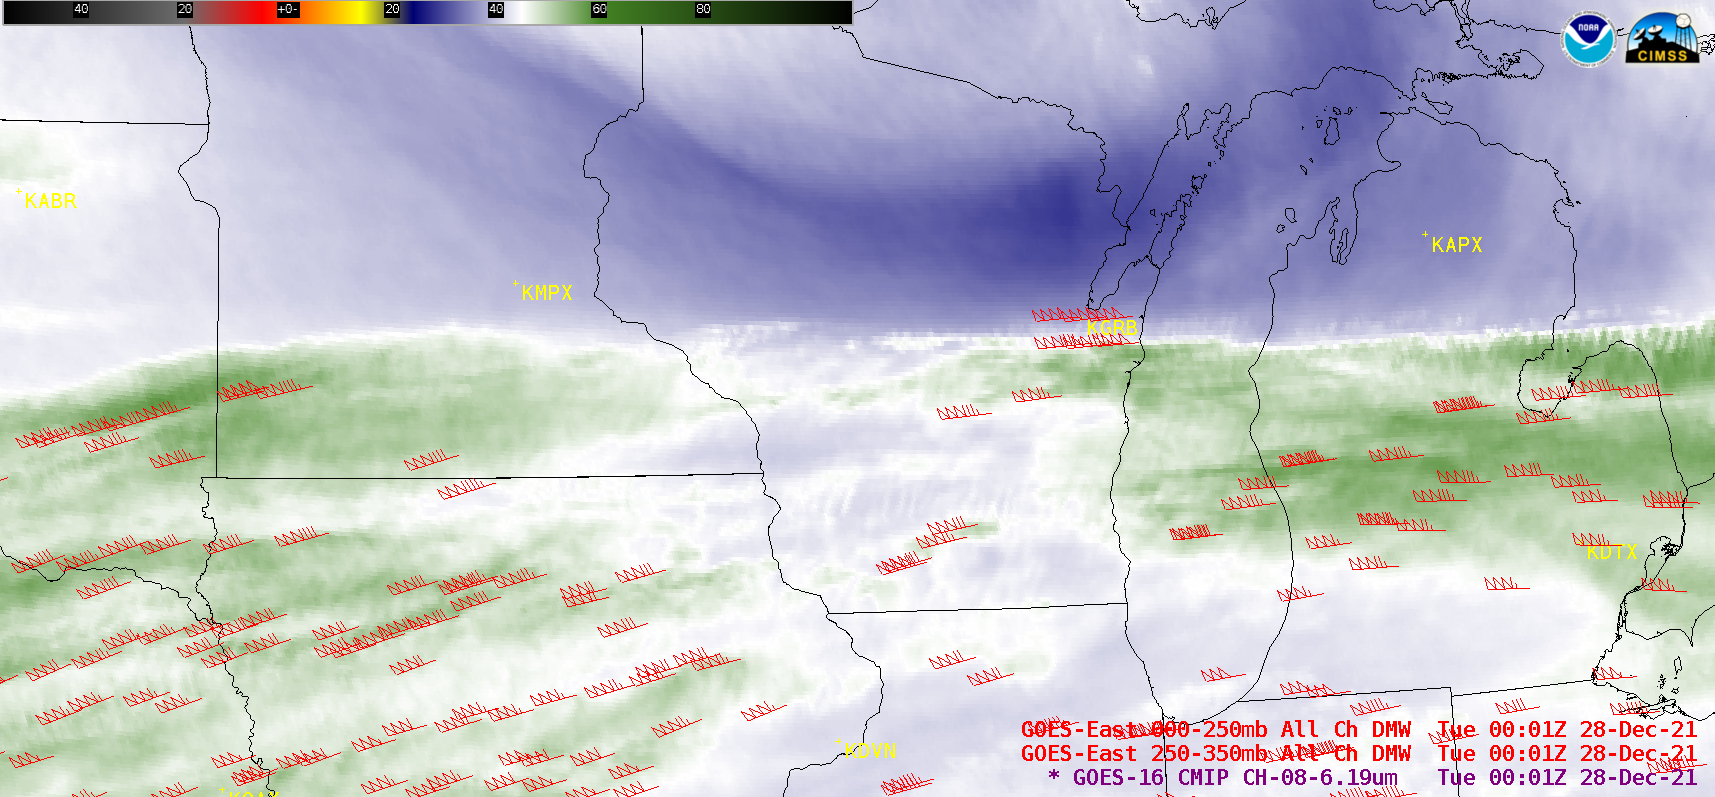
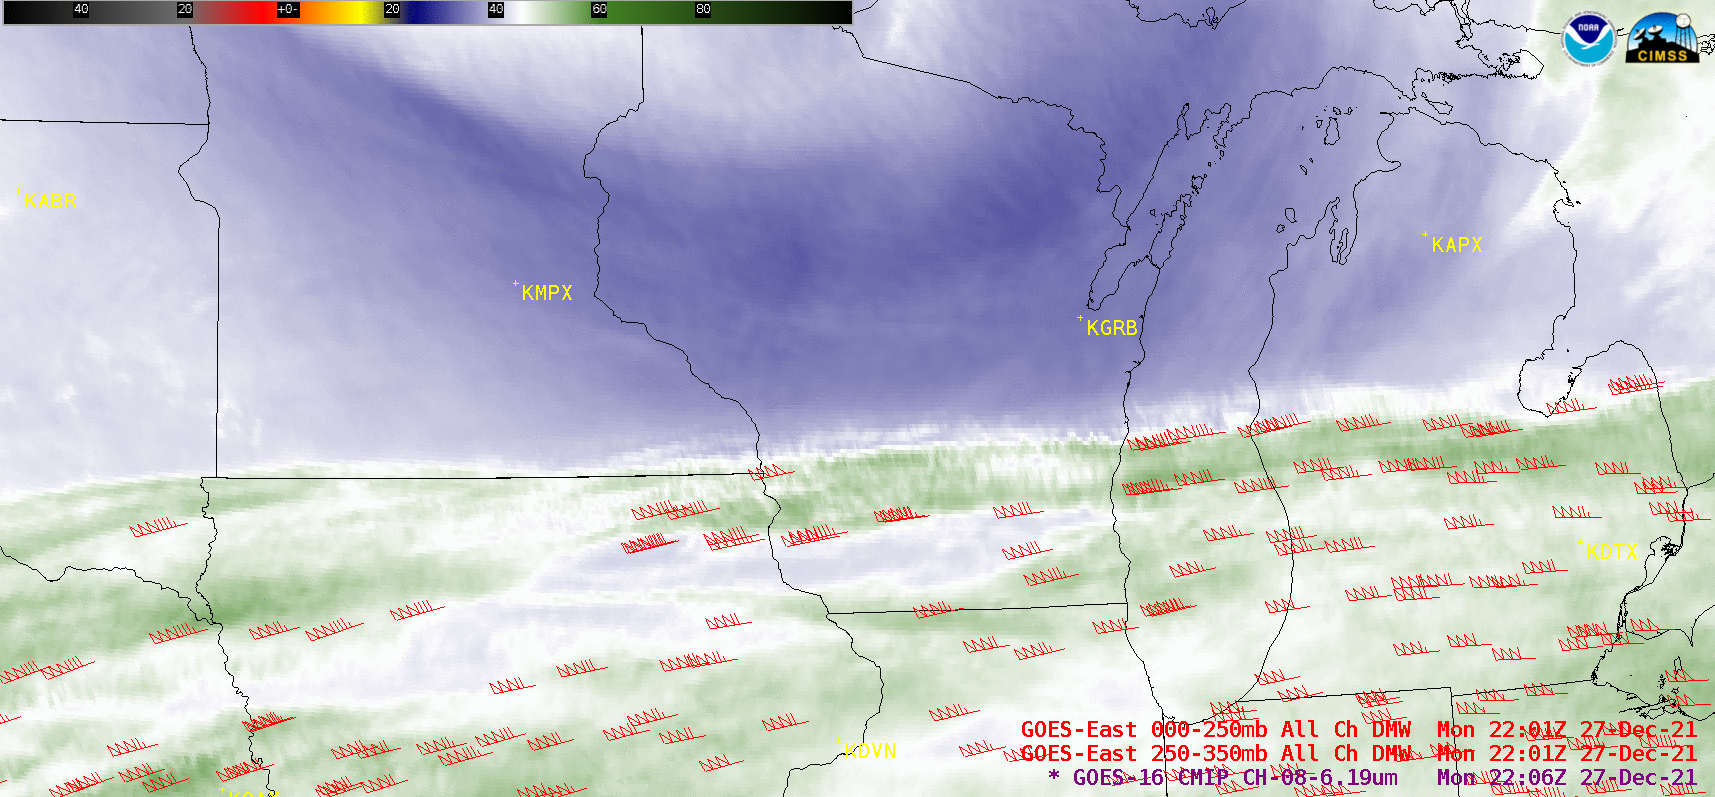
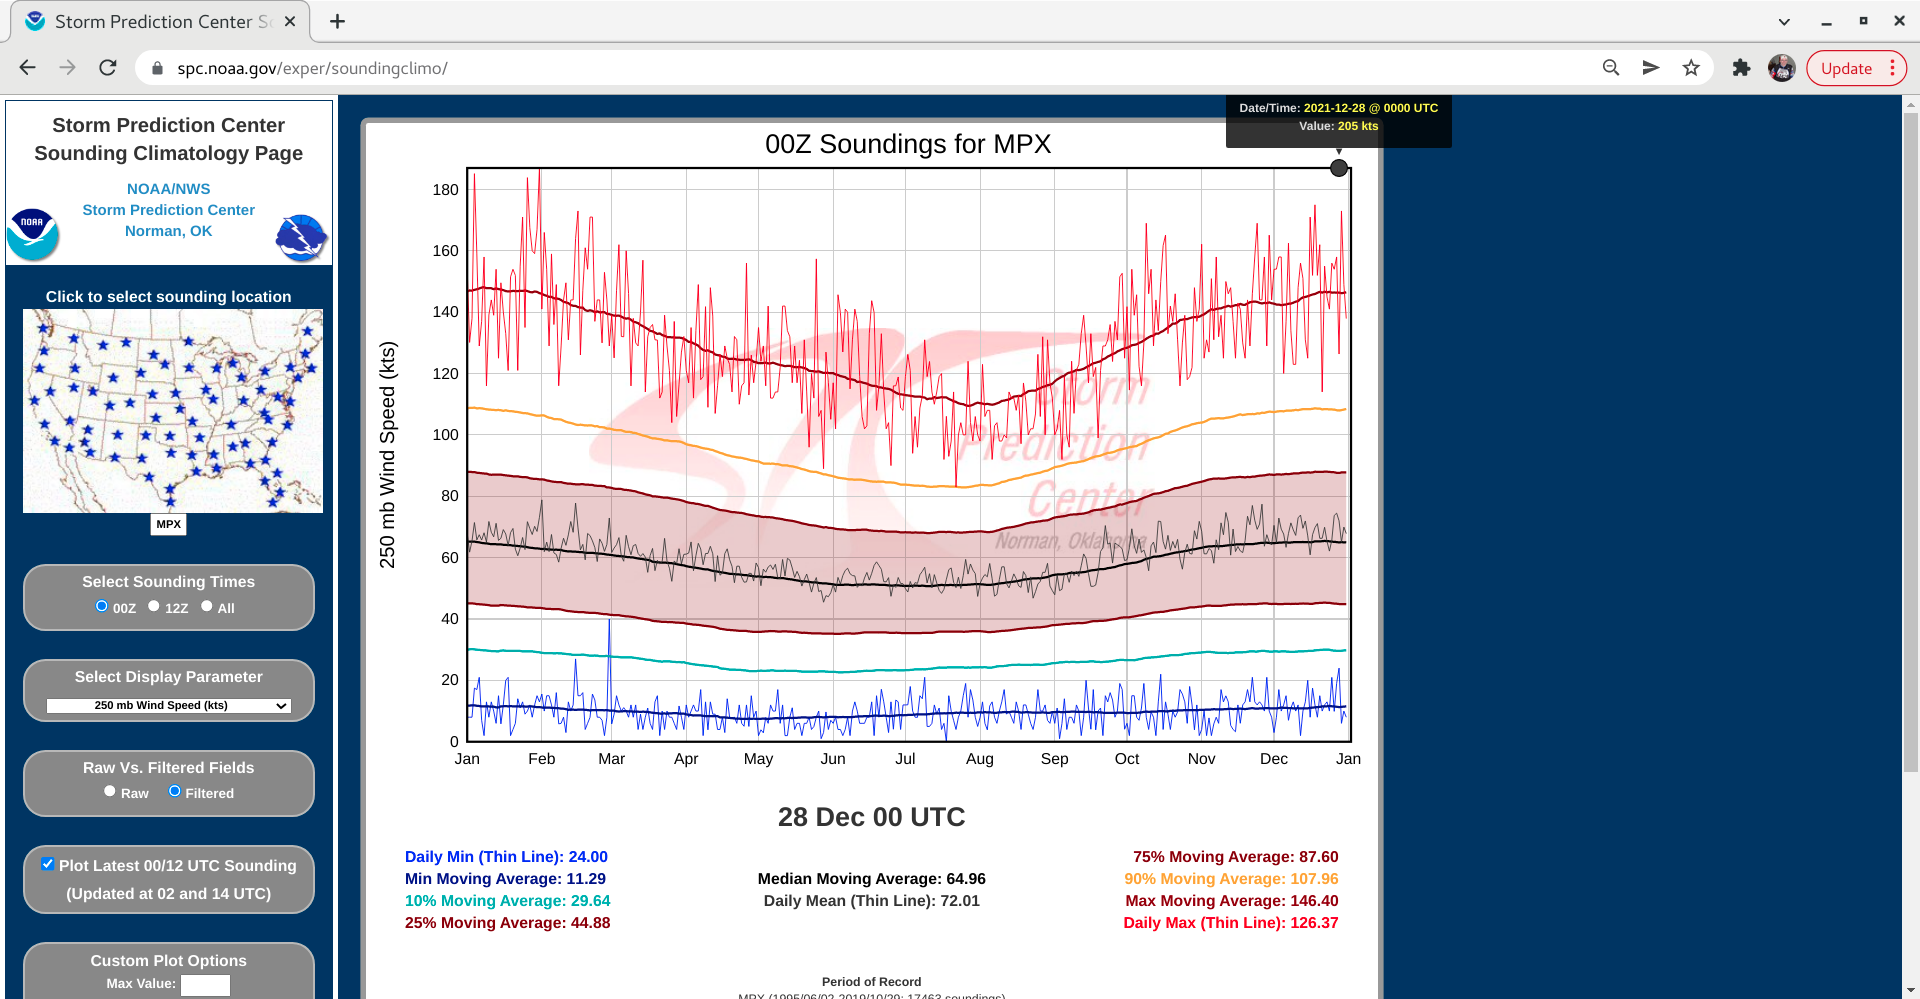
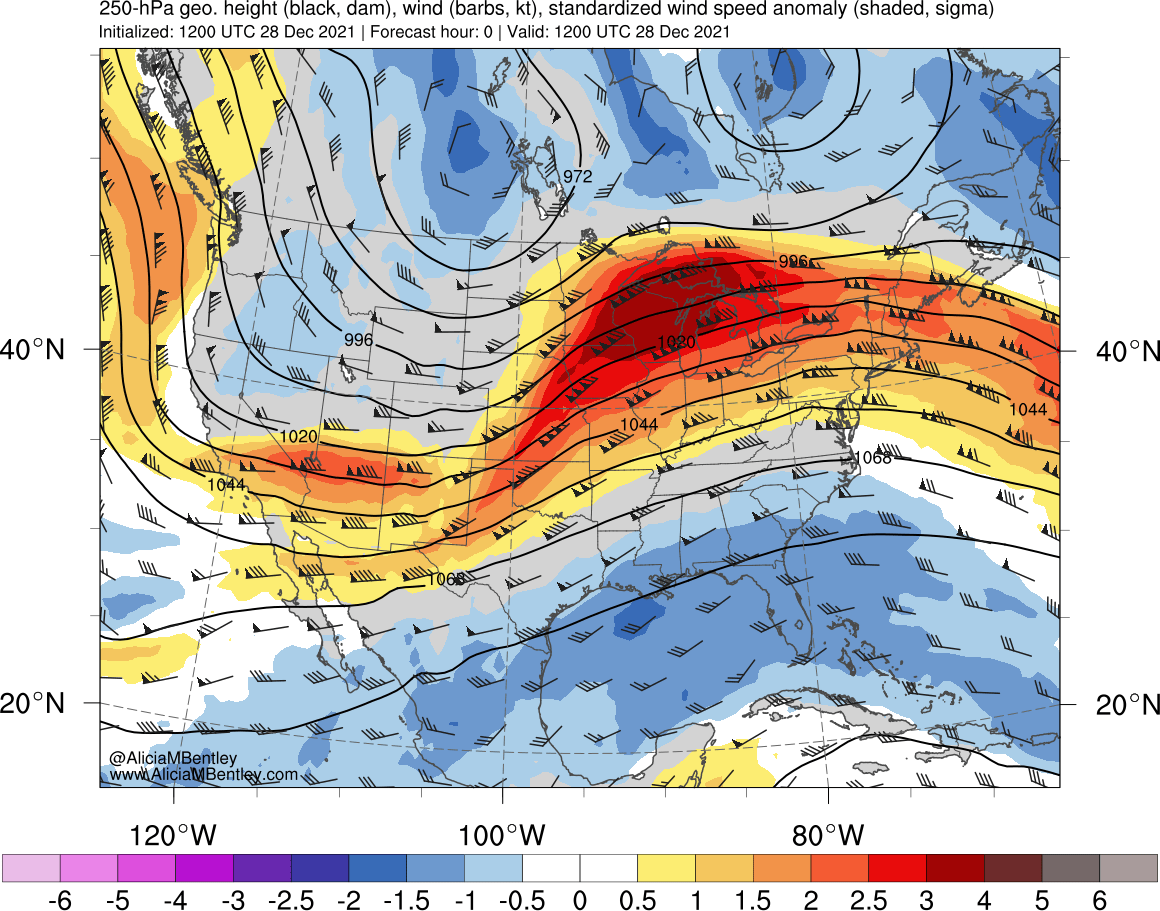
An anomalously-strong 250 hPa jet streak (analysis) was moving across the Upper Midwest late in the day on 27 December 2021. The 205 knots at Chanhassen Minnesota was a 250 hPa record maximum speed for all 00 UTC rawinsondes on 28 December at that site, as was the 207 knots at Green... Read More
GOES-16 Upper-level Water Vapor images, with plots of Derived Motion Winds [click to play animated GIF | MP4]
An
anomalously-strong 250 hPa jet streak (
analysis) was moving across the Upper Midwest late in the day on 27 December 2021. The
205 knots at Chanhassen Minnesota was a 250 hPa record maximum speed for all 00 UTC rawinsondes on 28 December at that site, as was the
207 knots at Green Bay, Wisconsin. GOES-16
(GOES-East) Upper-level Water Vapor (
6.2 µm) images with plots of
Derived Motion Winds (DMW)
(above) showed this jet streak as it moved over the Chanhassen (KMPX) and Green Bay (KGRB) areas.
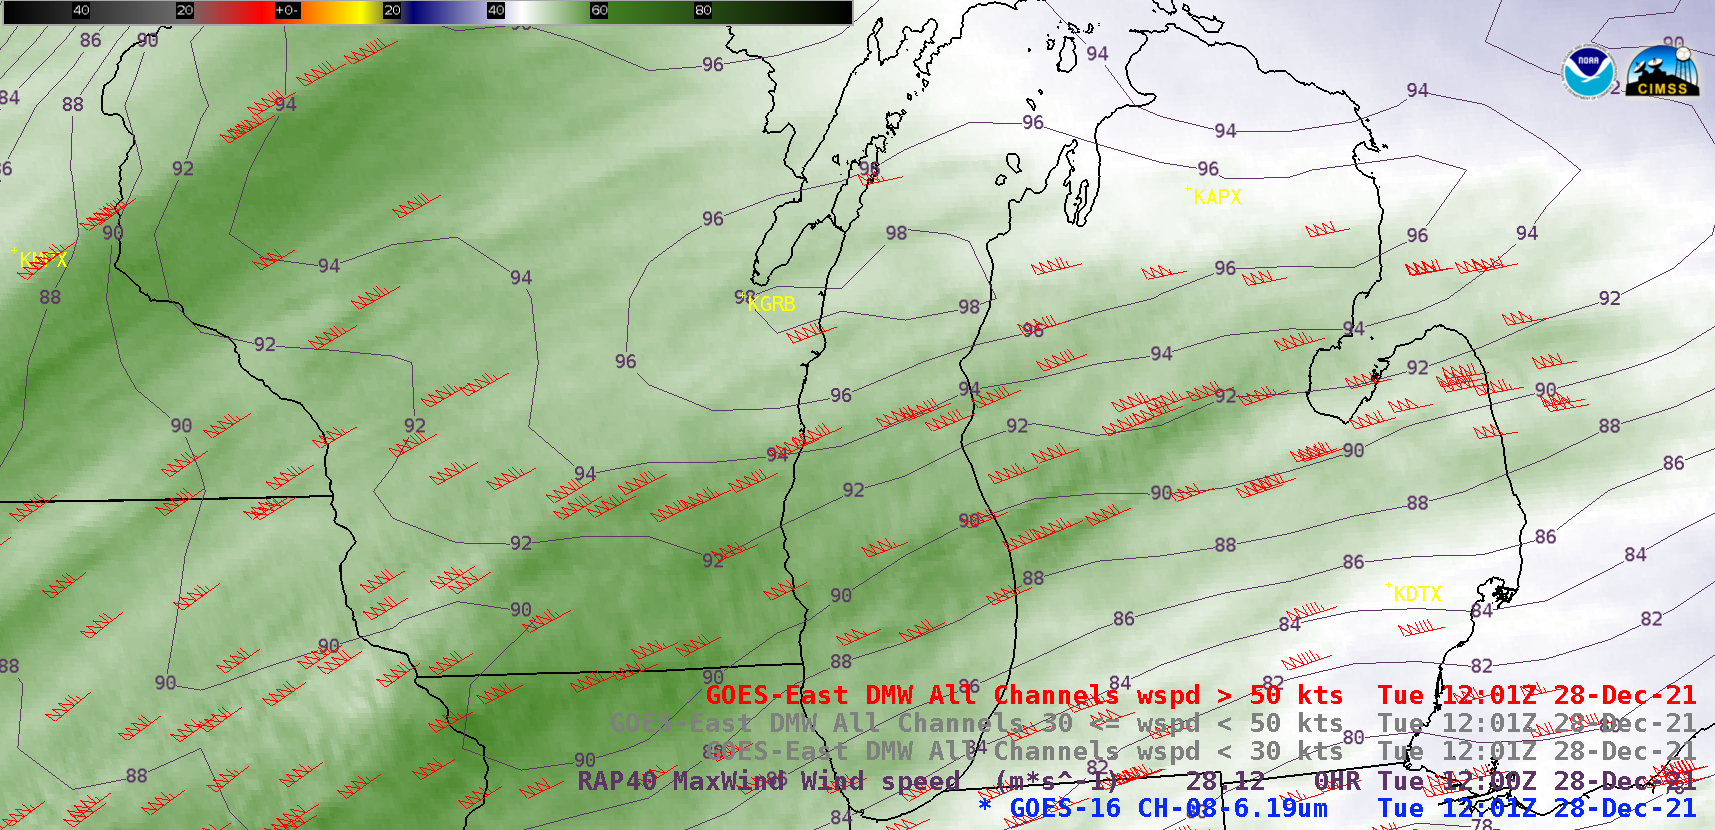
GOES-16 Upper-level Water Vapor images, with plots of Derived Motion Winds and contours of RAP model Maximum Wind Speed isotachs [click to play animated GIF | MP4]
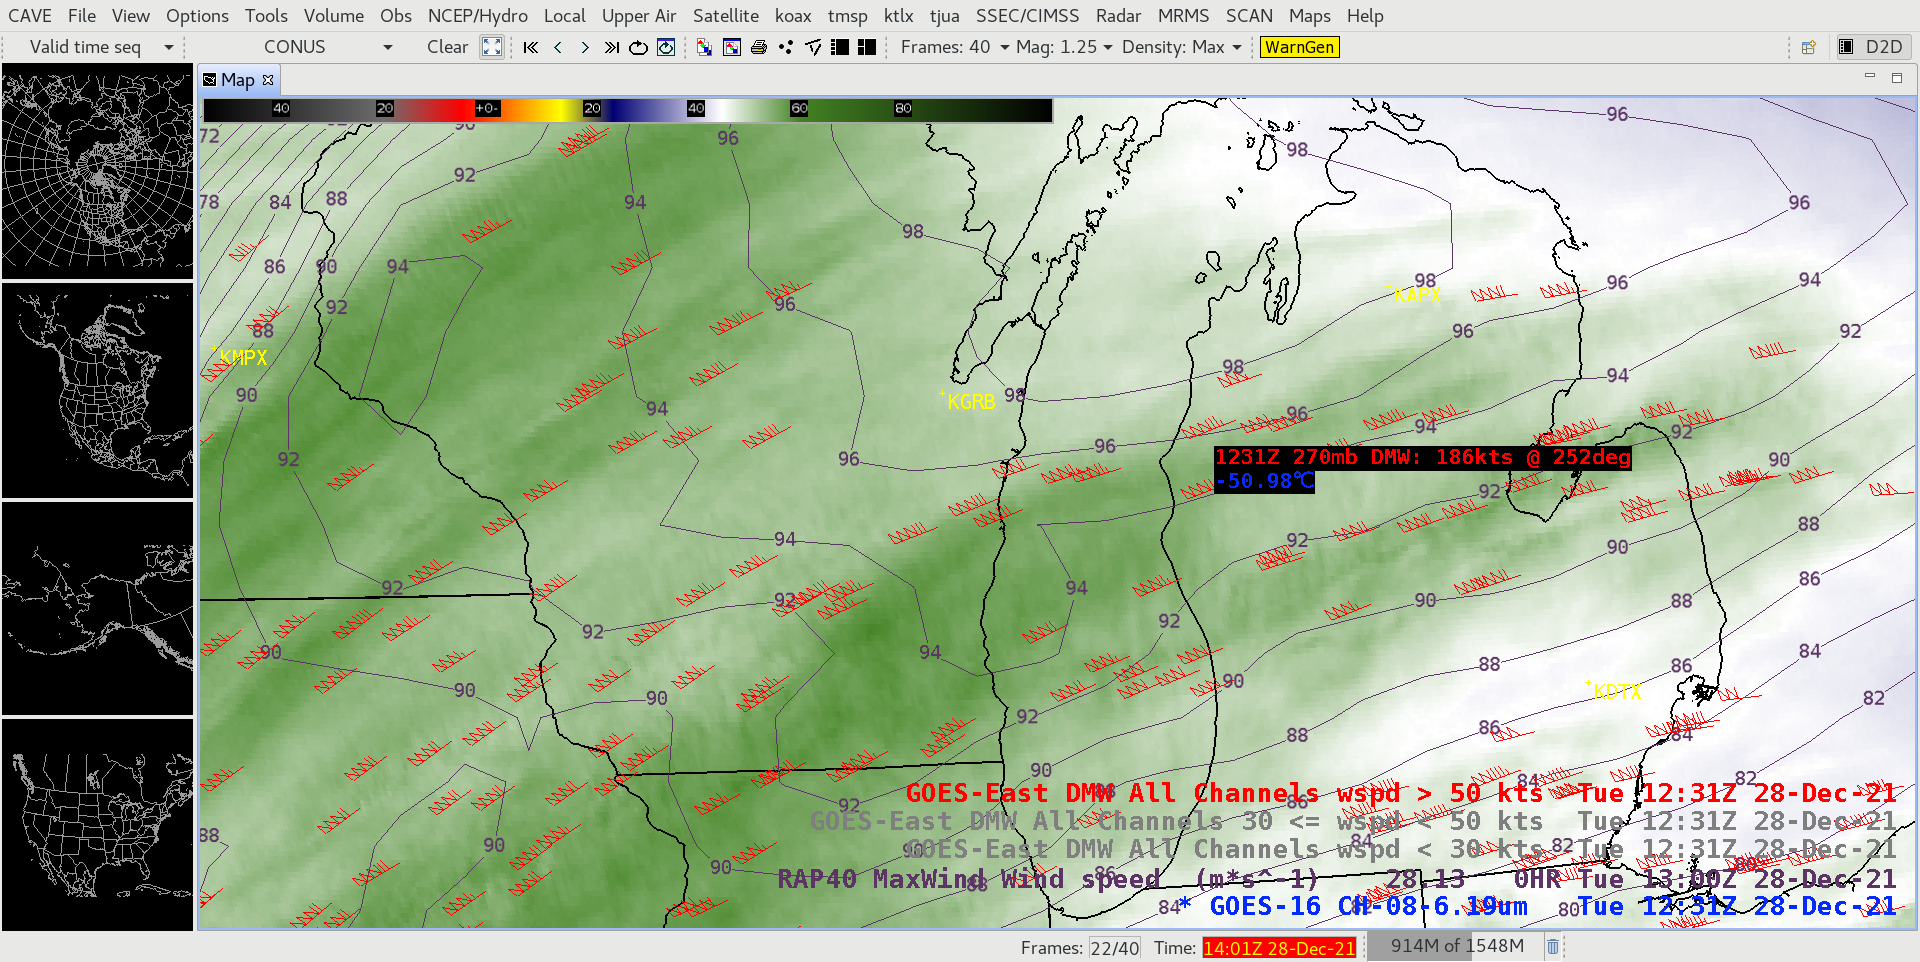
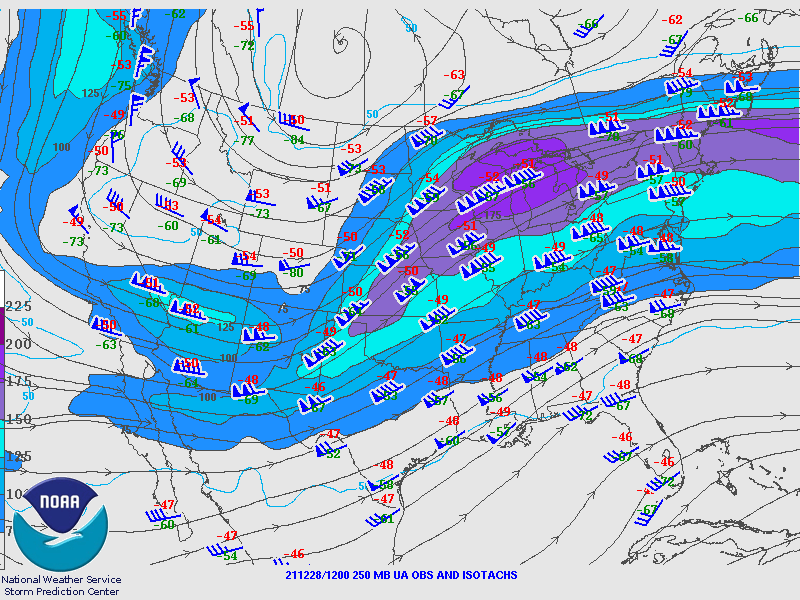
12 hours later, the tail end of the still
anomalously-strong 250 hPa jet streak (
analysis) was moving across Wisconsin and Michigan on the morning of 28 December. The
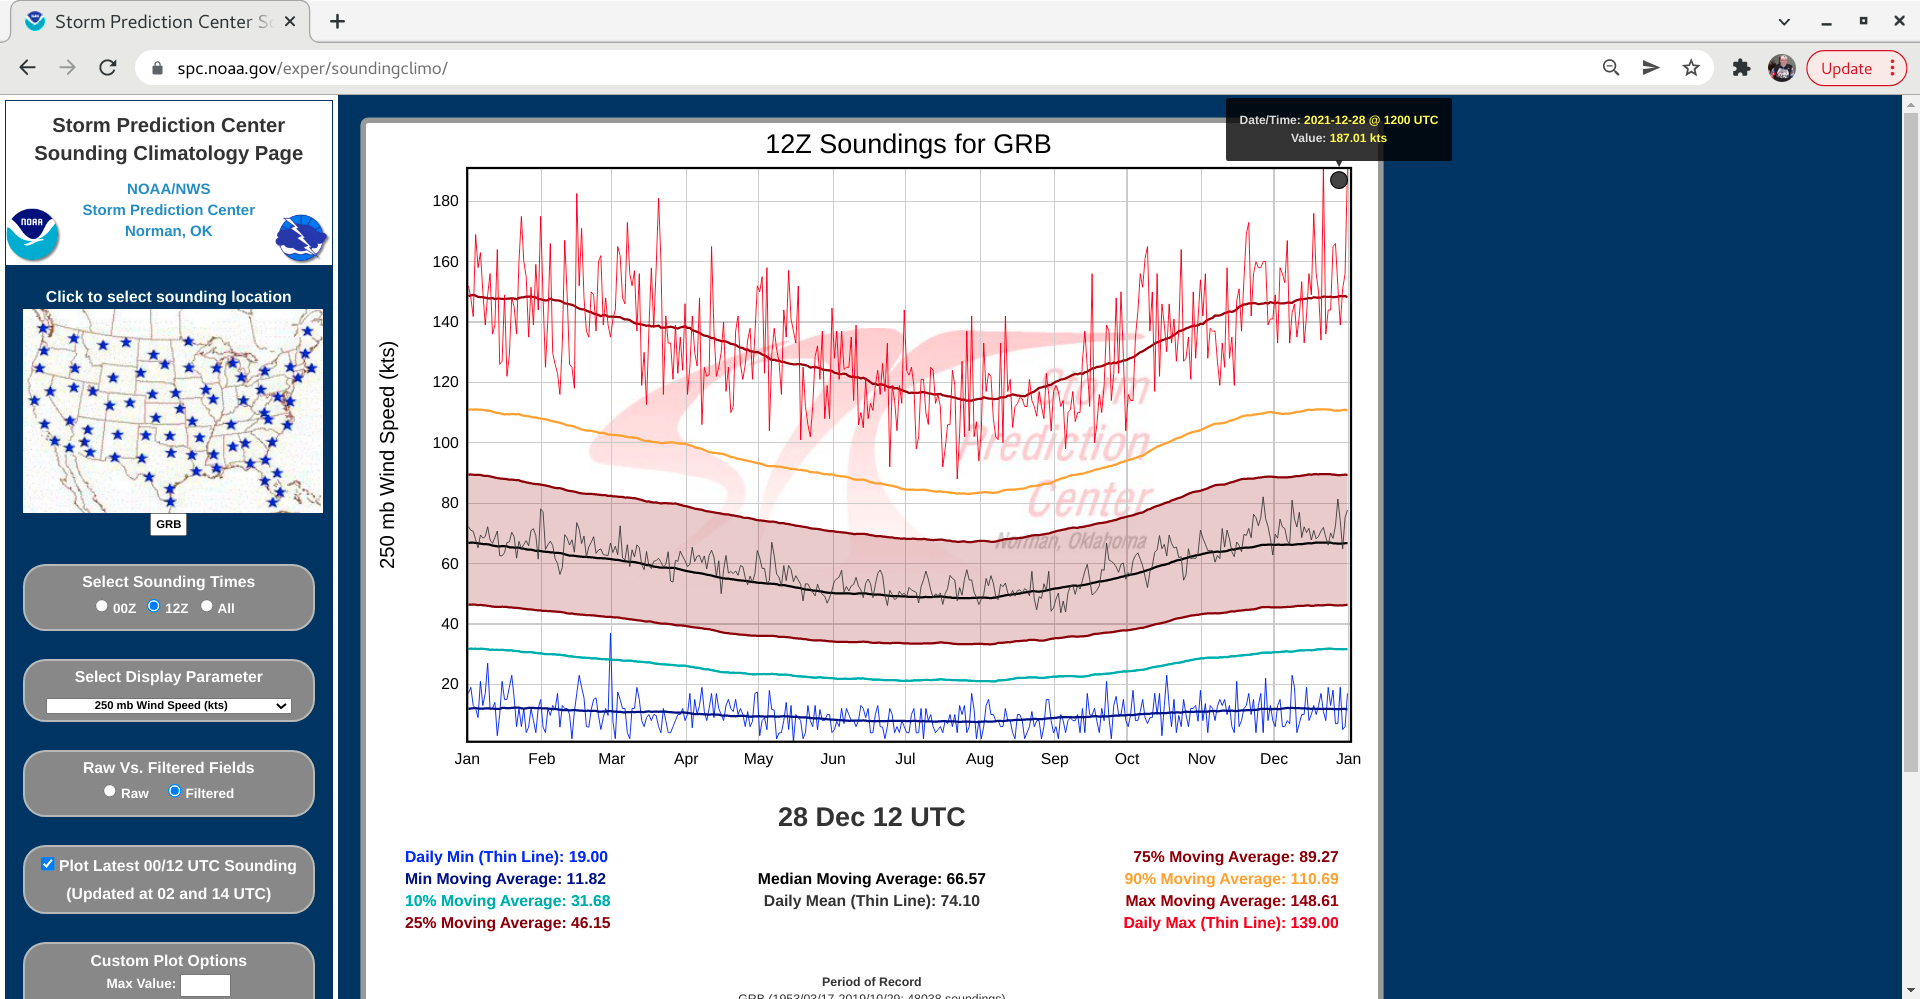
187 knots at Green Bay, Wisconsin was a 250 hPa record for 12 UTC rawinsondes on 28 December at that site, as was the
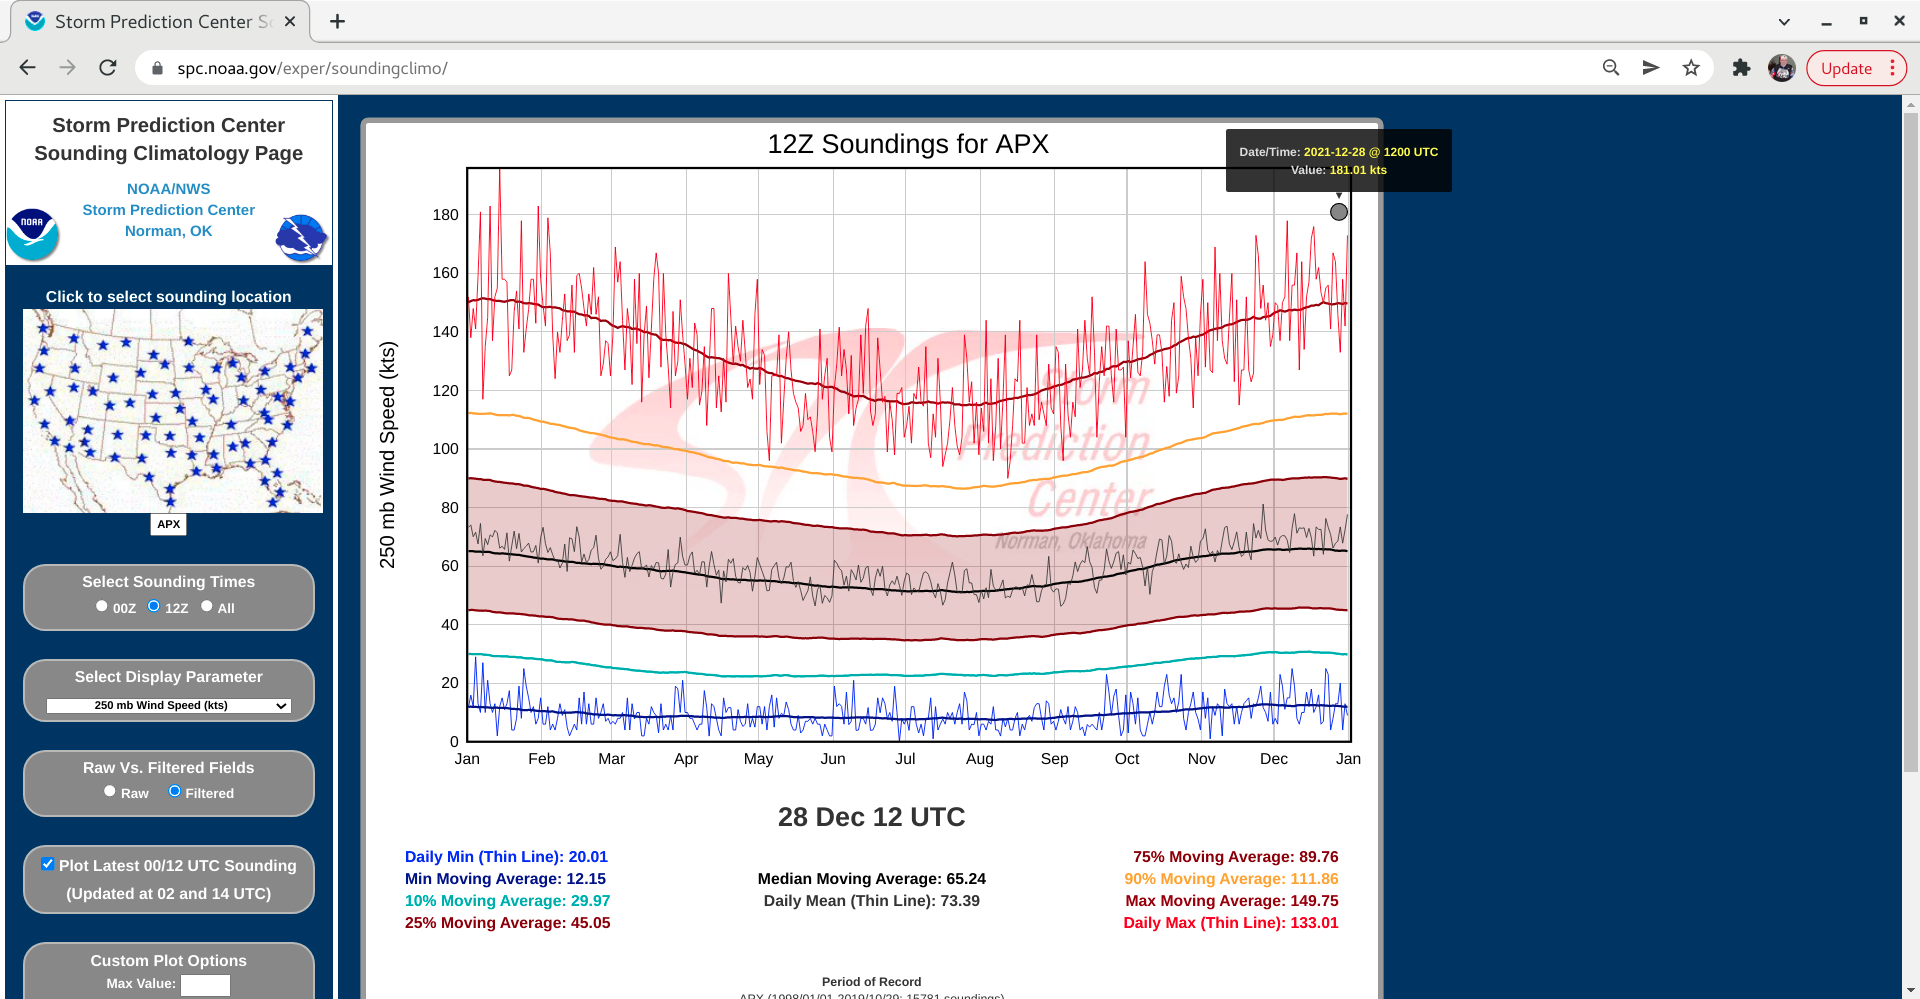
181 knots at Gaylord, Michigan. GOES-16 Upper-level Water Vapor images with plots of Derived Motion Winds and contours of RUC40 model maximum wind speeds
(above) showed this jet streak as it moved over the Green Bay (KGRB) and Gaylord (KAPX) areas.
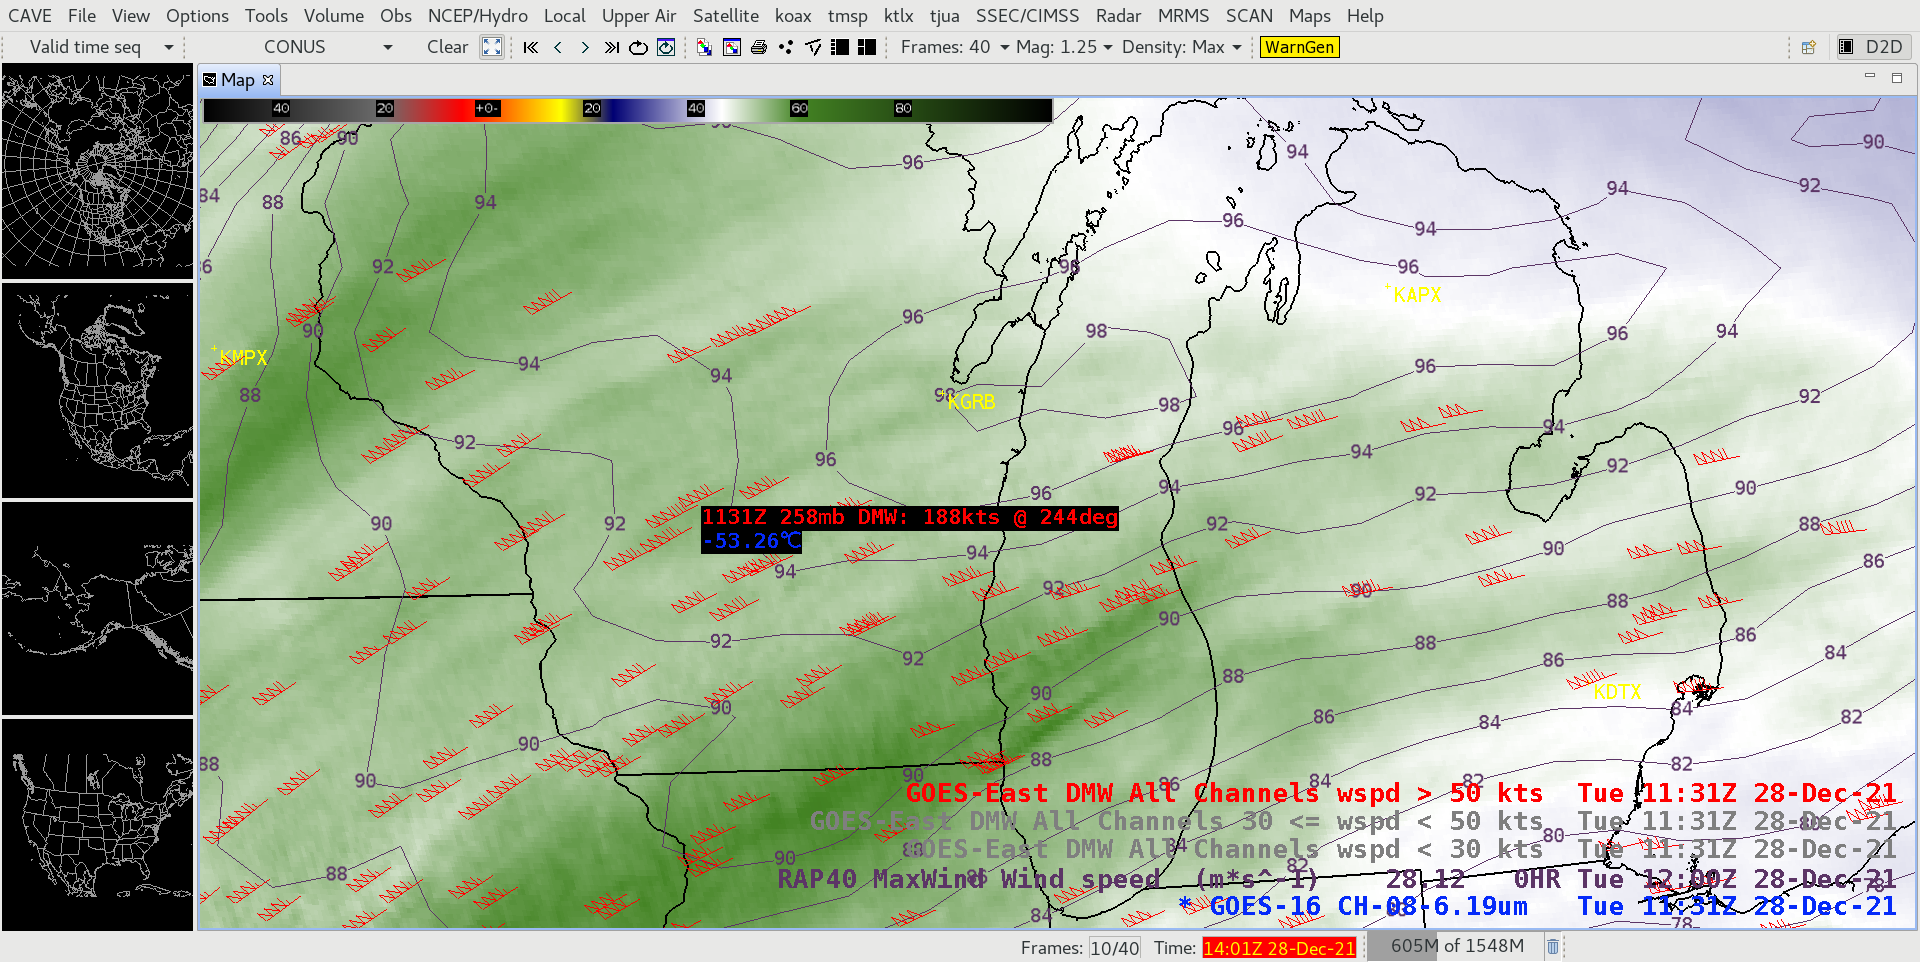
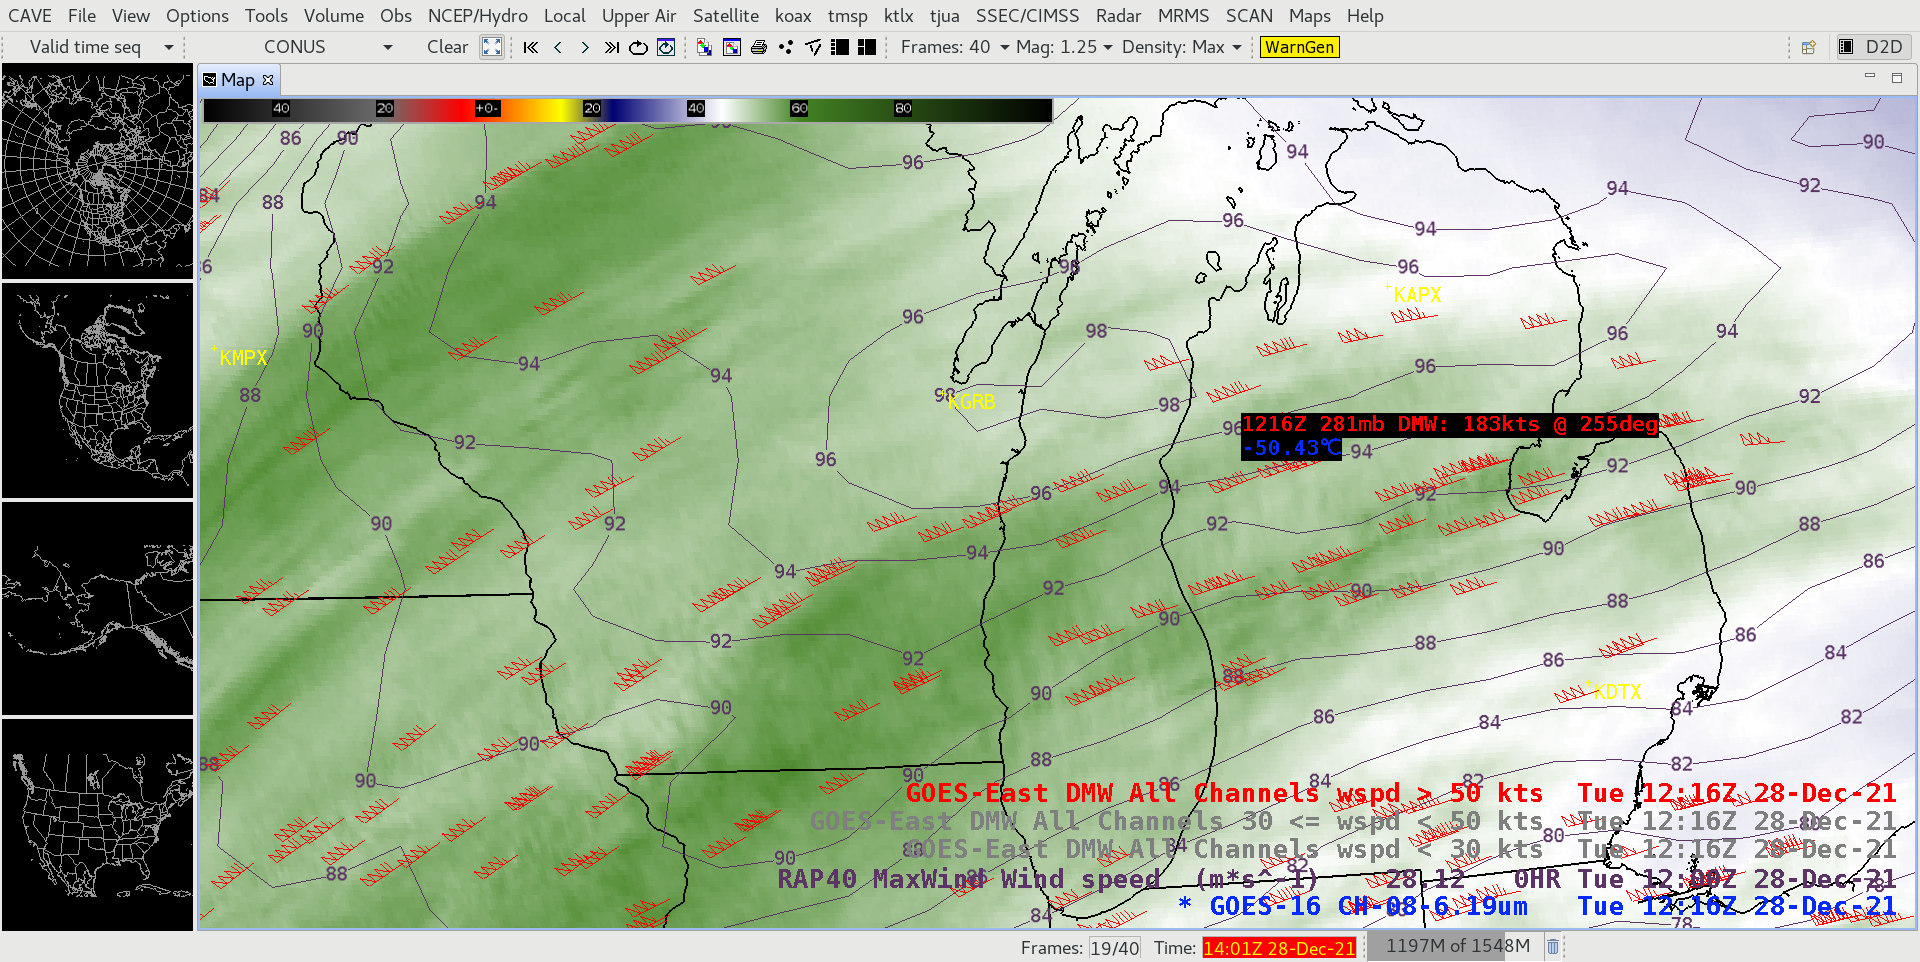
Examples of 3 DMWs over Wisconsin and Michigan having speeds in excess of 180 knots are shown below. The DMW speed values were generally in good agreement with the hourly RAP40 isotachs at the Level of Maximum Winds, demonstrating that DMWs can be useful for model verification.
View only this post
Read Less


