This website works best with a newer web browser such as Chrome, Firefox, Safari or Microsoft
Edge. Internet Explorer is not supported by this website.
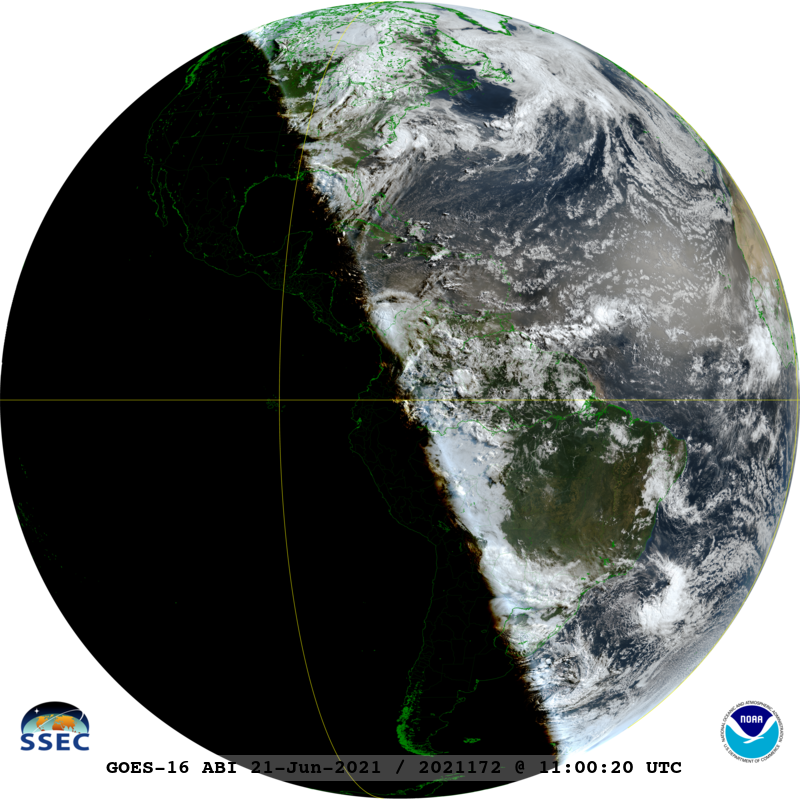
A 2021 solstice to solstice GOES-16 true color composite 11 UTC Full Disk animation.
11 UTC loops of 2021 (so far): durations of 9 and 18 seconds. Also as an animated gif. These posted GOES-16 Full Disk imagery are only showing a small number of the pixels, for a fuller resolution image at one time (20-June-2021).
Interactive web page
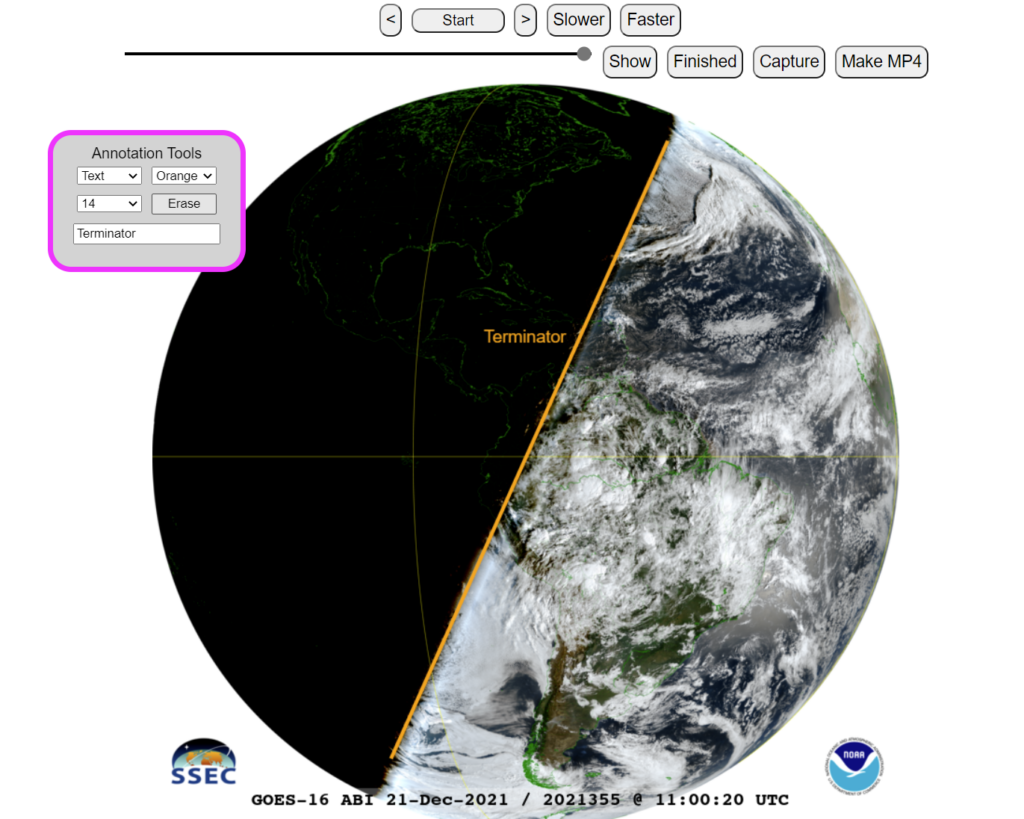
The interactive web page that allows one to annotate images, such as drawing lines. (Click on the image to go to the webapp.) An annotated image, with text and a line. (Click on the image to go to the webapp.)
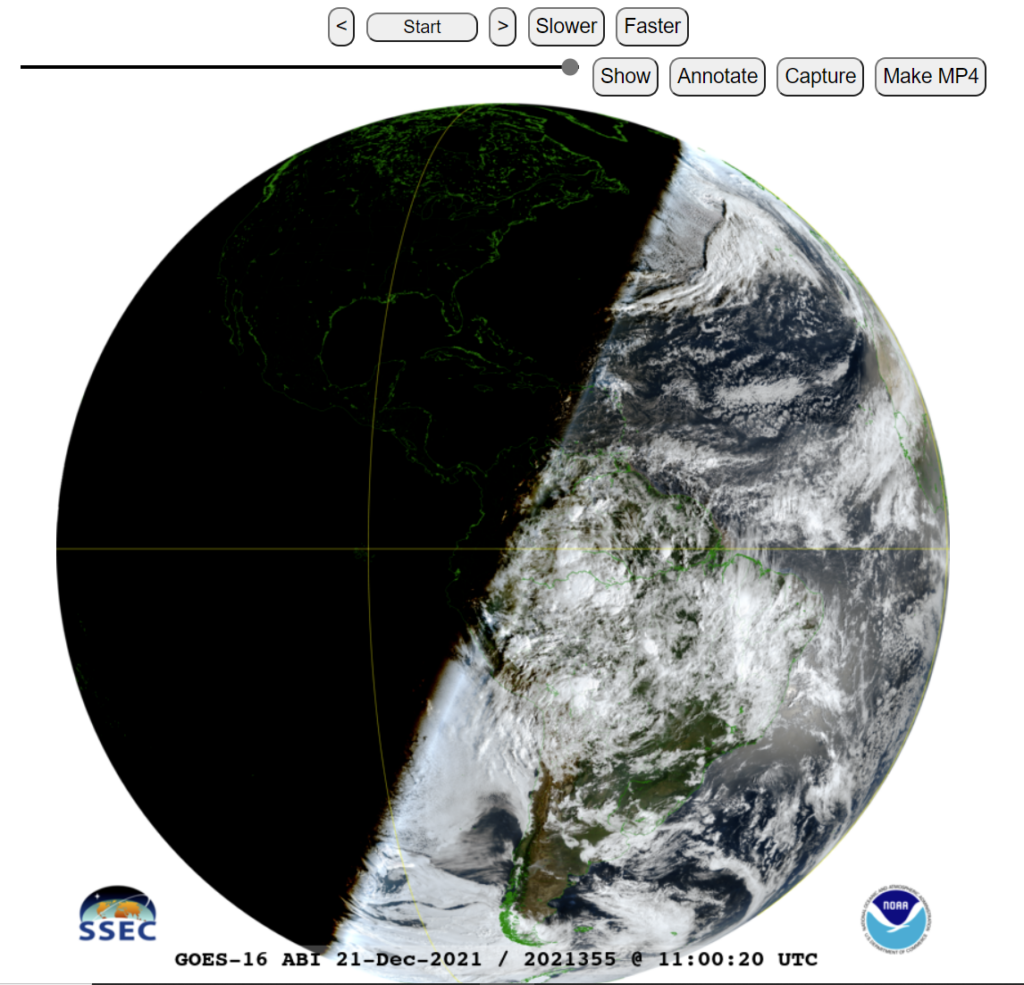
An interactive web page with almost a years worth of GOES ABI Full Disk visible images at 11 UTC. The beginning date is the (northern hemisphere) summer solstice in 2021 and the end date is the winter solstice in 2021. A user can play the animation, as well as annotate the images. For example, draw lines along the terminator for different times of the year. One example might be to compare a solstice to an equinox. Can you estimate the day of the summery equinox? H/T Tom Whittaker, SSEC, for the webapp. Note that the app allows one to save an mp4 animation.
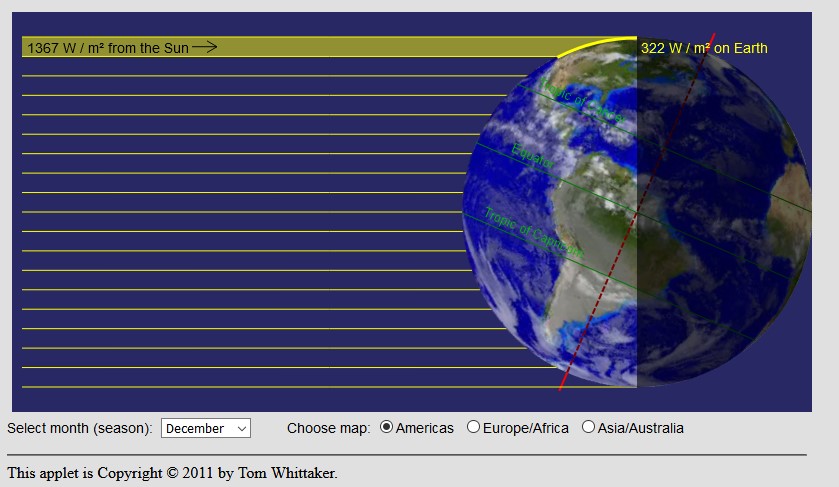
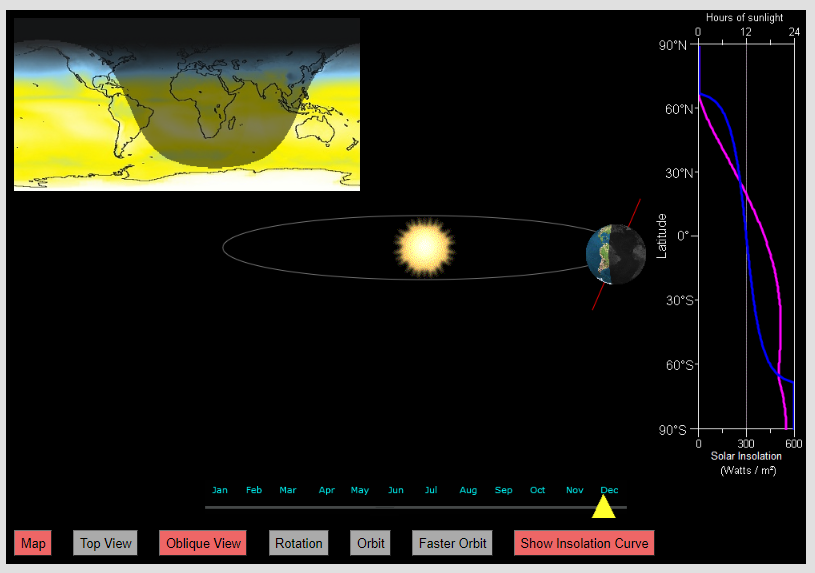
Screen shot of the webapp where one can explore the effect of the angle of incidence on sun’s energy. (Click on the image to go to the webapp.)Explore the changing seasons on Earth by relating the orbit, rotation and solar insolation with this webapp by T. Whittaker. (Click on the image to go to the webapp.)
H/T
These images were made using NOAA data with geo2grid, from UW-Madison, SSEC.
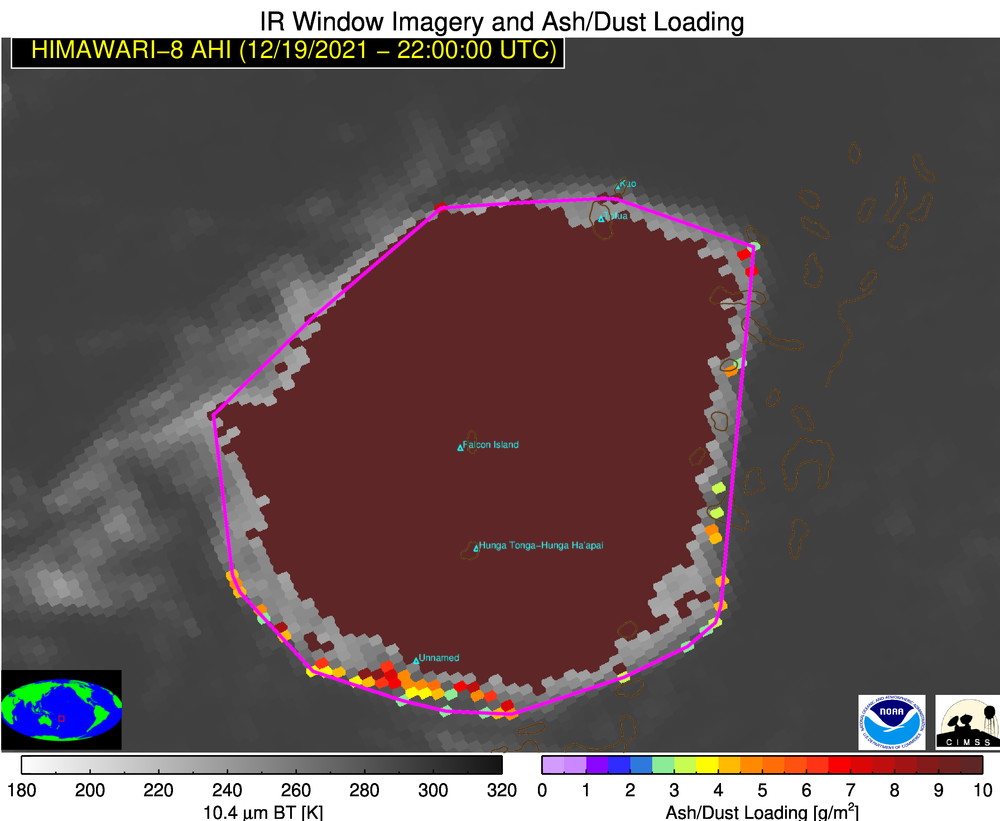
The Hunga Tonga-Hunga Ha?apai volcano in Tonga violently erupted around 2030 UTC on 19 December 2021 — and a radiometrically-retrieved Ash Height product from the NOAA/CIMSS Volcanic Cloud Monitoring site (using JMA Himawari-8 data) indicated that ash was ejected as high as 16-18 km (above).Ash Loading was very high within the volcanic cloud, with particles... Read More
Ash Height product [click to play animated GIF | MP4]
The Hunga Tonga-Hunga Ha?apai volcano in Tonga violently erupted around 2030 UTC on 19 December 2021 — and a radiometrically-retrieved Ash Height product from the NOAA/CIMSS Volcanic Cloud Monitoring site (using JMA Himawari-8 data) indicated that ash was ejected as high as 16-18 km (above).
Ash Loading was very high within the volcanic cloud, with particles having a large Ash Effective Radius (below).
Ash Loading product [click to play animated GIF | MP4]
Ash Effective Radius product [click to play animated GIF | MP4]
In GOES-17 (GOES-East)Ash RGB images created using Geo2Grid(below), brighter shades of yellow indicated that significant concentrations of SO2 were present within the volcanic cloud — while shades of red supported the presence of ash.
GOES-17 Ash RGB images [click to play animated GIF | MP4]
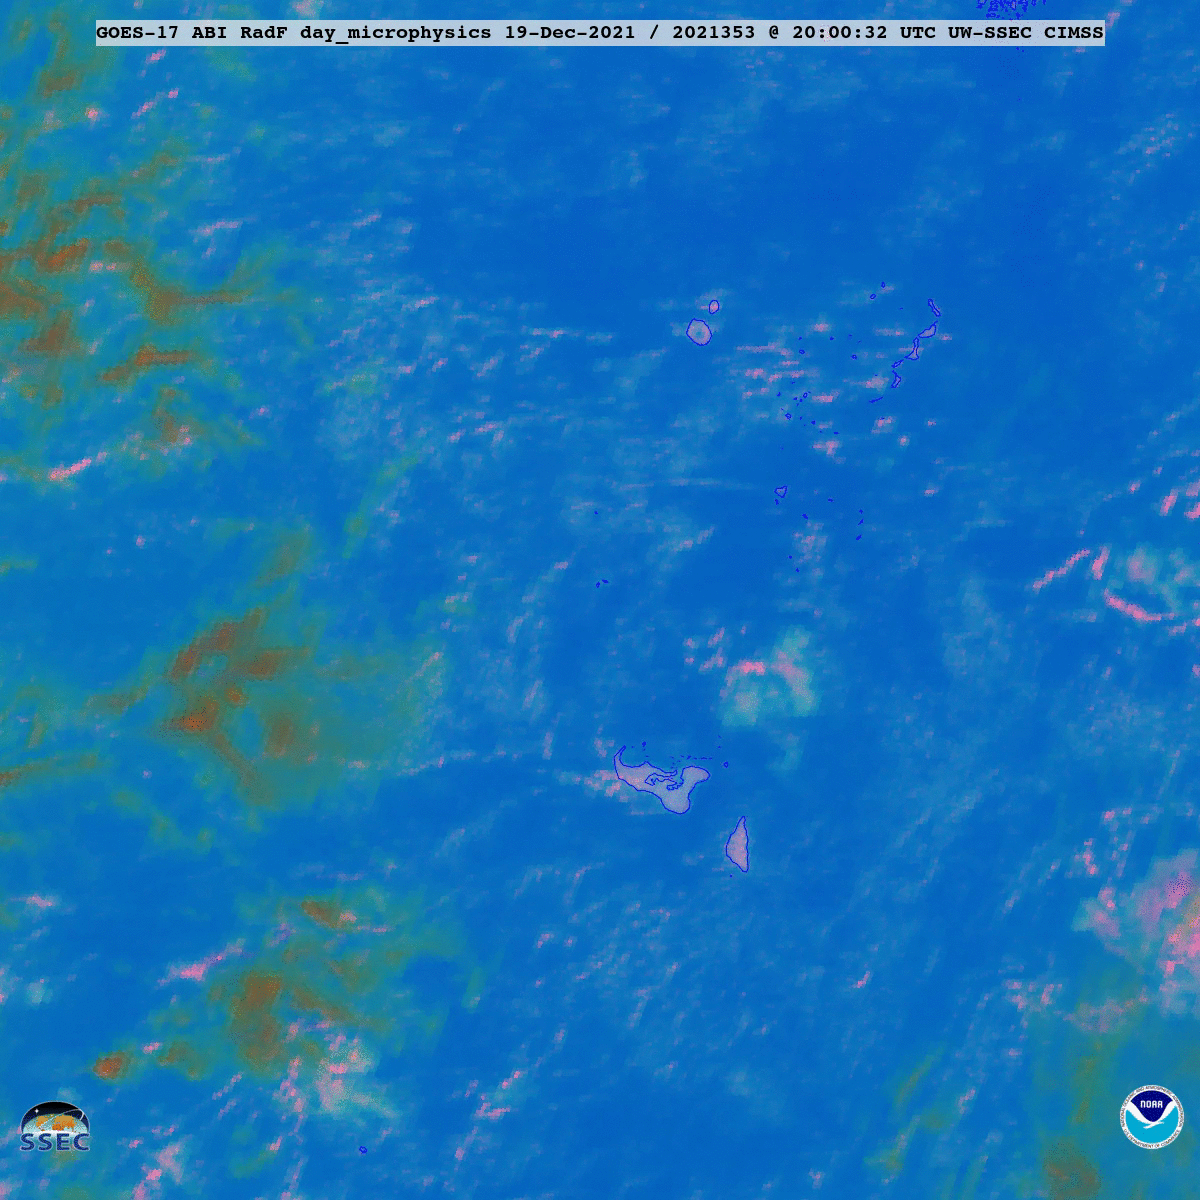
GOES-17 Day Cloud Phase Distinction RGB images (below) clearly showed the expansion of the glaciated volcanic cloud (brighter shades of orange).
GOES-17 Day Cloud Phase Distinction RGB images (credit: Tim Schmit, NOAA/NESDIS/ASPB) [click to play animated GIF | MP4]
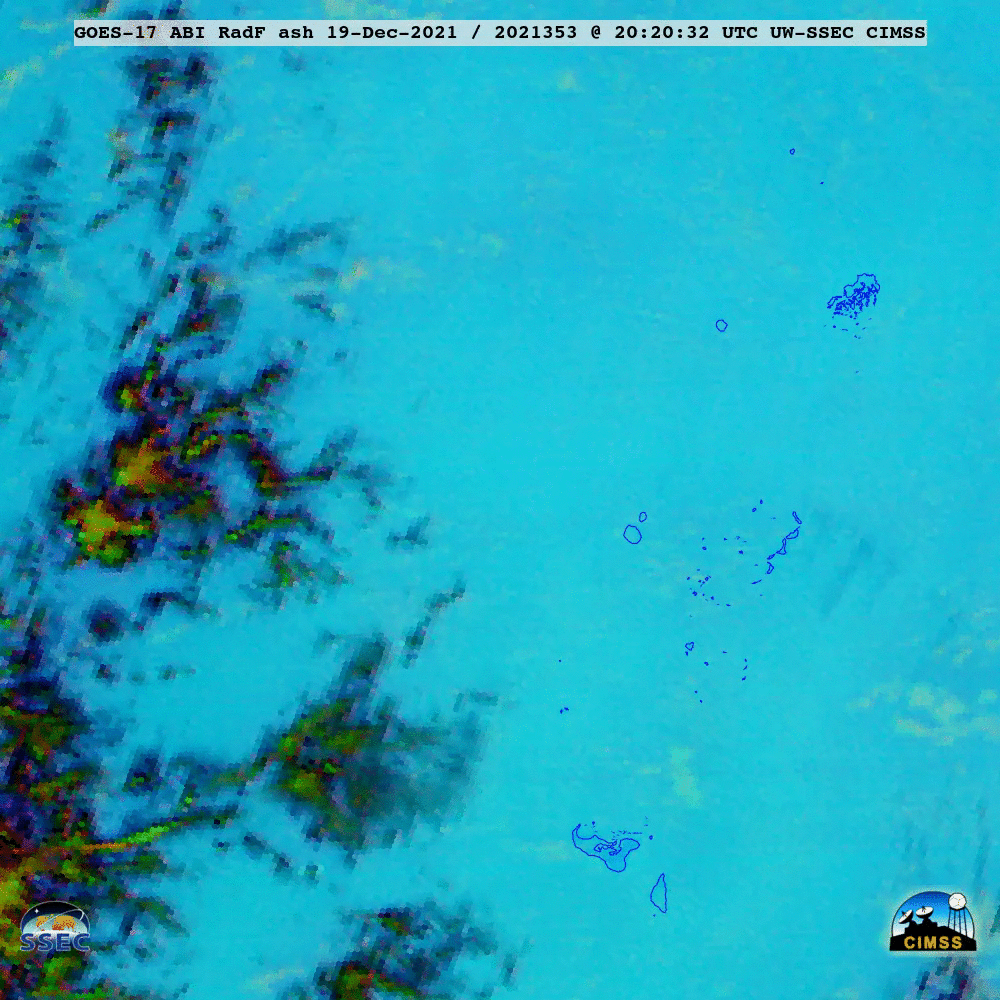
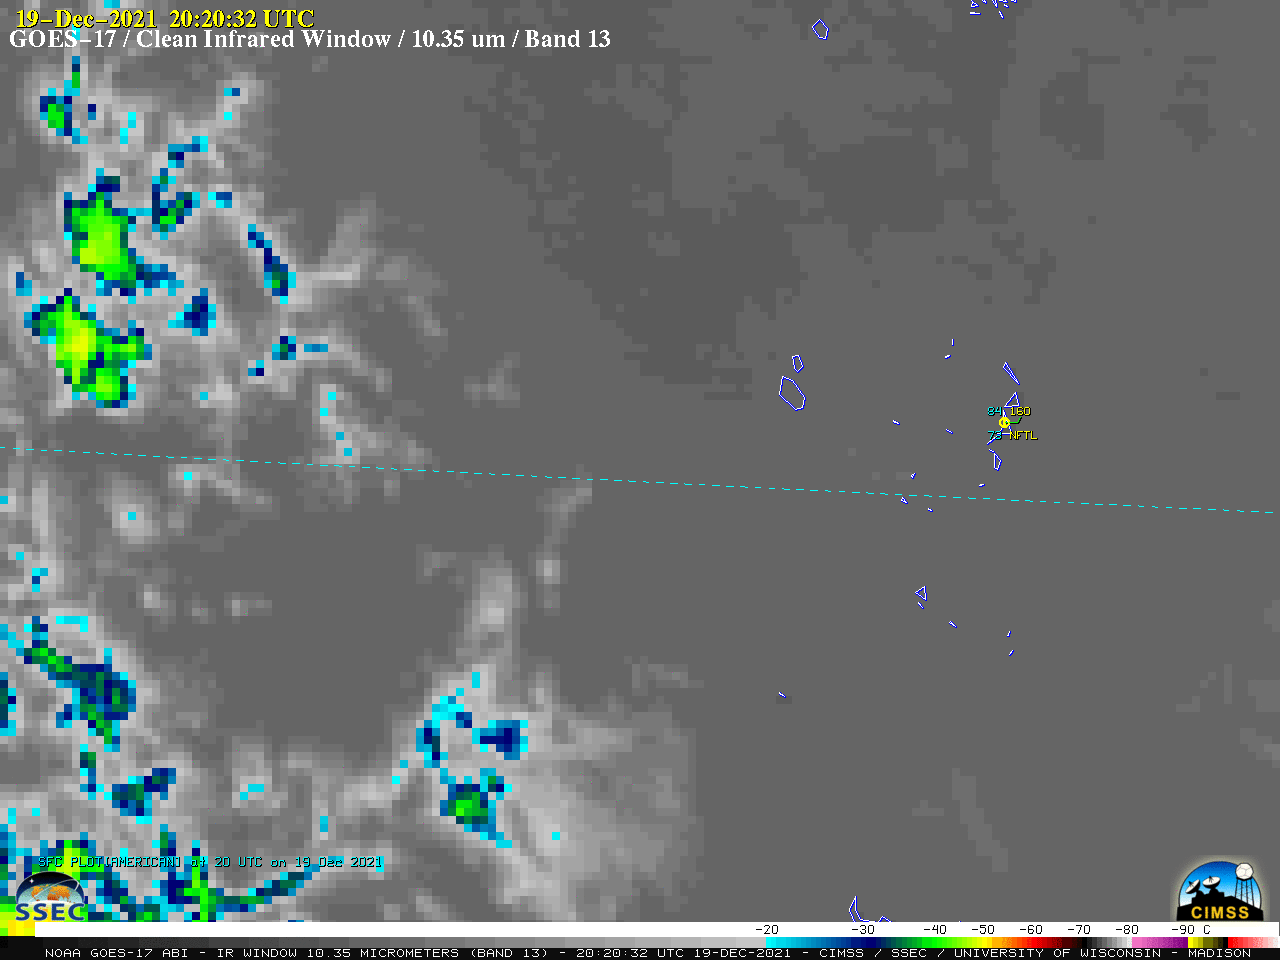
GOES-17 “Clean” Infrared Window (10.35 µm) images (below) indicated that the coldest cloud-top infrared brightness temperatures were in the -80 to -89C range (shades of violet).
GOES-17 “Clean” Infrared Window (10.35 µm) images [click to play animated GIF | MP4]
Here's another cool view of the Tonga volcanic eruption
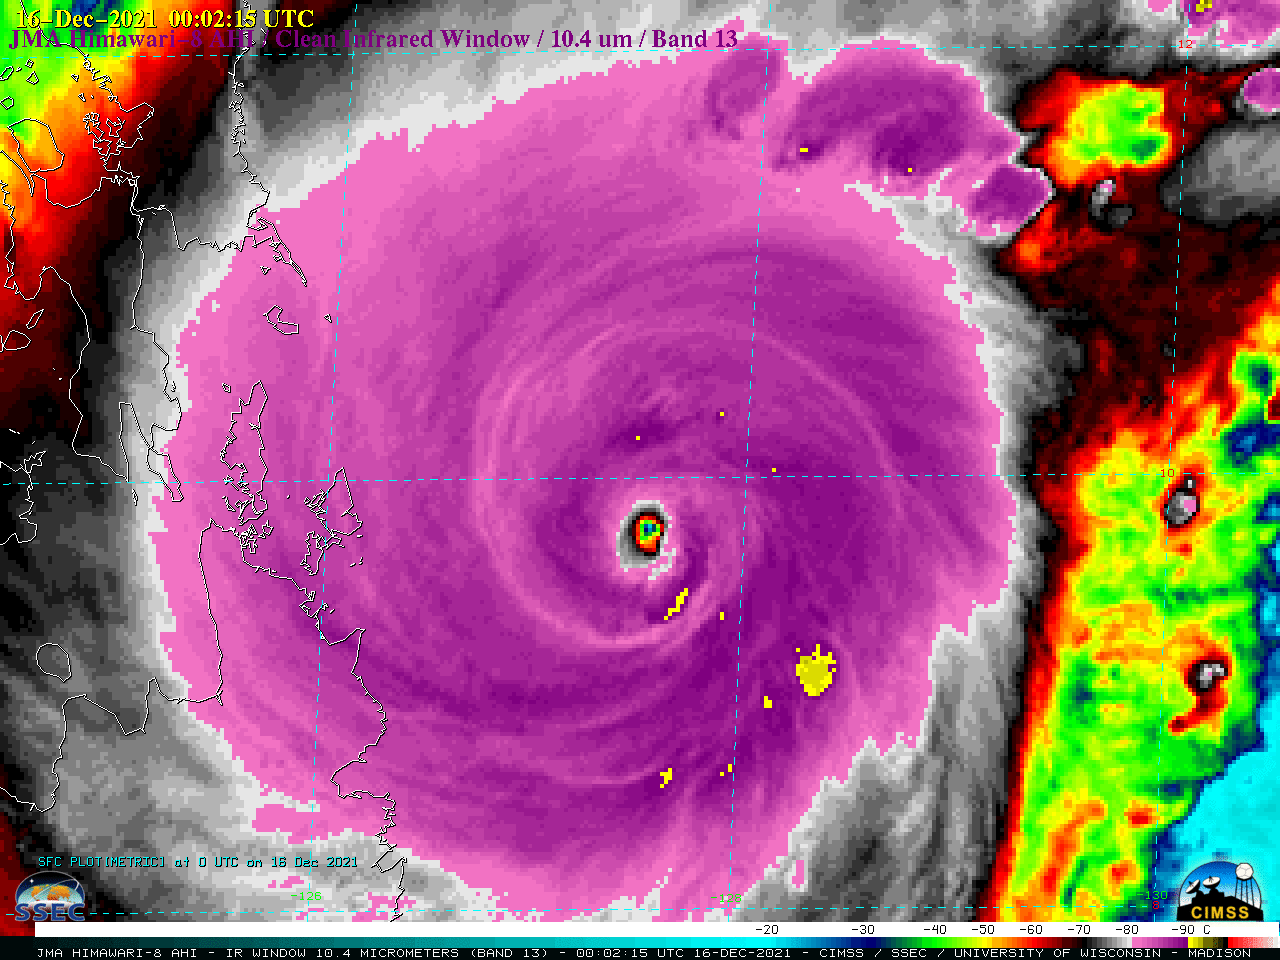
For the second time during its life cycle, Typhoon Rai reached Category 5 intensity (ADT | SATCON) east of Vietnam during the 18-19 December 2021 period. JMA Himawari-8 Infrared Window (10.3 µm) images (above) showed cloud-top infrared brightness temperatures of -90C and colder at times around the eye. VIIRS Infrared Window... Read More
Himawari-8 Infrared Window (10.3 µm) images [click to play animated GIF | MP4]
For the second time during its life cycle, Typhoon Rai reached Category 5 intensity (ADT | SATCON) east of Vietnam during the 18-19 December 2021 period. JMA Himawari-8 Infrared Window (10.3 µm) images (above) showed cloud-top infrared brightness temperatures of -90C and colder at times around the eye.
VIIRS Infrared Window (11.45 µm) images from NOAA-20 and Suomi-NPP as viewed using RealEarth(below) provided a more detailed view of Rai around the time that it reached Category 5 intensity.
VIIRS Infrared Window (11.45 µm) images from NOAA-20 and Suomi-NPP [click to enlarge]
3 days earlier, Rai first reached reached Category 5 intensity at 0000 UTC on 16 December, shortly before making landfall in the Philippines; 2.5-minute Himawari-8 Infrared images (below) revealed a small-diameter “pinhole” eye. As Rai moved across the Philippines, it was responsible for hundreds of fatalities in addition to widespread flooding and power outages.
Himawari-8 Infrared Window (10.3 µm) images [click to play animated GIF | MP4]
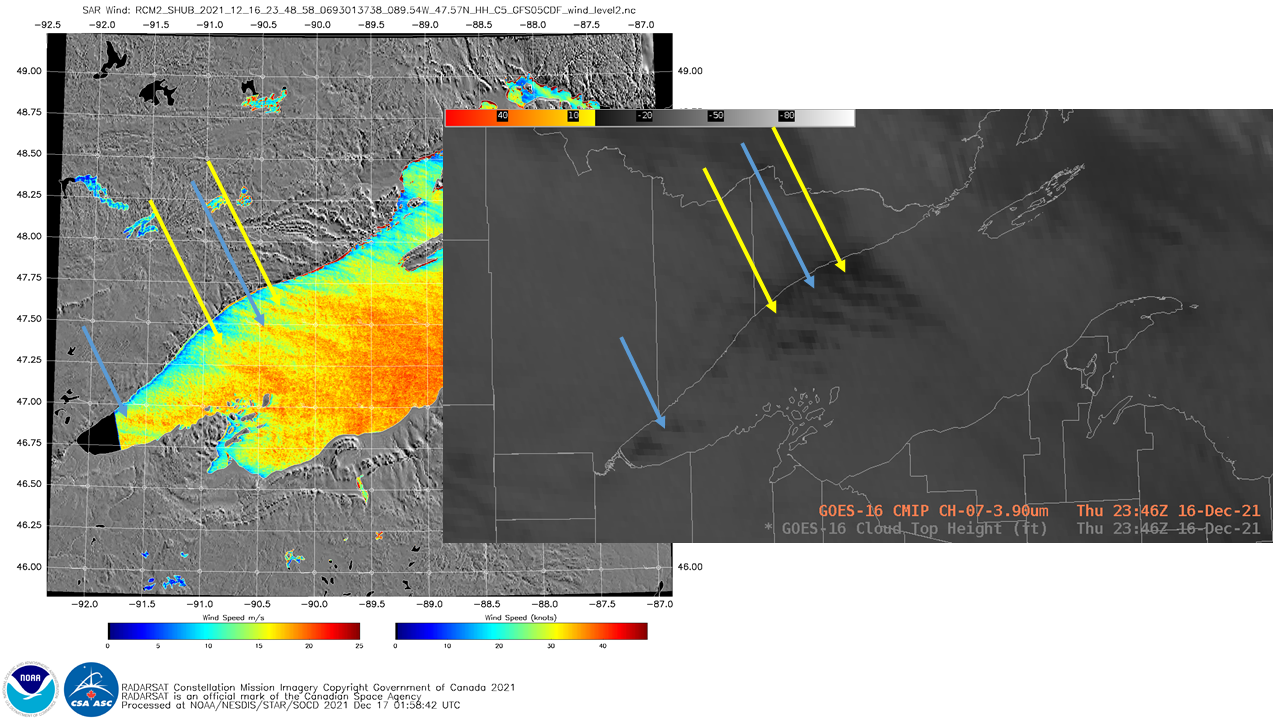
Synthetic Aperture Radar (SAR) winds in select small domains are routinely available (with good latency, i.e., within 2 or 2-1/2 hours) at this website. Coverage over the Great Lakes typically occurs within an hour of 0000 UTC and 1200 UTC on each day. The image above (direct link) shows derived SAR winds... Read More
SAR winds from satellite RCM2 at 23:48:58 UTC on 16 December 2021 (Click to enlarge)
Synthetic Aperture Radar (SAR) winds in select small domains are routinely available (with good latency, i.e., within 2 or 2-1/2 hours) at this website. Coverage over the Great Lakes typically occurs within an hour of 0000 UTC and 1200 UTC on each day. The image above (direct link) shows derived SAR winds (from the RCM2 satellite) over Lake Superior at 2348 UTC on 16 December 2021. Winds over Lake Superior are around 40 knots; weaker wind speeds are indicated in the lee of Isle Royale, the various Apostle Islands, Upper Michigan’s Keewenaw Peninsula, near Marquette Bay, and right offshore Minnesota. Fingers of stronger winds extend east-southeastward from just off the Minnesota shoreline. This small horizontal variability in the wind speeds is too small to be detected by other microwave detectors (such as ASCAT on Metop-B and Metop-C).
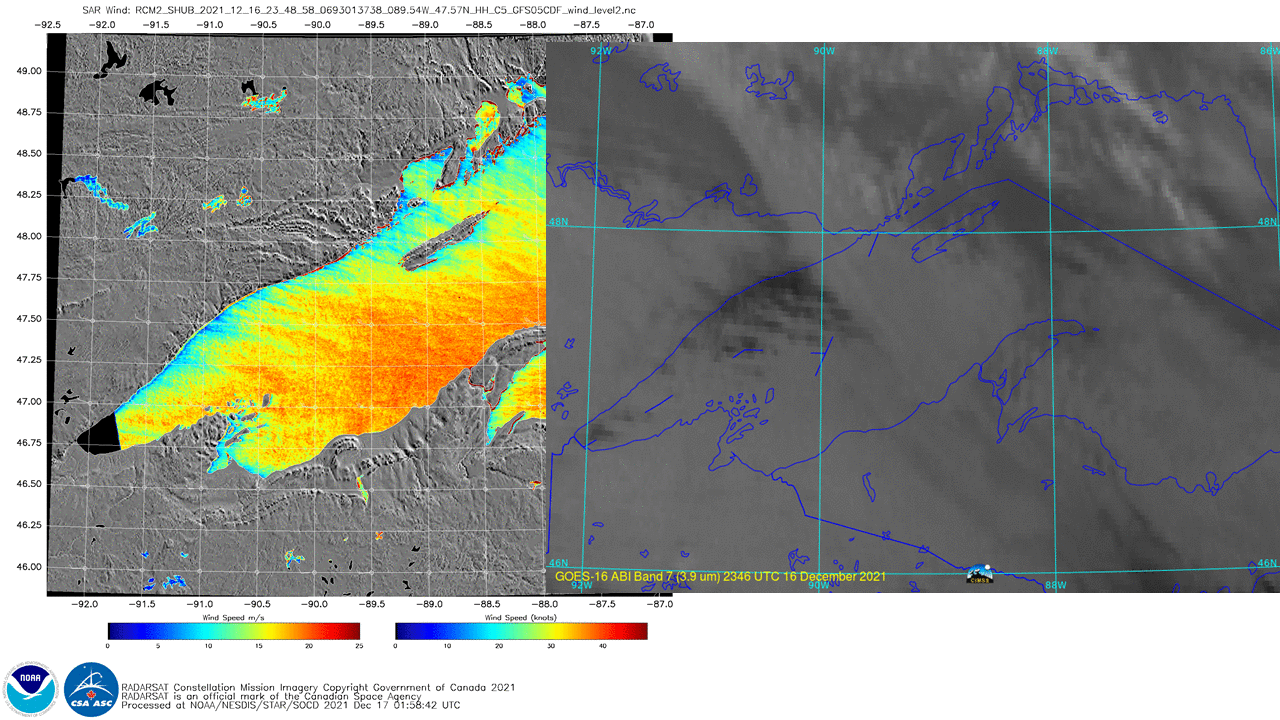
RCM2 SAR Winds at 2348 UTC, 16 December (left) along with annotated GOES-16 ABI Band 7 (3.9 µm) imagery at 2346 UTC, 16 December 2021 (right); arrows suggest the same structures in both figures (Click to enlarge)
The toggle above shows the winds with a time-matched image of GOES-16 Band 7 (3.9 µm) data (created using Geo2Grid), stretched to enhance low-level clouds. The second toggle includes best-guess location-matched arrows of features in the SAR winds and the GOES-16 ABI brightness temperature. That figure is reproduced below with an AWIPS display of GOES-16 3.9 µm imagery at 2346 UTC (again with a stretched colortable to emphasize low-level temperature contrast).
RCM2 SAR Winds at 2348 UTC, 16 December (left) along with annotated GOES-16 ABI Band 7 (3.9 µm) imagery at 2346 UTC, 16 December 2021 (right); arrows point to similar structures in both images (Click to enlarge)
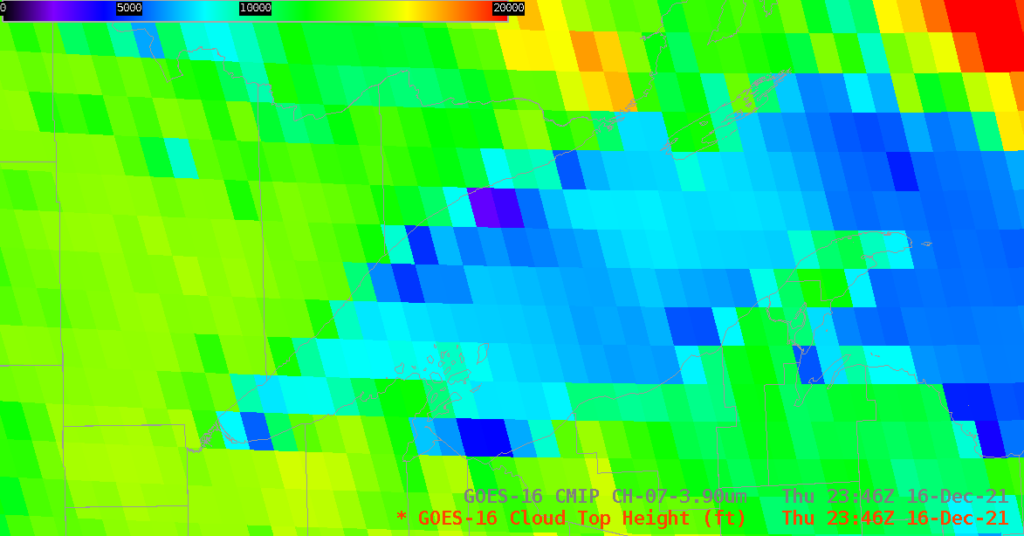
GOES-16 satellite imagery over Lake Superior will have a parallax shift because the location is far from satellite nadir. Parallax shift is related to cloud-top heights, and derived Cloud-Top Heights (a Level 2 product) over the region show cloud tops between 3000 and 5000 feet near Minnesota, rising to about 7000 feet over Lake Superior in between Minnesota and the Keewenaw Peninsula. This parallax shift means that features will be displayed to the north and a bit to the west of their true location, displaced away from the GOES-16 sub-satellite point at 0oN, 75.2o W.
GOES-16 Derived Cloud Height, 2346 UTC on 16 December 2021 (Click to enlarge)
These images suggest that lake-effect clouds are regions of enhanced wind speeds. The inferred convective roll vortices present in the satellite imagery are also regions of enhanced convergence and upward moisture transport.


