Snow Squall Warnings over Duluth Minnesota and northwestern Wisconsin
The animation above, of the Day Cloud Phase Distinction RGB, shows bands of snow showers/squalls rotating cyclonically through northern Minnesota and northwestern Wisconsin, to the south of a strong cyclone over northern Minnesota and northwestern Ontario (link to map from 1800 UTC on 18 February). The tops of these clouds are fairly low — in the RGB they have a periwinkle color in contrast to the orange/red color of the higher cirrus to the south. The RGB also allows for good contrast between the clouds and the clear snow-covered grounds (with greenish tones) to the west.
A potency of the upper air system supporting the surface cyclone is highlighted in the Ozone Anomaly fields from gridded NUCAPS data, shown below. Anomalies of 120-140 dobson Units are present.
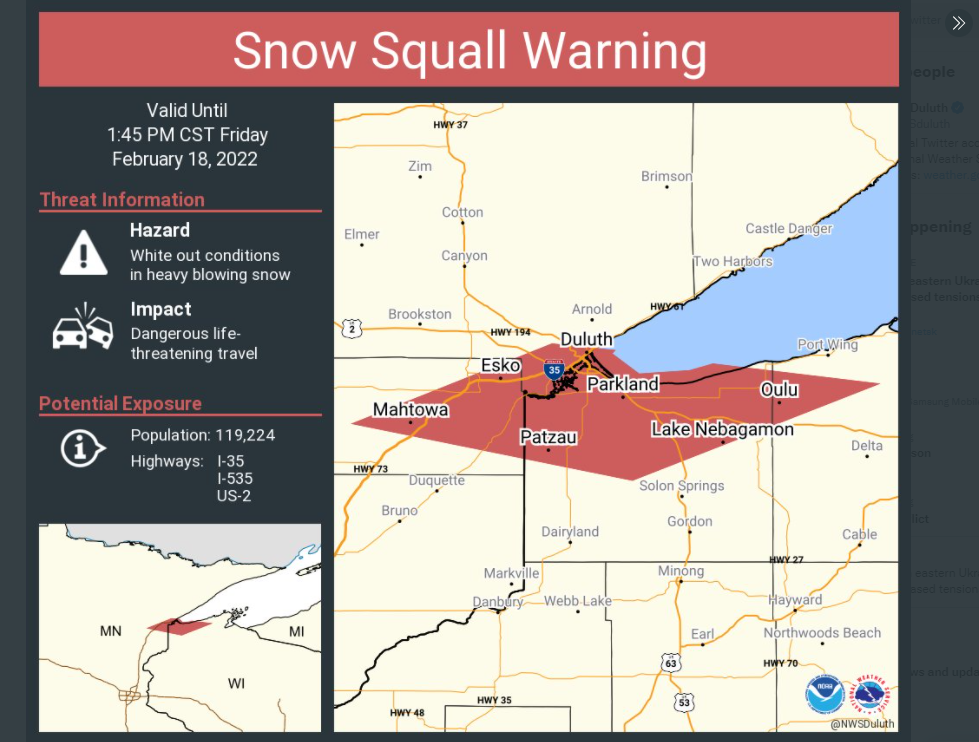
The National Weather Service in Duluth MN issued a series of Snow Squall Warnings; the first one, valid until 1945 UTC, is shown below (taken from this tweet); sequential tweeted Warnings are here (valid until 2015 UTC), here (valid until 2100 UTC), here (valid until 2145 UTC) and here (valid until 2215 UTC). (Note, WFO ARX — in Lacrosse, WI, is issuing Snow Squall warnings for this system as well!)
Three radars for this event are shown below: 1907, 1937 and 2007 UTC.
VIIRS imagery (available from the CIMSS LDM feed) over the Duluth Area afforded a high-resolution view of this event. The toggles below show True and False Color imagery at 1838 UTC (from Suomi NPP) and at 1929 UTC (from NOAA-20) At 1838 UTC, the clouds producing the snow — between Moose Lake and Floodwood — do not stand out. They are much more noticeable in the 1929 UTC image, southeast of Duluth and northwest of Solon Springs.
What was the effect on visibility? That is shown in the animation below with a 10-minute time step. Note how Duluth goes from southwesterly winds with light snow and 5- to 10- mile visibility to strong northwest winds (gusts to 45 knots) and reduced visibilities as the squall moves through.
As this front moved through southern Wisconsin, it generated lightning, as shown in the animation below (from this website).