This website works best with a newer web browser such as Chrome, Firefox, Safari or Microsoft
Edge. Internet Explorer is not supported by this website.
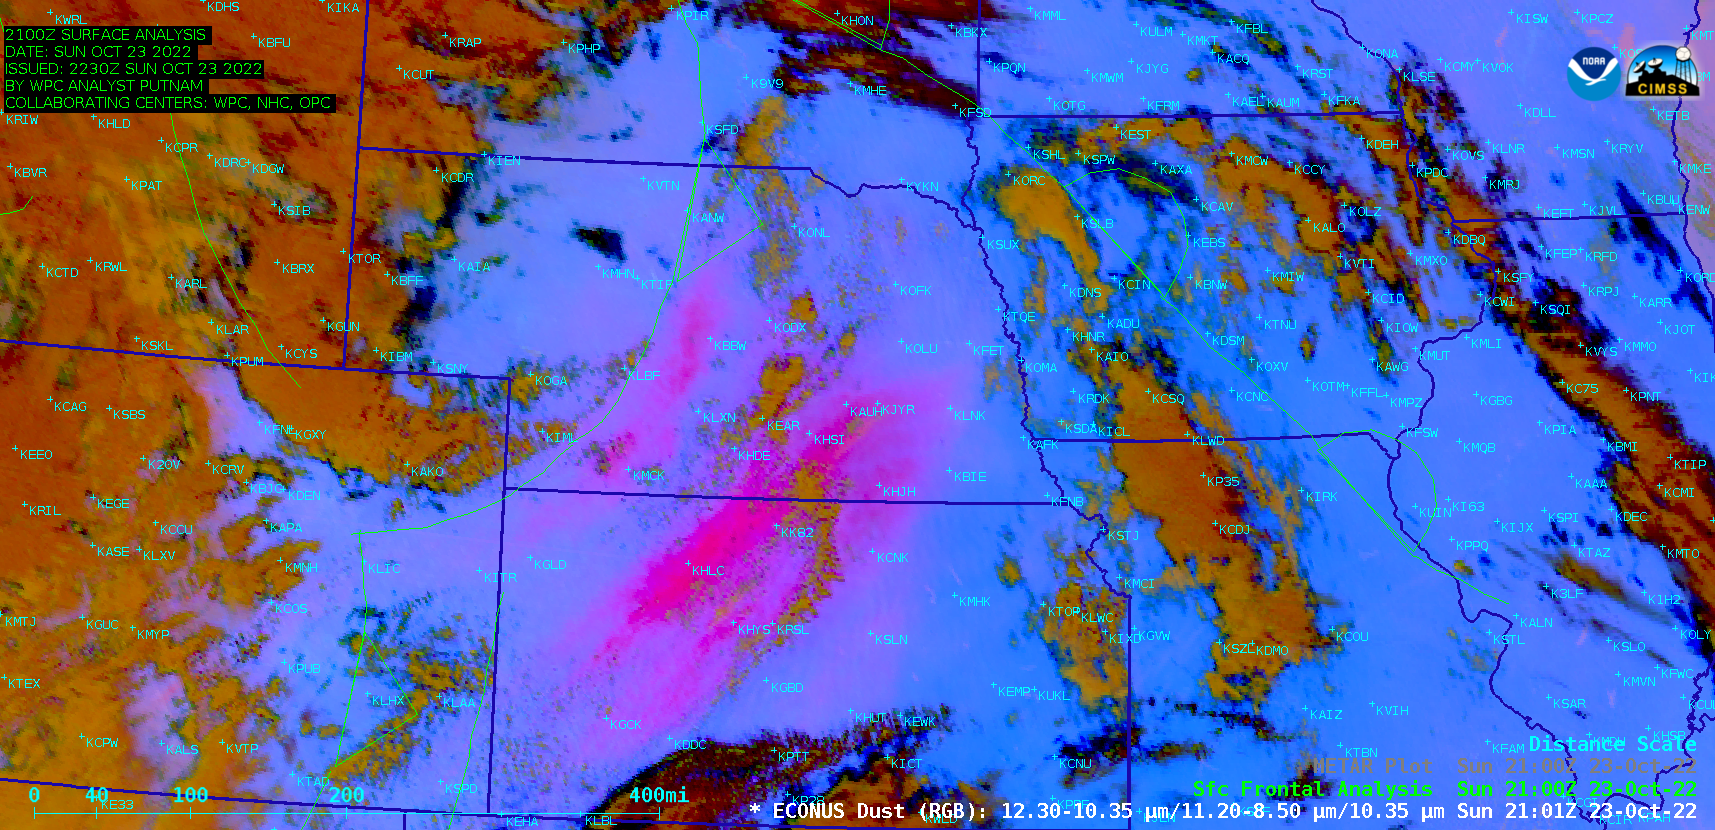
GOES-16 (GOES-East) Dust RGB images (above) highlighted large plumes of blowing dust (brighter shades of pink) — lofted by strong southwesterly winds (gusting in excess of 60 mph) ahead of an approaching cold front — across parts of the Central Plains on 23 October 2022. This blowing dust resulted in surface visibility... Read More
GOES-16 Dust RGB images, with and without plots of hourly surface observations [click to play animated GIF | MP4]
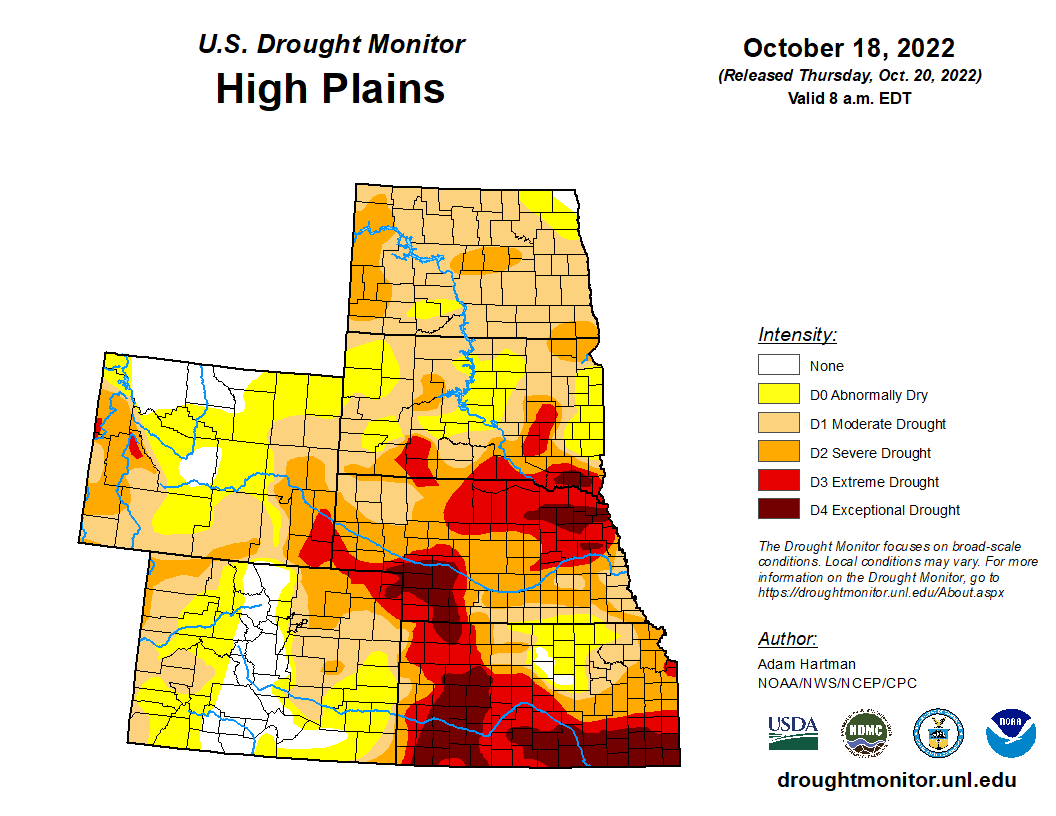
GOES-16 (GOES-East)Dust RGB images (above) highlighted large plumes of blowing dust (brighter shades of pink) — lofted by strong southwesterly winds (gusting in excess of 60 mph) ahead of an approaching cold front — across parts of the Central Plains on 23 October 2022. This blowing dust resulted in surface visibility values as low as 1 mile at locations such as Liberal KS and Burlington CO. The source region of the largest dust plume was western Kansas, an area experiencing exceptional to extreme drought conditions (according to the US Drought Monitor site).
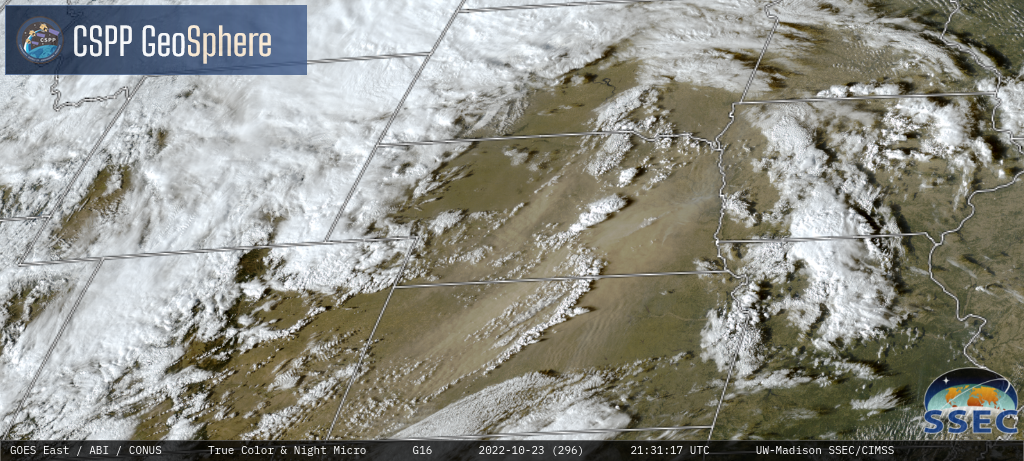
GOES-16 True Color RGB and Nighttime Microphysics RGB images from the CSPP GeoSphere site (below) showed this blowing dust as lighter shades of tan during the daytime and varying shades of pink during the nighttime. Dust was transported as far northeastward as southern Minnesota and far western Wisconsin by 04 UTC on 24 October; dust briefly reduced the visibility to 4 miles at Sioux City IA and 6 miles at Yankton SD.
GOES-16 True Color RGB and Nighttime Microphysics RGB images [click to play MP4 animation]
A NOAA-20 VIIRS True Color RGB image valid at 1904 UTC (below) indicated that this blowing dust likely affected travel along Interstate 70 across far eastern Colorado and western Kansas — with visibility restrictions to 2.5 miles and wind gusts of 54-55 knots (62-63 mph) at that particular time.
NOAA-20 VIIRS True Color RGB image valid at 1904 UTC, with and without plots of surface observations [click to enlarge]
The Tri-State Area saw peak wind gusts up to 64 mph today with the strong winds. Let us know your wind reports as well as visibility reports due to blowing dust from today here! #COwx#KSwx#NEwxpic.twitter.com/VNzCzmosXC
Both Hurricanes Charley (2004) and Ian (2022) were extremely strong storms to strike the west coast of Florida. Both Charley and Ian were upper Category 4 storms, as a measure of their wind speeds. Of course wind speed is only one of the critical impacts of a hurricane. For more information... Read More
Both Hurricanes Charley (2004) and Ian (2022) were extremely strong storms to strike the west coast of Florida. Both Charley and Ian were upper Category 4 storms, as a measure of their wind speeds. Of course wind speed is only one of the critical impacts of a hurricane. For more information on Hurricane Ian, see other UW CIMSS Satellite Blog posts such as when the hurricane made a landfall in Florida on September 28th and again in South Carolina on the 30th (by Scott Bachmeier, UW/CIMSS), the CIMSS Tropical Cyclones page, or a blog post by Bill Line, NOAA / NEDSIS.
GOES-12 versus GOES-16 (ABI)
The quality of the monitoring of storms between GOES-12 and GOES-16 were orders of magnitude improved. For example, GOES-12 provided imagery with intervals of between 7 and 30 minutes, while the Advanced Baseline Imager (ABI) provided images every 30 seconds via the meso-scale sector. The spatial resolutions of the longwave infrared window improved from approximately 4 to 2 km, while the visible band improved from 1 to 0.5 km. In addition, there were calibration and navigation improvements.
Longwave Infrared band
This longwave infrared window (heat of the emitting surface) loop has the imagery remapped to the same projection. The Ian ABI loop runs from 13:00:28 to 17:59:55 UTC on September 29, 2022, while the GOES-12 Imager Charley loop covers from 15:15 to 19:55 UTC on August 13, 2004. Note the improved temporal and spatial resolutions.
Infrared GOES-16 ABI of Hurricane Ian in 2022 (left) and GOES-12 of Hurricane Charley in 2004 (right).
IR window loop as an animated gif and mp4. There are also version with a 30-sec duration (mp4). Both satellite images have been remapped to the same projection.
Drag the center line left or right to compare the two storms. Note the very different eye sizes. A toggle loop.
GOES IR Comparisons: Ian to Charley.
Visible band
This visible (reflected light) loop has the imagery remapped to the same projection. The Ian ABI loop runs from 13:00:28 to 17:59:55 UTC on September 29, 2022, while the GOES-12 Imager Charley loop covers from 15:15 to 19:55 UTC on August 13, 2004. Note the improved temporal and spatial resolutions.
Visible GOES-16 ABI of Hurricane Ian in 2022 (left) and GOES-12 of Hurricane Charley in 2004 (right).
Visible loop as an animated gif and mp4. There are also version with a 30-sec duration (mp4). Note that the landfall occurred about 3 hours later in the day for Hurricane Charley, compared to Ian. Both satellite images have been remapped to the same projection.
Drag the center line left or right to compare the two storms. Note the very different eye sizes. A toggle loop.
GOES Visible Comparisons: Ian to Charley.
Several Social Media Posts Comparing Ian to Charley
There were several social media posts comparing these two storms, both the satellite and radar perspectives.
Reposted, because it's cooler with the same projection. Ian in 2022, Charley in 2004. pic.twitter.com/3GDE6ugr8S
Here's the radar loops of both Charley '04 & #Ian '22. Both made landfall at the exact same spot just 18 years, 1 month, 16 days apart. They made landfall at the same windspeed intensity but Ian was stronger by 1mb. #FLwx#tropicswx#HurricaneIanpic.twitter.com/kETiInartp
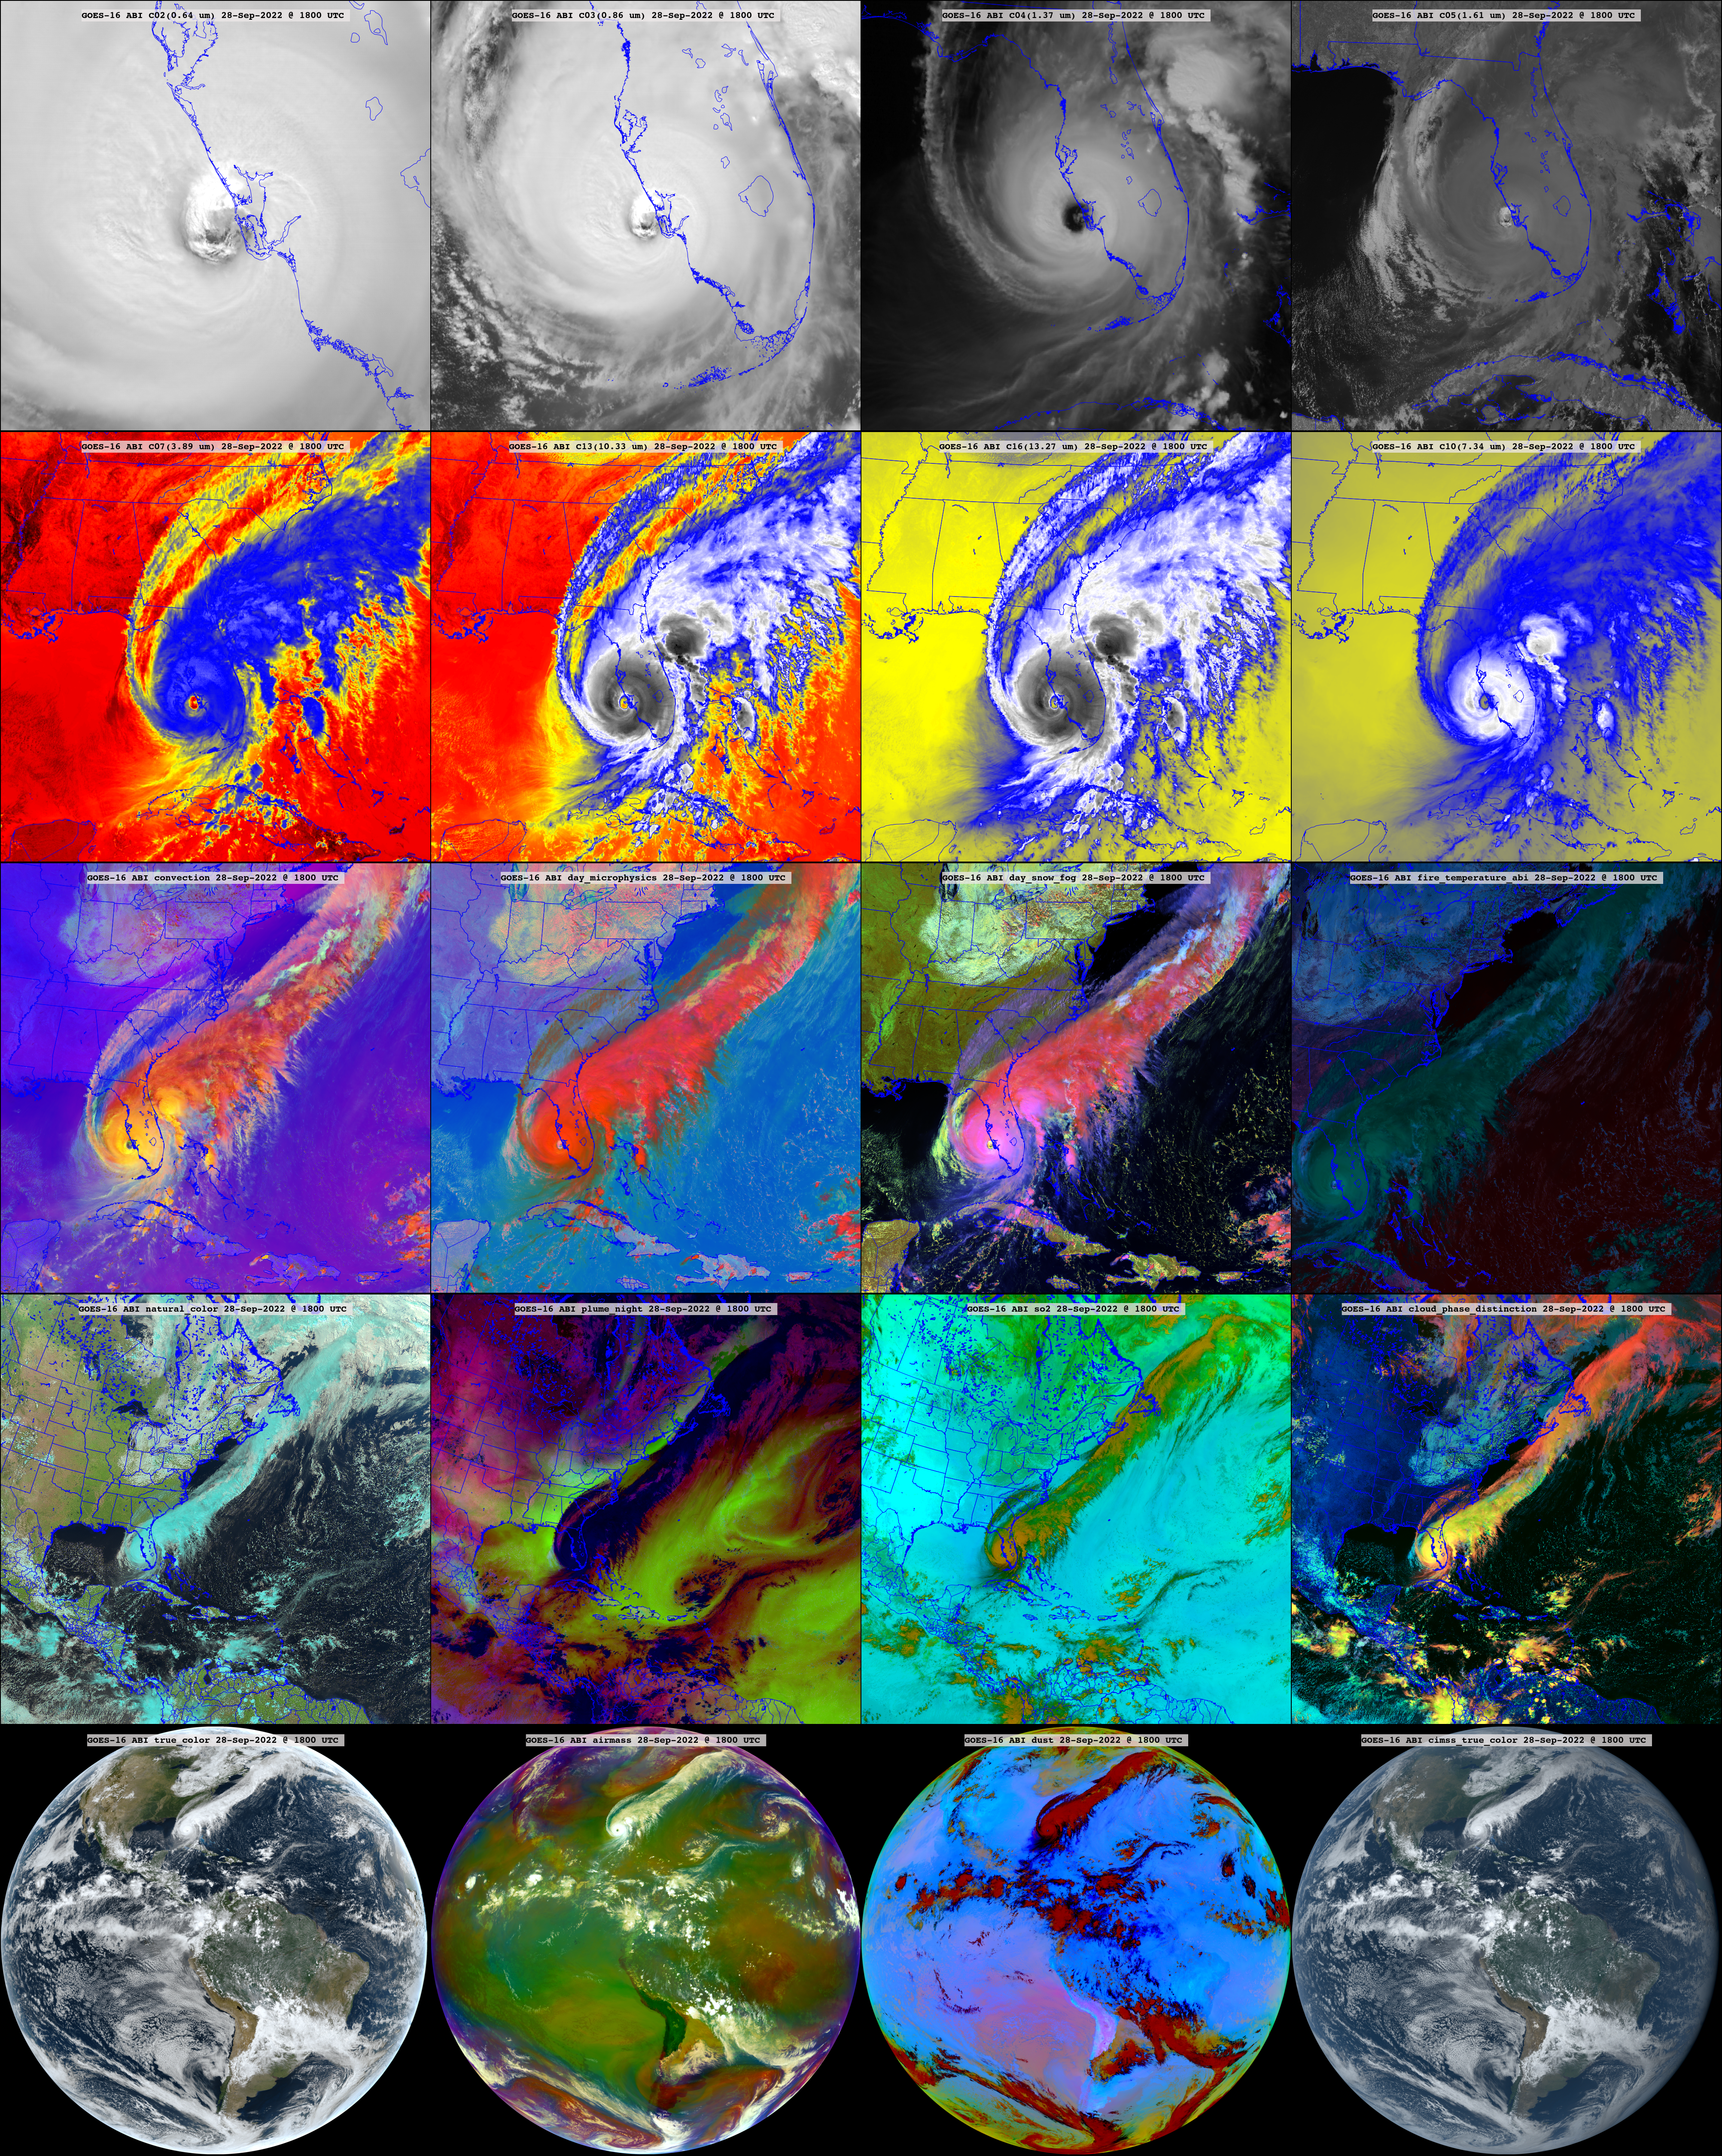
Several views of Hurricane Ian just before making landfall. This includes visible / near-infrared bands (first row), infrared bands (second row) and RGB composites (last 3 rows). These images were made with UW/SSEC geo2grid python software with a number of other UNIX scripts. A larger version.
GOES-18 (GOES-West) Upper-level Water Vapor (6.2 µm) images (above) displayed a quasi-stationary train of gravity waves north and northwest of Hawai`i on 20 October 2022. There were no pilot reports of turbulence in the vicinity of these waves — likely due to the lack of rapid wave propagation, and the non-interfering... Read More
GOES-18 Upper-level Water Vapor (6.2 µm) images [click to play animated GIF | MP4]
GOES-18 (GOES-West) Upper-level Water Vapor (6.2 µm) images (above) displayed a quasi-stationary train of gravity waves north and northwest of Hawai`i on 20 October 2022. There were no pilot reports of turbulence in the vicinity of these waves — likely due to the lack of rapid wave propagation, and the non-interfering nature of their orientation.
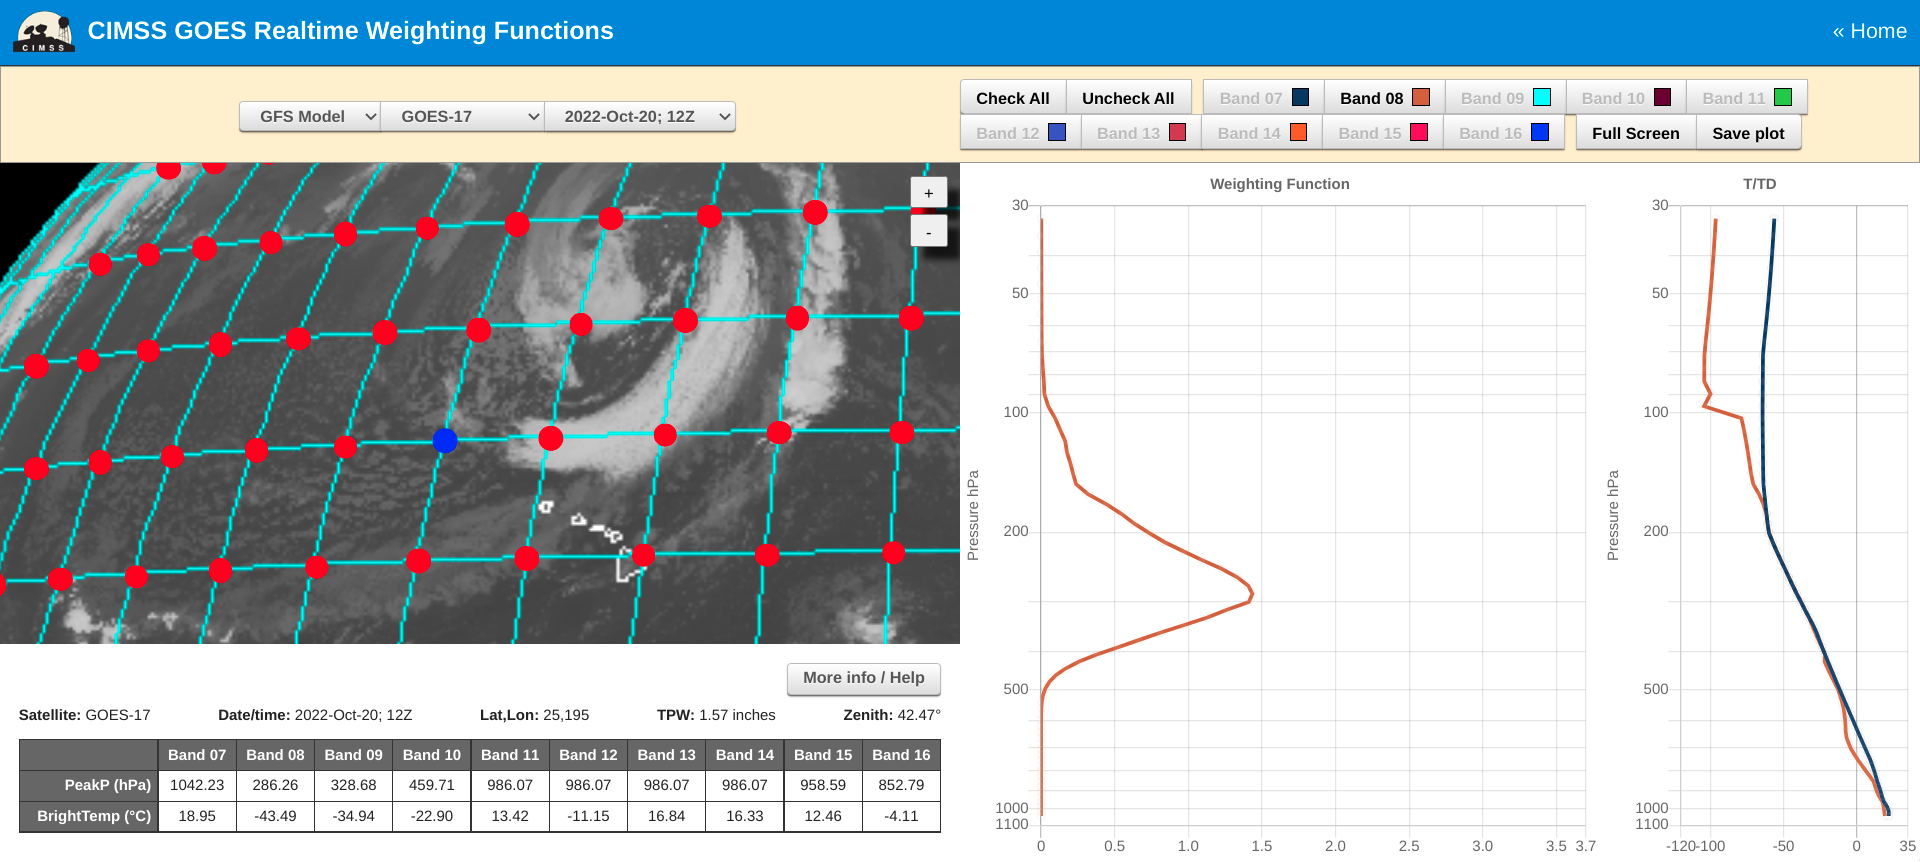
These waves developed in a region of diffluent upper-tropospheric flow, in the exit region of a jet streak along the western edge of an anomalously-deep retrograding upper-level trough north of the islands — as shown in a 2-hour sequence of GOES-18 Water Vapor images with plots of GFS model 300 hPa winds valid at 12 UTC (below).
GOES-18 Upper-level Water Vapor (6.2 µm) images, with 12 UTC GFS model 300 hPa wind barbs plotted in yellow [click to play animated GIF | MP4]
The 300 hPa winds were at a pressure level closely corresponding to that of the peak GOES-West ABI Band 08 (6.2 µm) weighting function at that location — derived using GFS model fields (below).
GOES-West ABI Band 08 weighting function plot, derived from GFS model fields [click to enlarge]
Thanks to Matt Sitkowski (The Weather Channel) for bringing these gravity wave features to our attention!
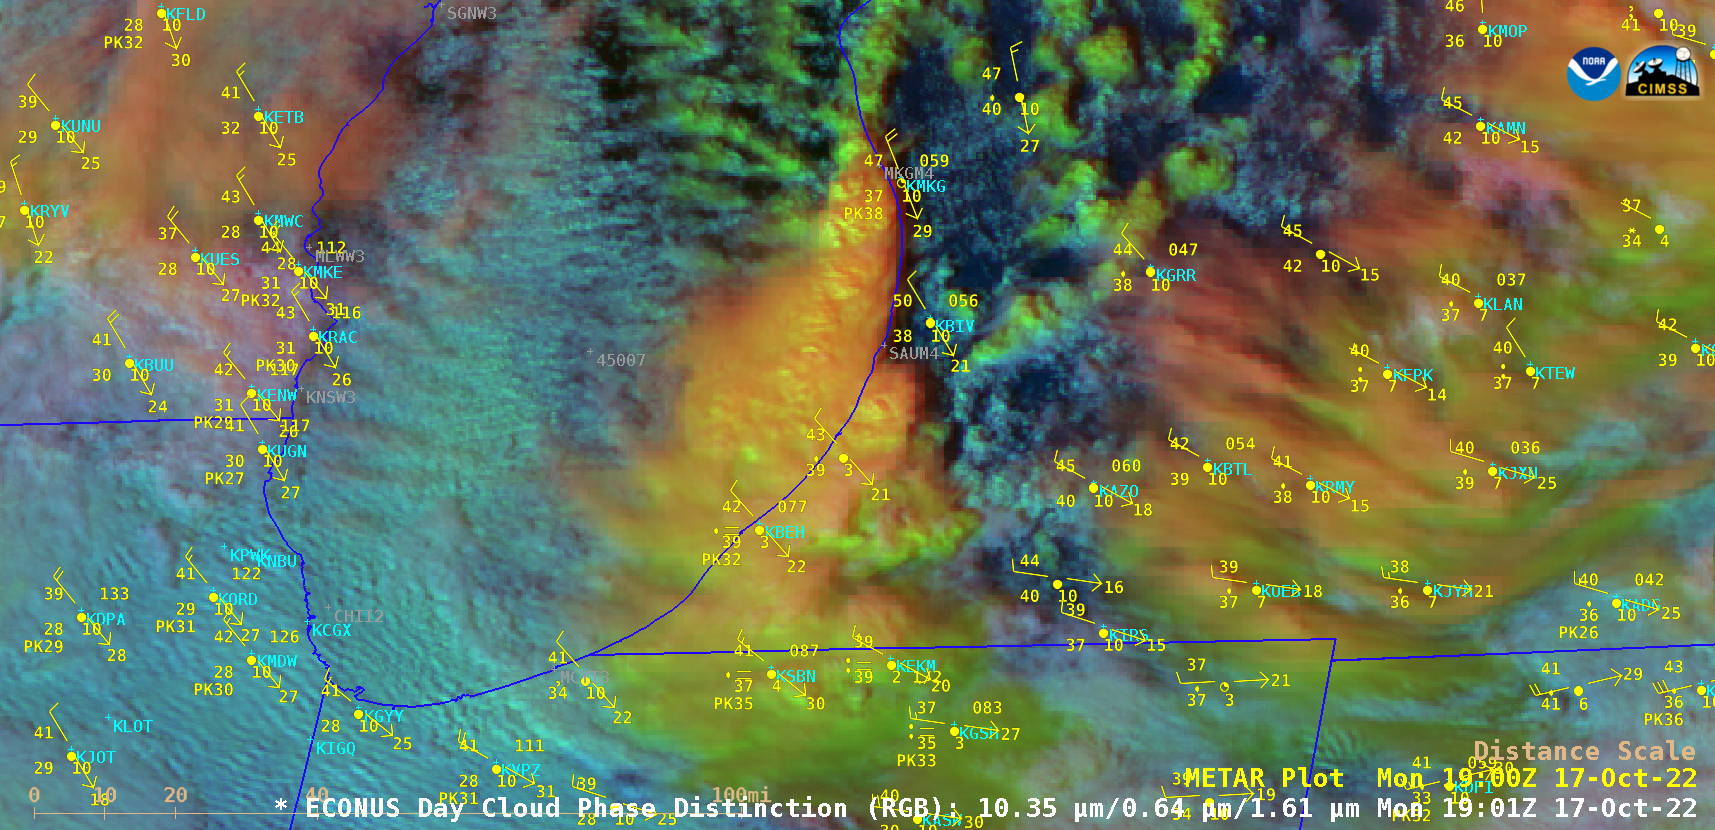
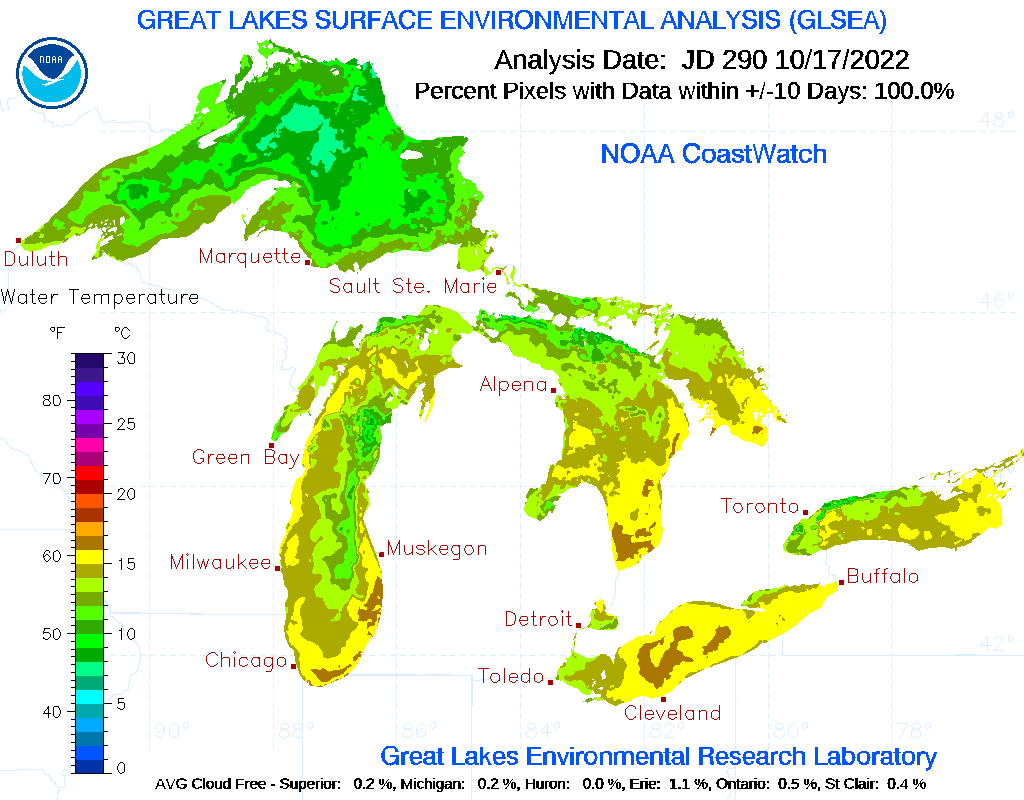
GOES-16 (GOES-East) Day Cloud Phase Distinction RGB images (above) showed convection which developed just off the Lower Michigan coast in southeastern Lake Michigan — where warmer water temperatures existed — on 17 October 2022. As this convection moved inland across southwestern Lower Michigan and northern Indiana it produced a swath of rainfall and snowfall.The GOES-16 Day Cloud Phase Distinction... Read More
GOES-16 Day Cloud Phase Distinction RGB images [click to play animation | MP4]
GOES-16 (GOES-East)Day Cloud Phase Distinction RGB images (above) showed convection which developed just off the Lower Michigan coast in southeastern Lake Michigan — where warmer water temperatures existed — on 17 October 2022. As this convection moved inland across southwestern Lower Michigan and northern Indiana it produced a swath of rainfall and snowfall.
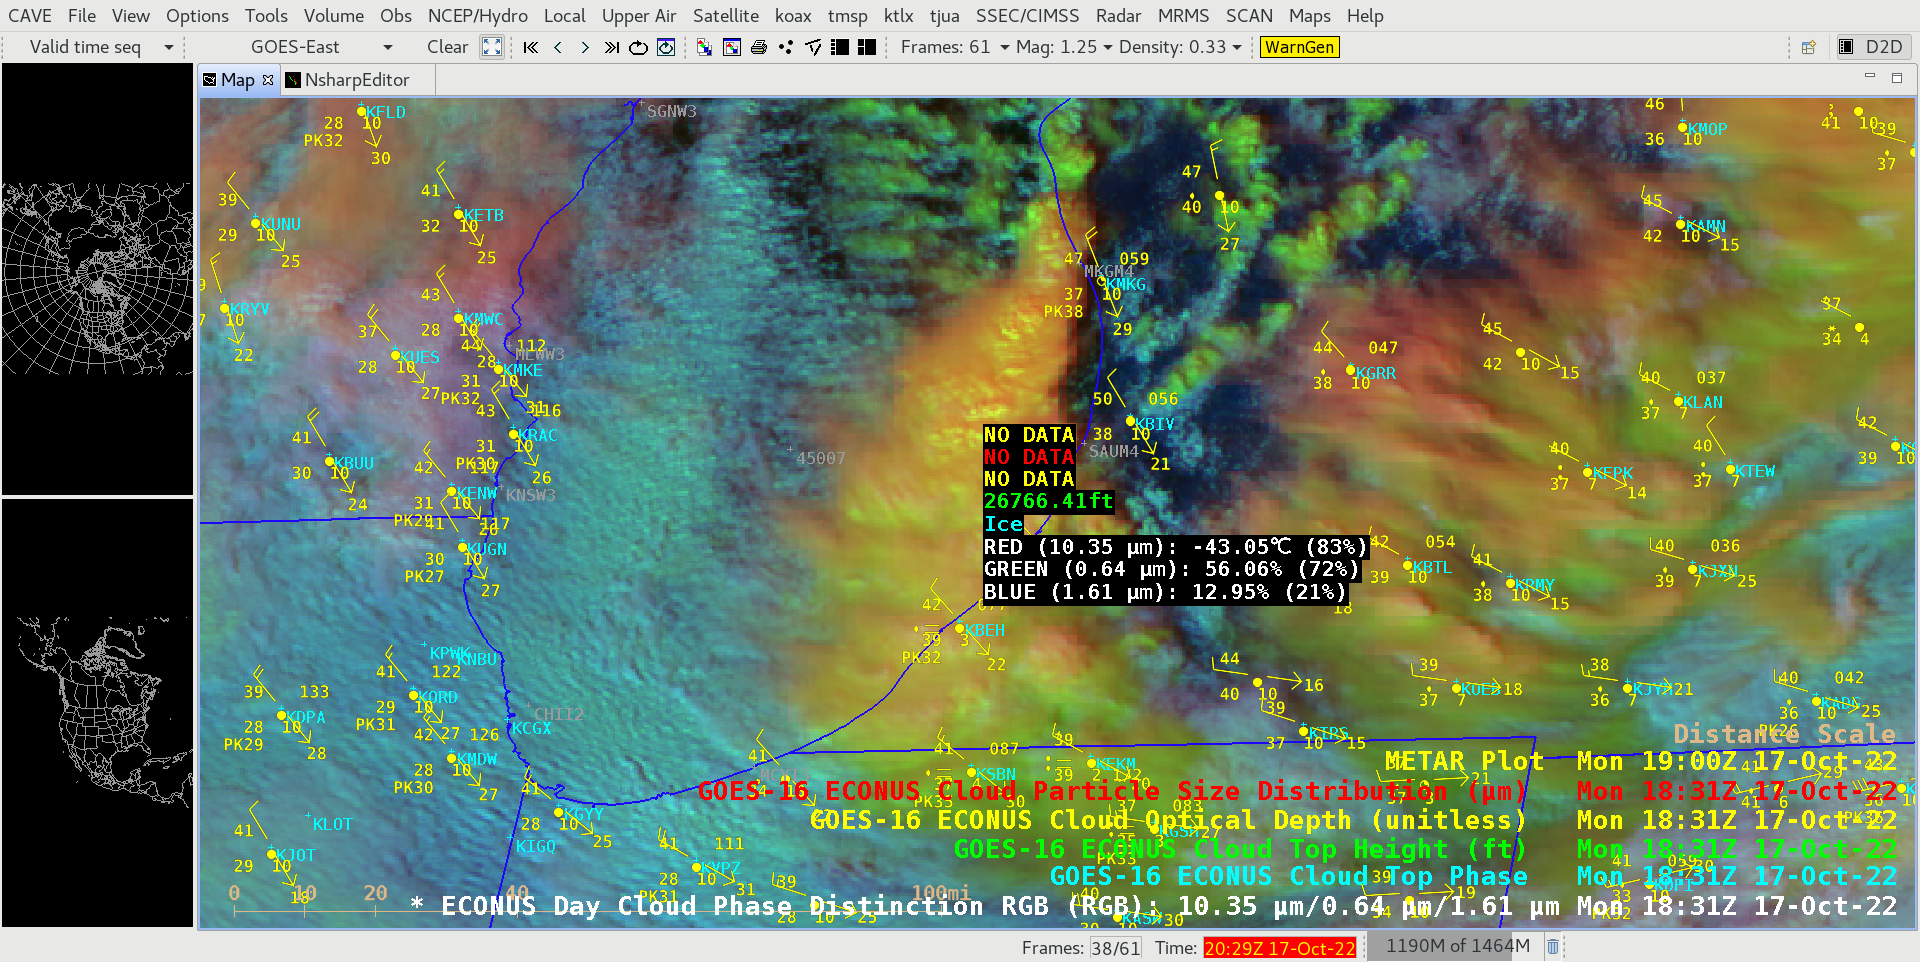
The GOES-16 Day Cloud Phase Distinction RGB image at 1831 UTC (below) includes cursor readouts of associated Cloud Top Phase and Cloud Top Height derived products at a point near the center of the offshore convection. Qualitative interpretation of RGB color hues can be somewhat difficult or misleading at times — this method of Level 2 derived product display ensures a more accurate analysis of RGB image features. For example, the cloud top at the cursor location shown below exhibited a 10.3 µm infrared brightness temperature of -43.05ºC at a height of 26,766 feet, ensuring Ice as the cloud top phase.
GOES-16 Day Cloud Phase Distinction RGB image at 1831 UTC, with cursor readouts of associated Cloud Top Phase and Cloud Top Height derived products [click to enlarge]


