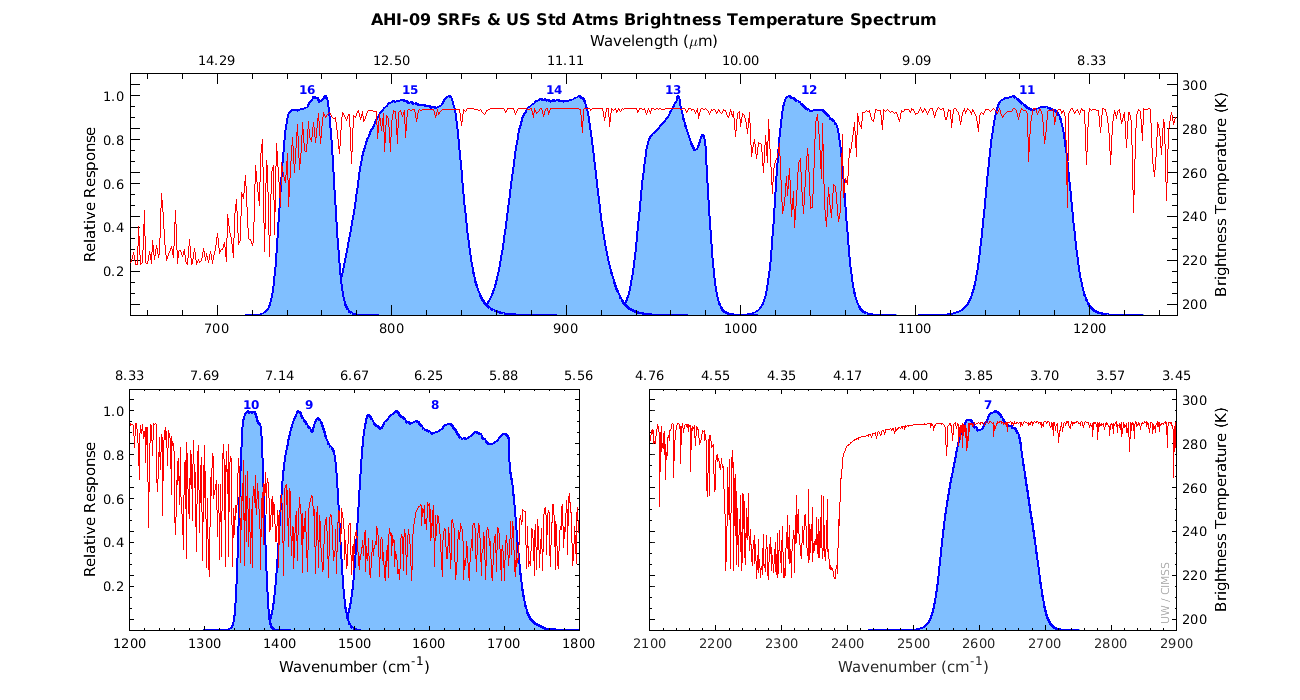
Himawari-9 is slated to become operational (replacing Himawari-8, which has been operational at 140.7o E Longitude since 2015!) on 13 December 2022 (Link). One change that users might observe arises from the slightly shorter central wavelength in the shortwave infrared band (Band 7). On Himawari-8, the central wavelength is 3.885 µm; on Himawari-9, the central wavelength is closer to 3.829 µm (see this link from JMA, or this one). The effect of the shorter wavelength on Himawari-9 is more noticeable during the daytime, when solar reflectance will lead to warmer observed brightness temperatures, especially over highly reflective convective updrafts (This presentation — see slide 19 — given at the CIRA RGB Workshop in October 2022, suggests daytime differences of up to 5 C.), and especially when compared to longwave infrared imagery as a brightness temperature difference.
The toggle above compares Himawari-8 visible imagery and Day Convection RGB imagery from Himawari-8 and -9 at 0200 UTC on 26 October 2022. in a region near Guam, without much intense convection. Subtle differences in the yellow shading over some convection are apparent (here’s a toggle just between Himawari-8 and -9 Day Convection RGB over Guam). It’s very hard to discern a difference in regions of no convection.
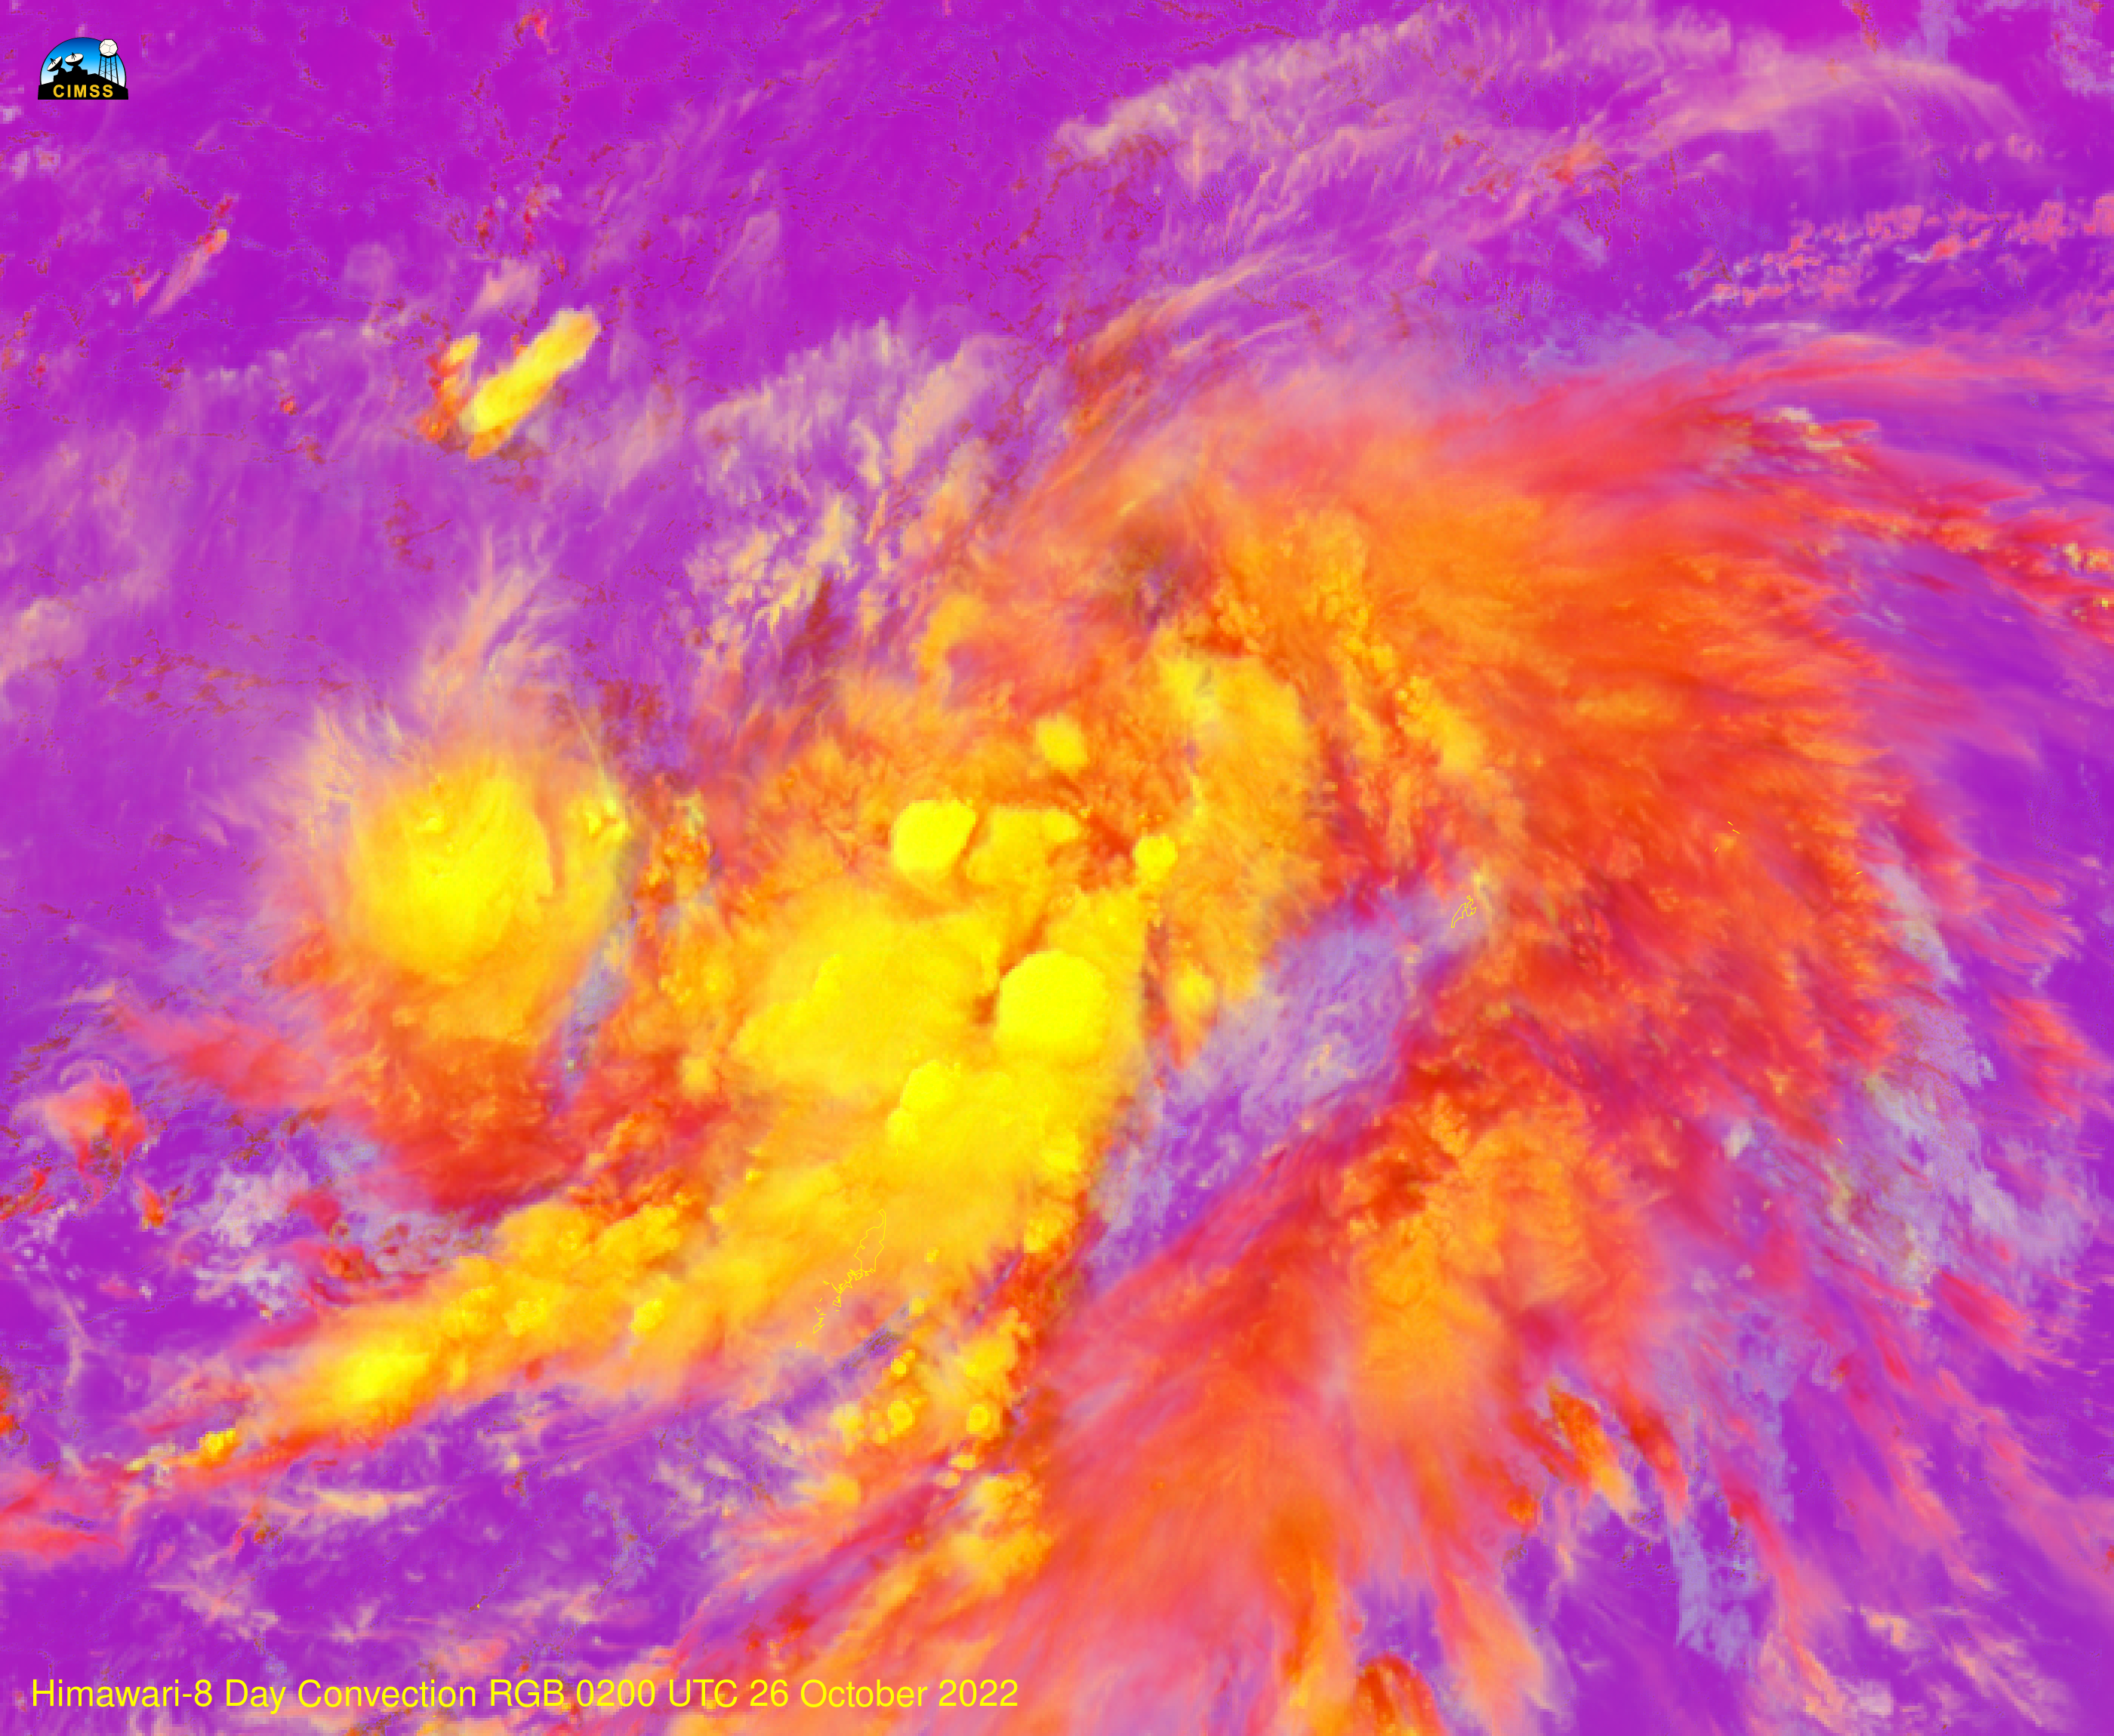
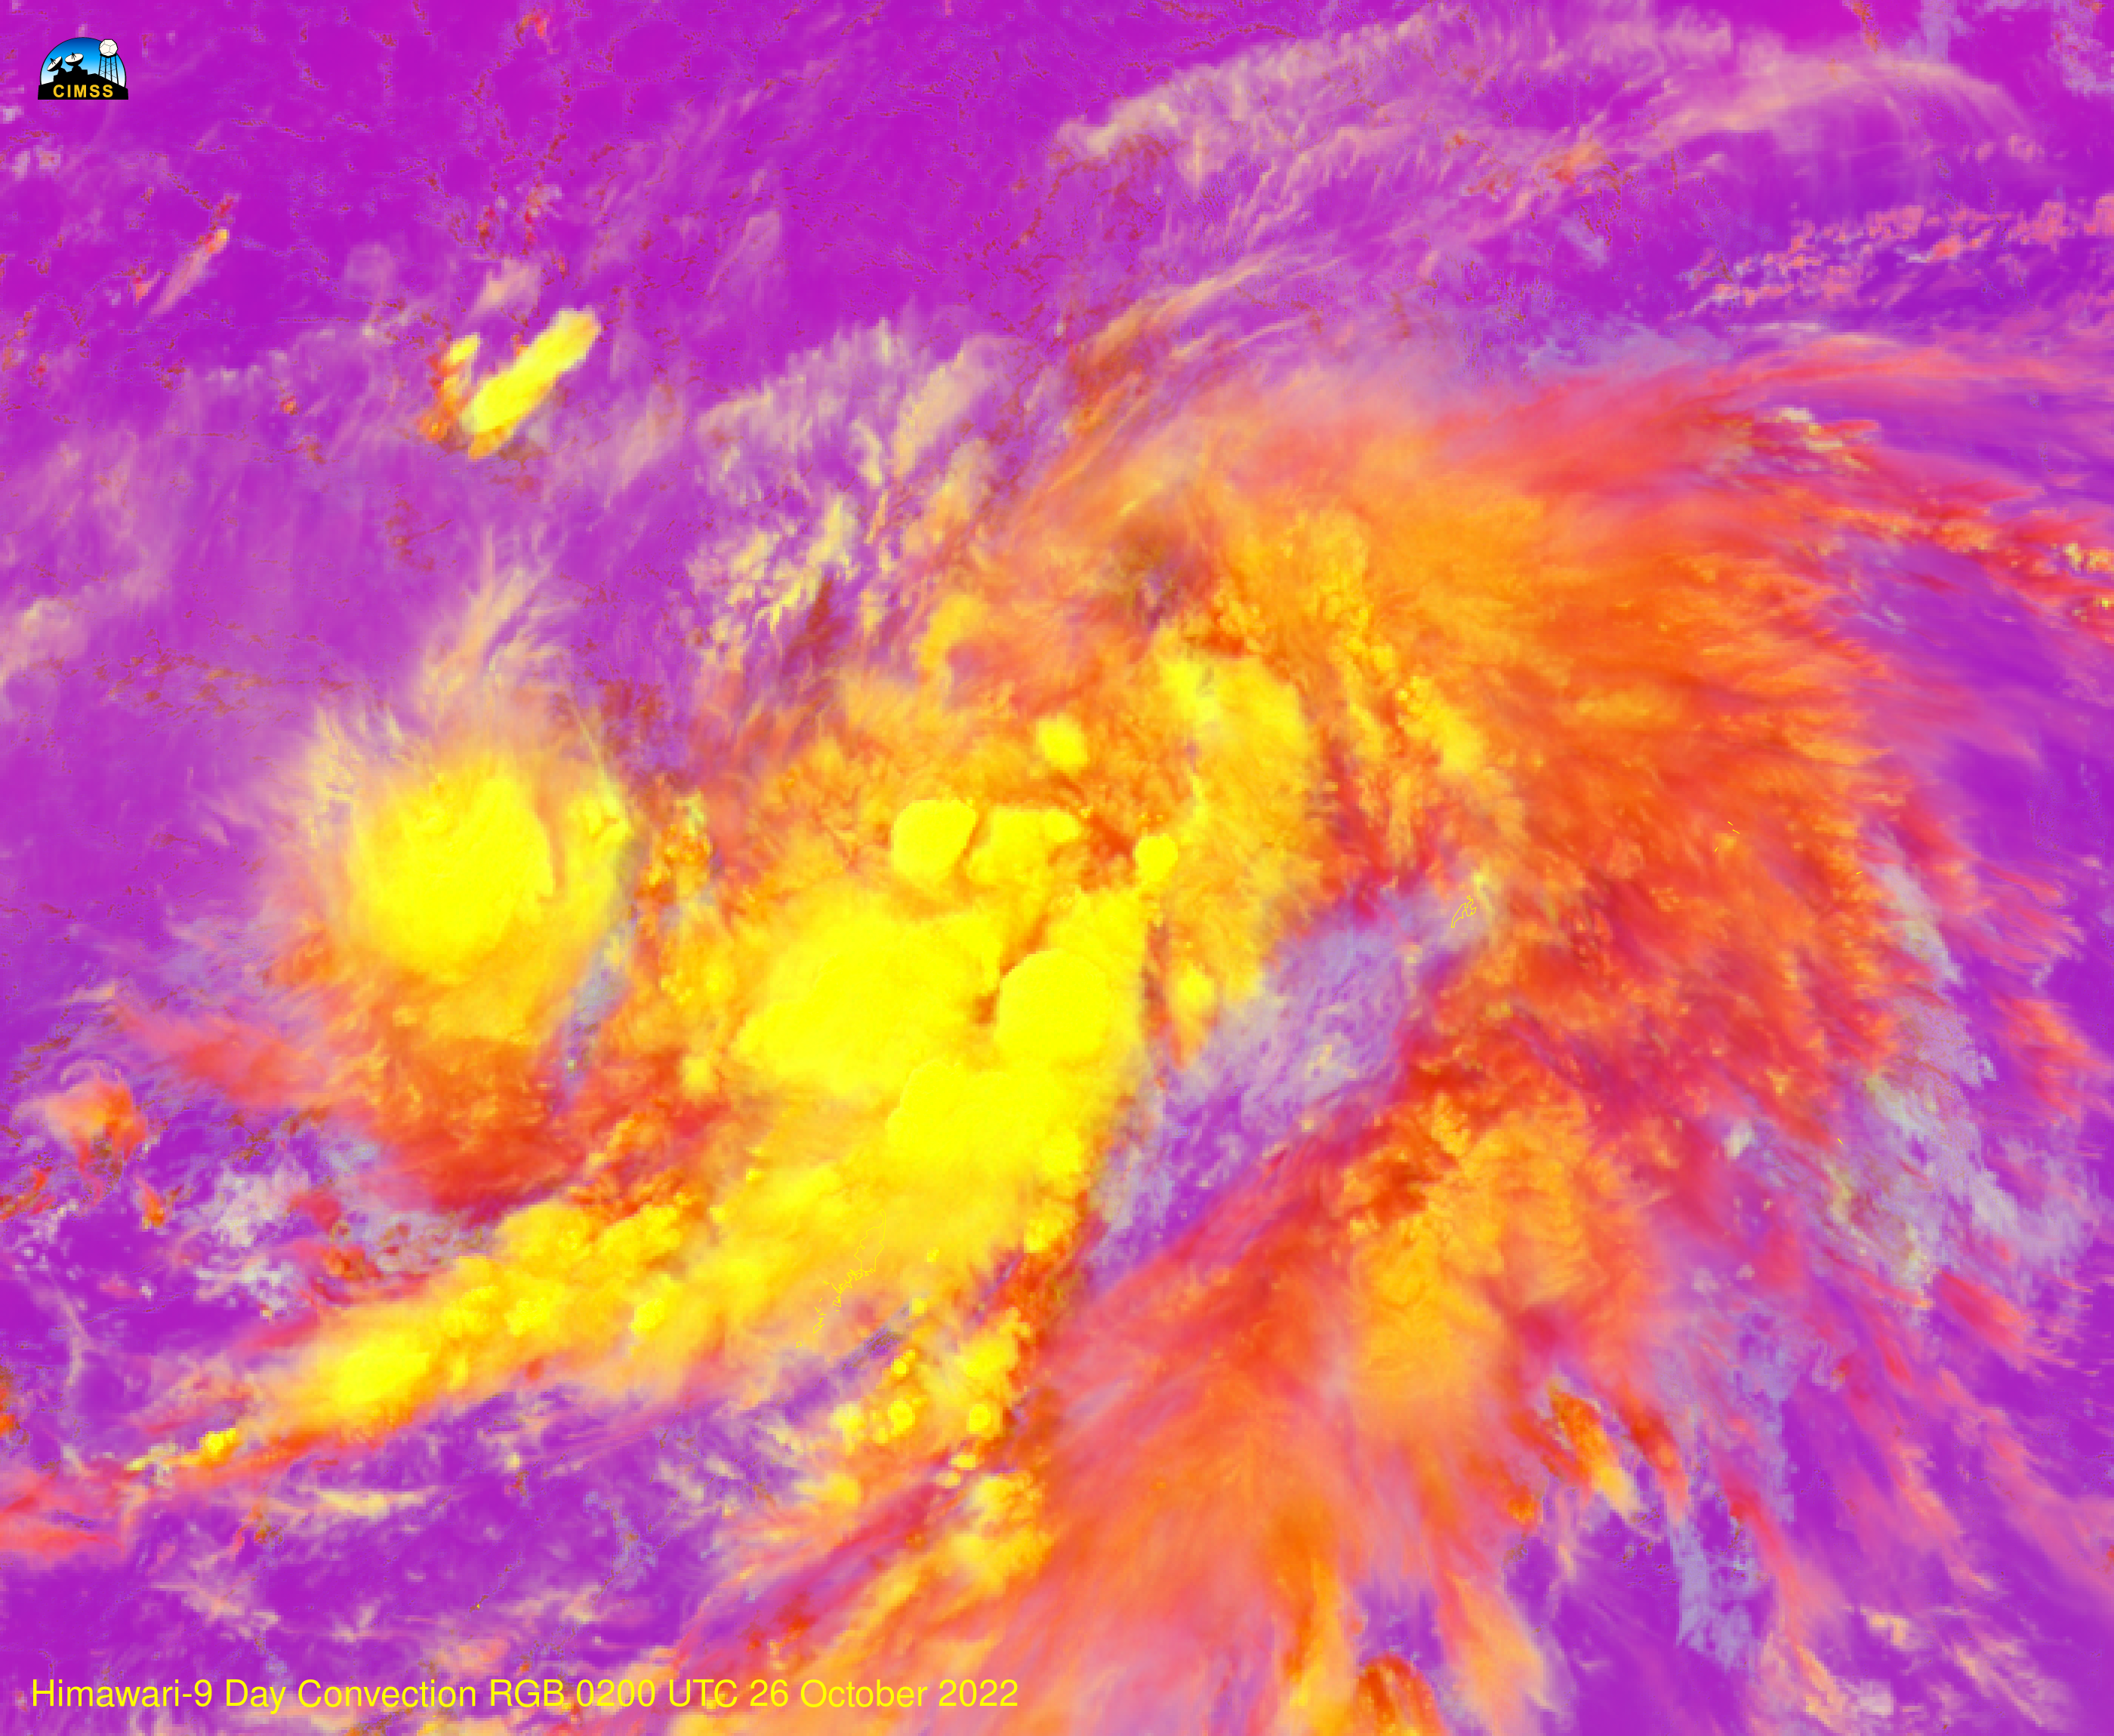
For strong convection, however, as shown below for a case over the south-central Equatorial Pacific, differences in yellow coloring over very strong convection are noteable; users might need to adjust the range of the RGB to draw out details in cloud tops, where, for Himawari-9 imagery, contrast is lost. (Here’s a toggle, over the strong convection, between Day Convection RGBs from Himawari-8 and Himawari-9).
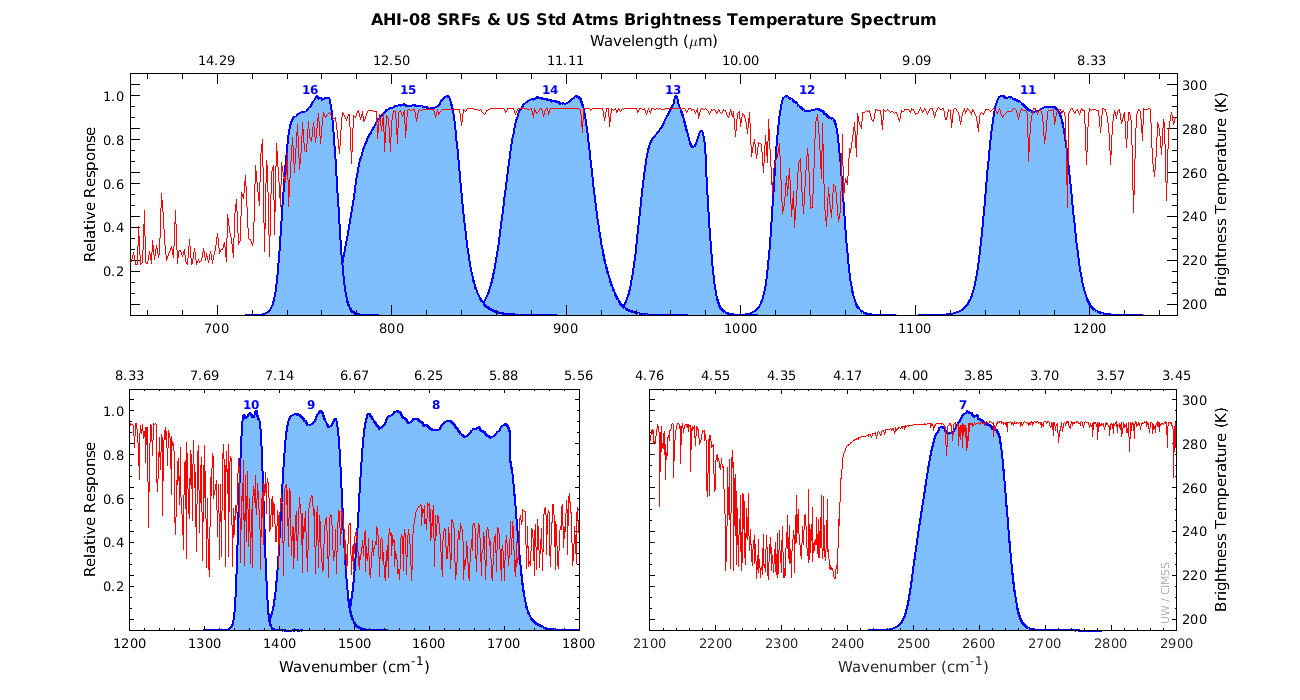
Spectral Response Functions for the infrared channels are available from Himawari-8 (here) and Himawari-9 (here). You will note that most infrared channels have similar functions; the outlier is band 7, shown below (and in this animated gif).
Thanks to JMA for providing simultaneous image files for the different bands on Himawari-8 and Himawari-9!
View only this post Read Less


