
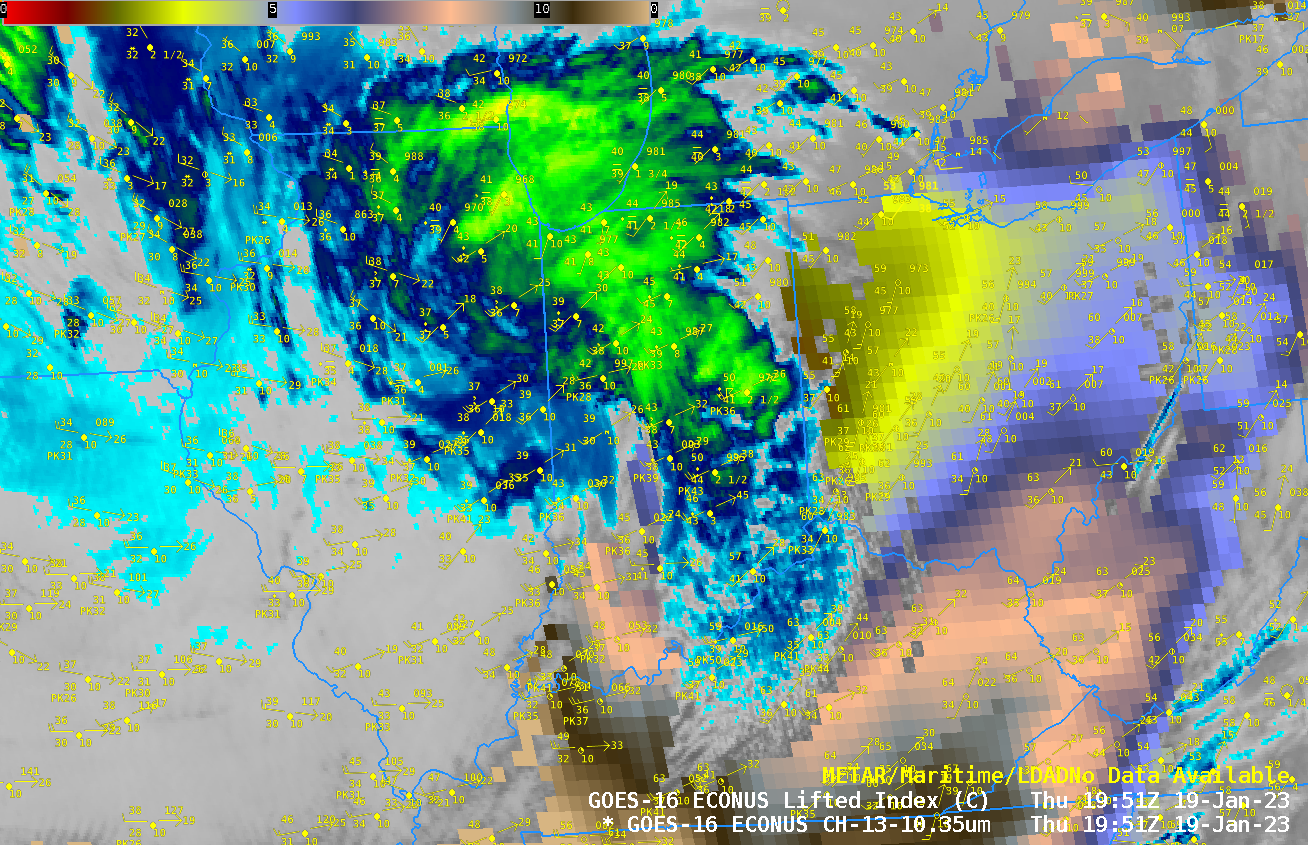
Overlapping 1-minute Mesoscale Domain Sectors provided GOES-16 (GOES-East) imagery at 30-second intervals over the Mid-Atlantic states on 20 January 2023 — and Mid-level Water Vapor (6.9 µm) images (above) revealed widespread mountain waves east of the Appalachians (produced by strong westerly flow interacting with the terrain). There were numerous pilot reports of light to moderate... Read More
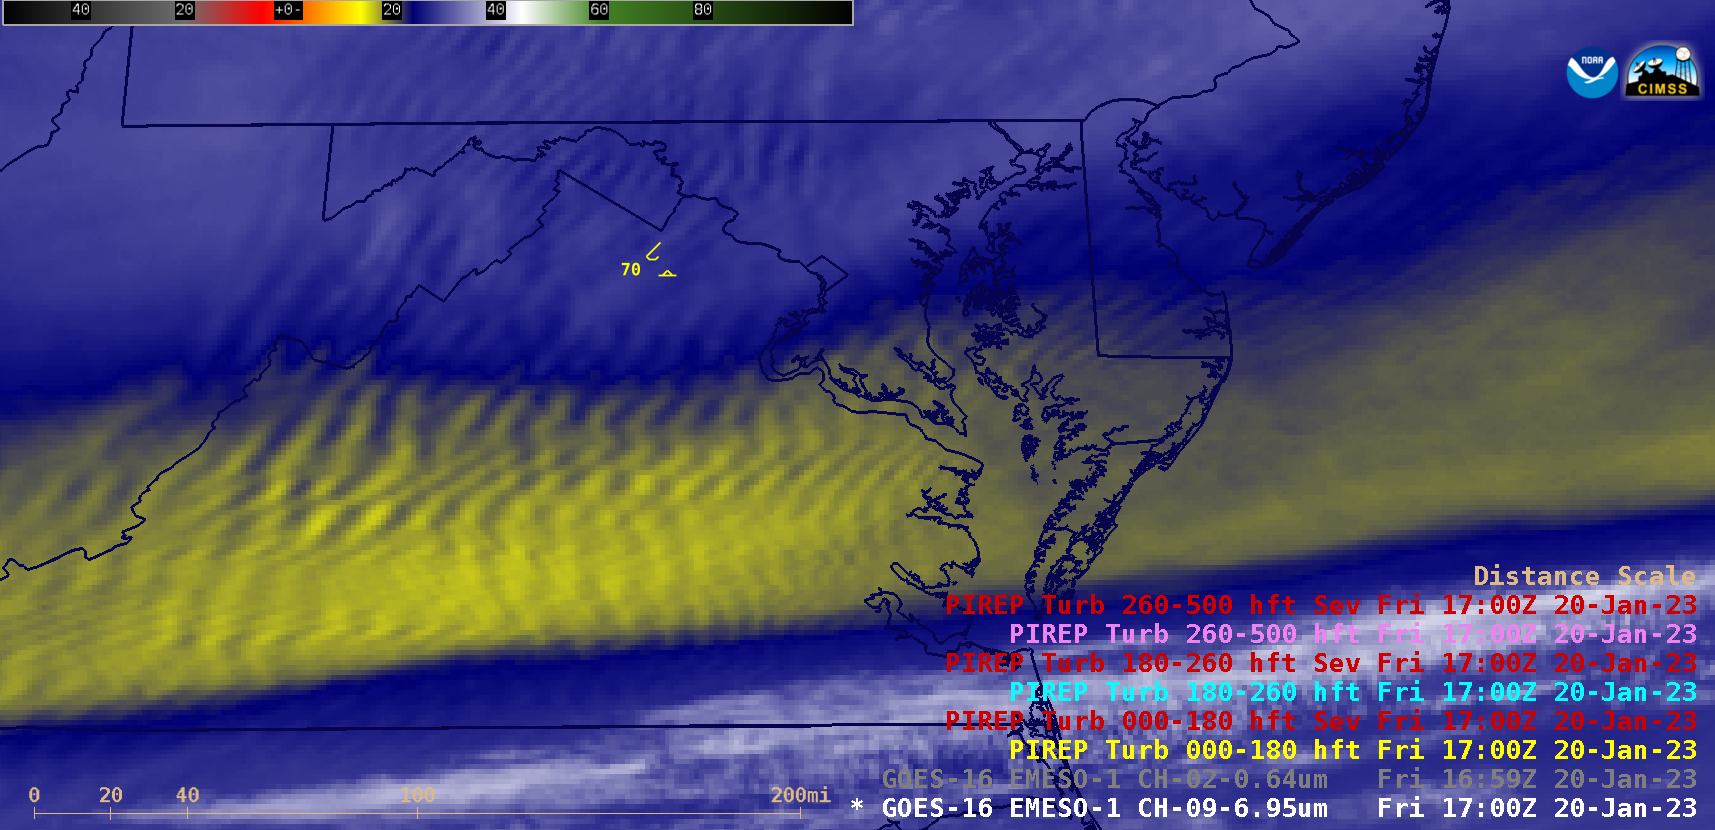
GOES-16 Mid-level Water Vapor (6.9 µm) images, with pilot report (PIREP) plots of turbulence [click to play MP4 | animated GIF]
Overlapping 1-minute Mesoscale Domain Sectors provided GOES-16
(GOES-East) imagery at 30-second intervals over the Mid-Atlantic states on
20 January 2023 — and Mid-level Water Vapor (
6.9 µm) images
(above) revealed widespread mountain waves east of the Appalachians (produced by
strong westerly flow interacting with the
terrain). There were numerous pilot reports of light to moderate turbulence associated with these mountain waves.
The 1200 UTC Water Vapor image with plots of rawinsonde sites (below) indicated that Sterling, Virginia KLWX (which replaced the Washington-Dulles site KIAD) was located within the region of drier air where mountain waves were prevalent at that time.
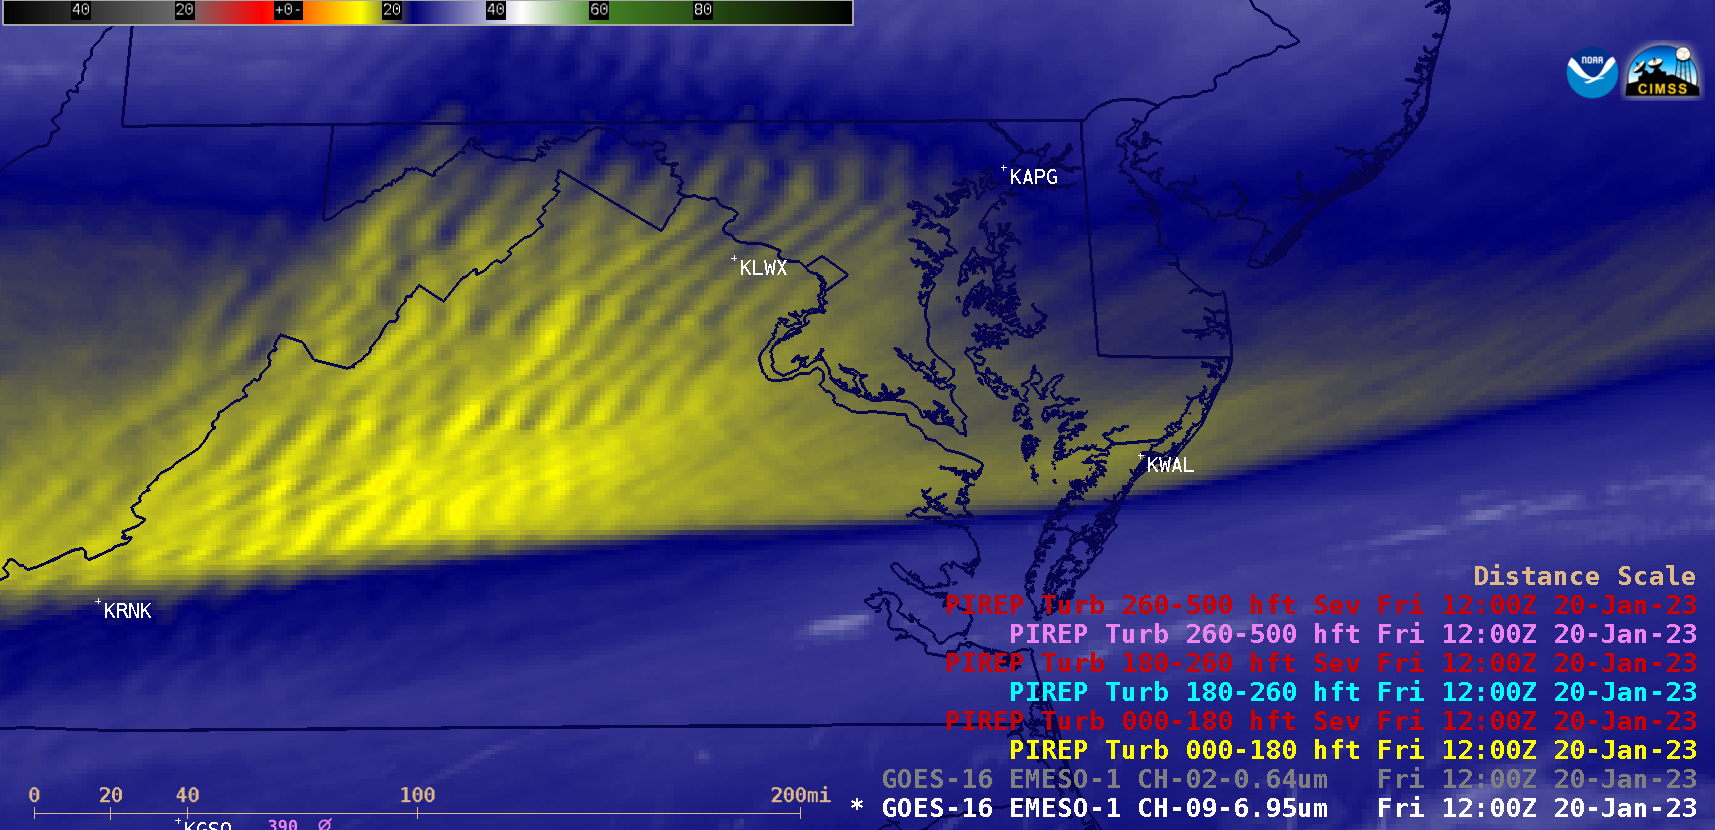
GOES-16 Mid-level Water Vapor (6.9 µm) image at 1200 UTC, showing the locations of rawinsonde sites [click to enlarge]
Plots of GOES-16 Water Vapor spectral band (08, 09 and 10)
weighting functions calculated using 1200 UTC rawinsonde data from Washington-Dulles, Virginia (KIAD) are shown below — due to the presence of dry air throughout the middle and upper troposphere over that location (
Skew-T plot), the water vapor weighting functions were shifted to lower altitudes; the peak of the 6.9 µm (Band 09) weighting function was at the 617.5 hPa pressure level, with significant upwelling radiation contributions originating from as low as the 700 hPa level.
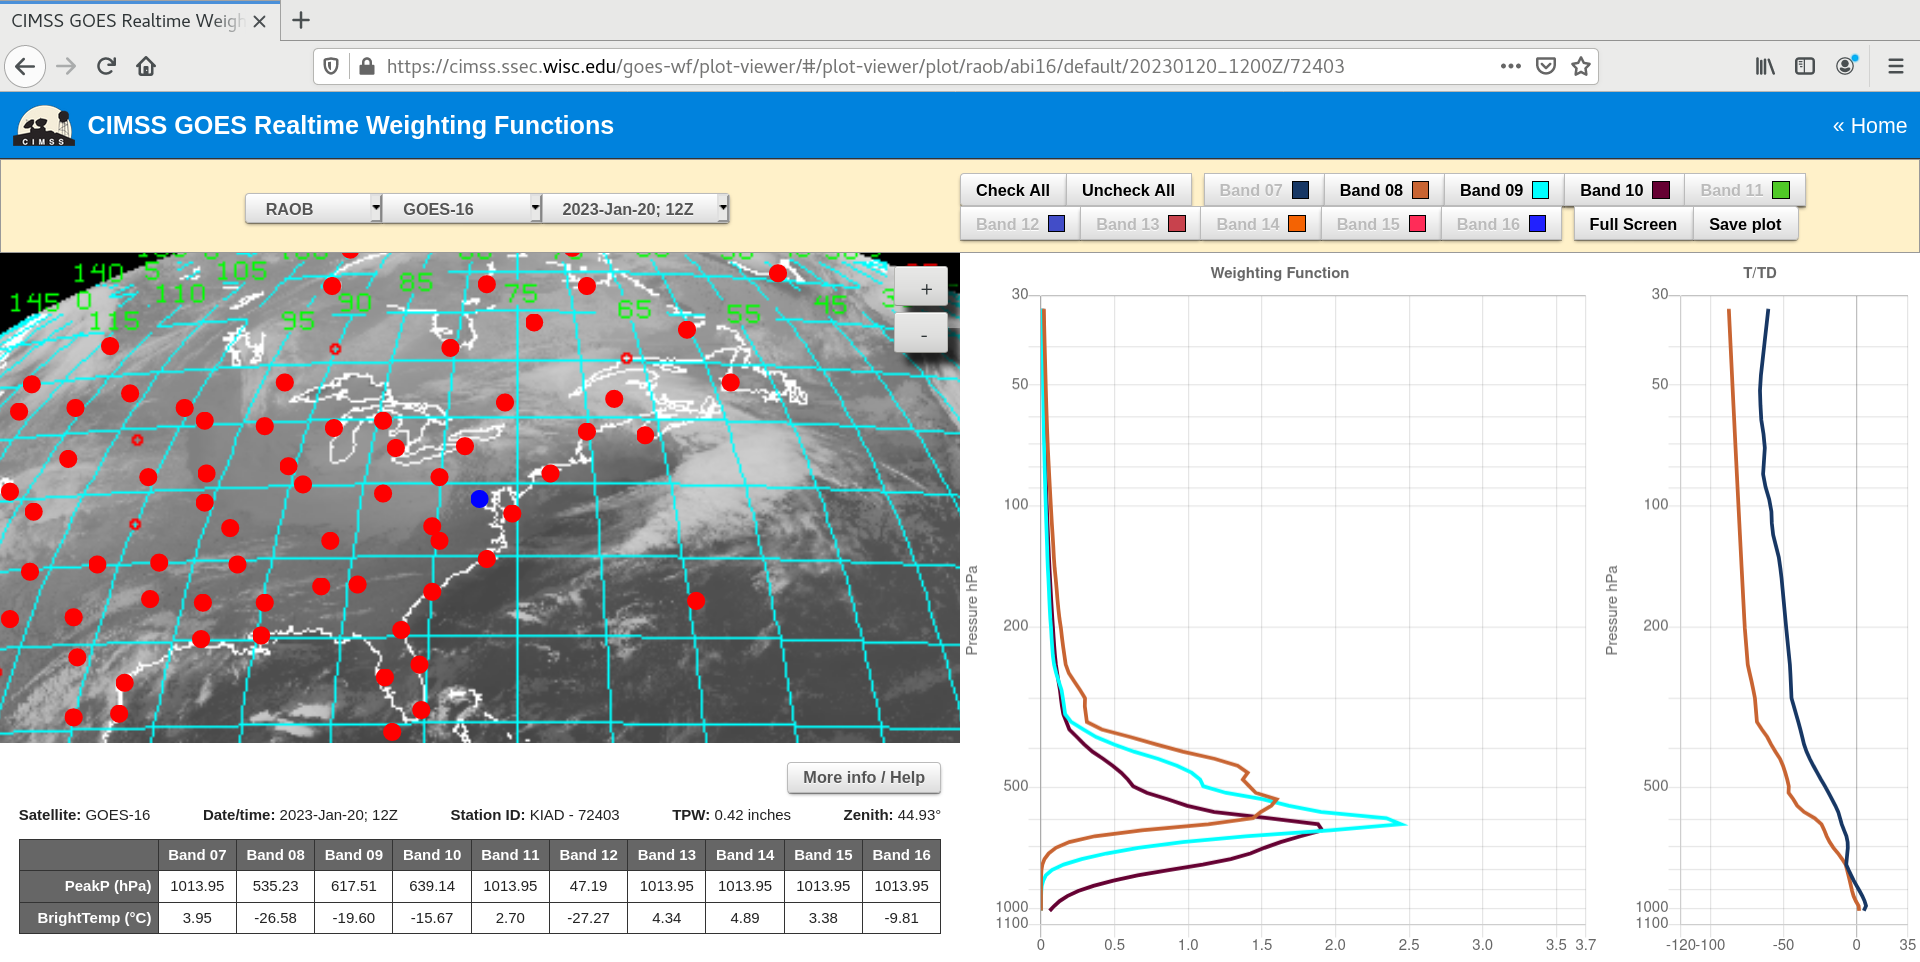
Plots of GOES-16 Water Vapor spectral band (08, 09 and 10) weighting functions, calculated using 1200 UTC rawinsonde data from Sterling, Virginia (KIAD) [click to enlarge]
30-second GOES-16 “Red” Visible (
0.64 µm) images are shown below.
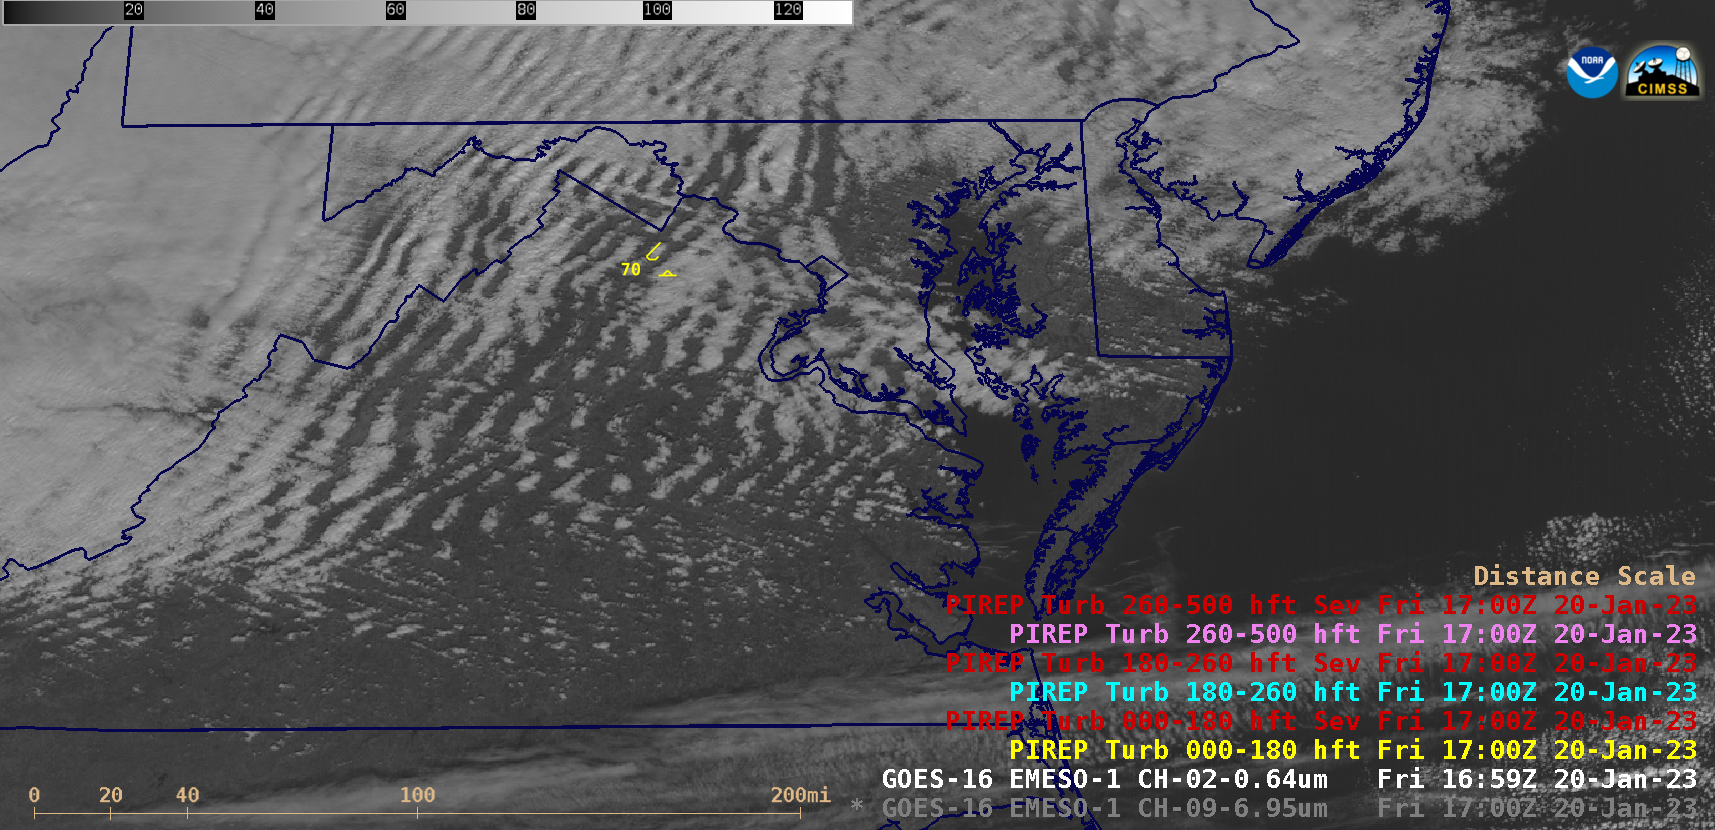
GOES-16 “Red” Visible (0.64 µm) images, with pilot report (PIREP) plots of turbulence [click to play MP4 | animated GIF]
View only this post
Read Less


