Hurricane Force low off the US East Coast
![GOES-16 "Red" Visible (0.64 µm) images [click to play animation | MP4]](https://cimss.ssec.wisc.edu/satellite-blog/wp-content/uploads/sites/5/2019/04/190402_goes16_visible_North_Carolina_coastal_low_anim.gif)
GOES-16 “Red” Visible (0.64 µm) images [click to play animation | MP4]
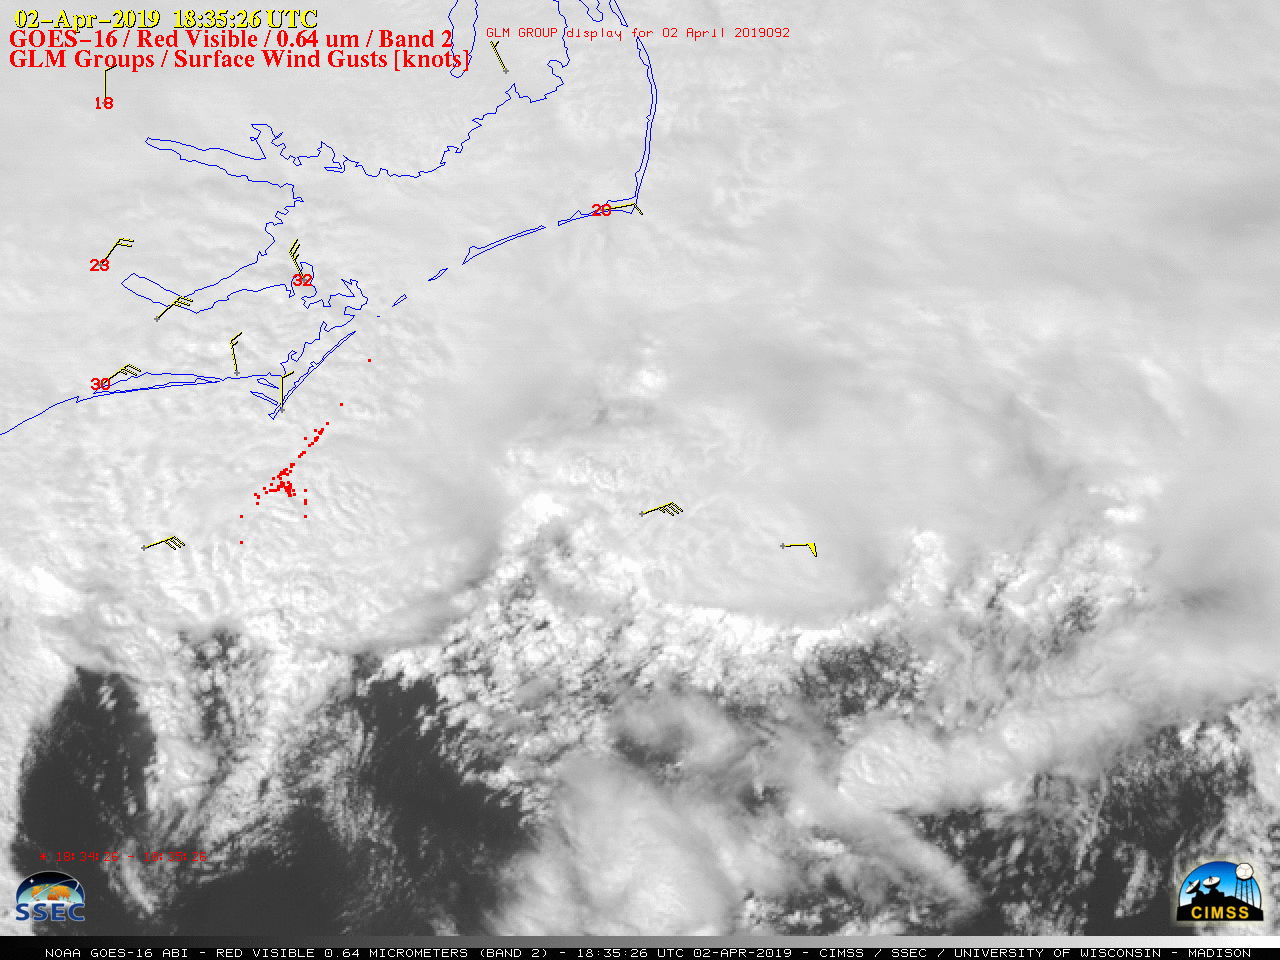
The primary convective cluster began to exhibit a large amount of lightning after 1830 UTC, as seen in plots of GOES-16 GLM Groups (below). To the east of this intensifying convection, one ship report at 18 UTC included winds from the east at 50 knots — in addition, a moderate to heavy shower of hail was being reported and their surface visibility was restricted to 1.25 miles (18 UTC surface analysis).
![GOES-16 "Red" Visible (0.64 µm) images, with GLM Groups and surface wind gusts plotted in red [click to play animation | MP4]](https://cimss.ssec.wisc.edu/satellite-blog/wp-content/uploads/sites/5/2019/04/190402_goes16_visible_glmGroups_Bomb_Cyclone_anim.gif)
GOES-16 “Red” Visible (0.64 µm) images, with GLM Groups and surface wind gusts plotted in red [click to play animation | MP4
![GOES-16 Low-level (7.3 µm), Mid-level (6.9 µm) and Upper-level (6.2 µm) Water Vapor images [click to play animation | MP4]](https://cimss.ssec.wisc.edu/satellite-blog/wp-content/uploads/sites/5/2019/04/190402_goes16_waterVapor_Bomb_Cyclone_anim.gif)
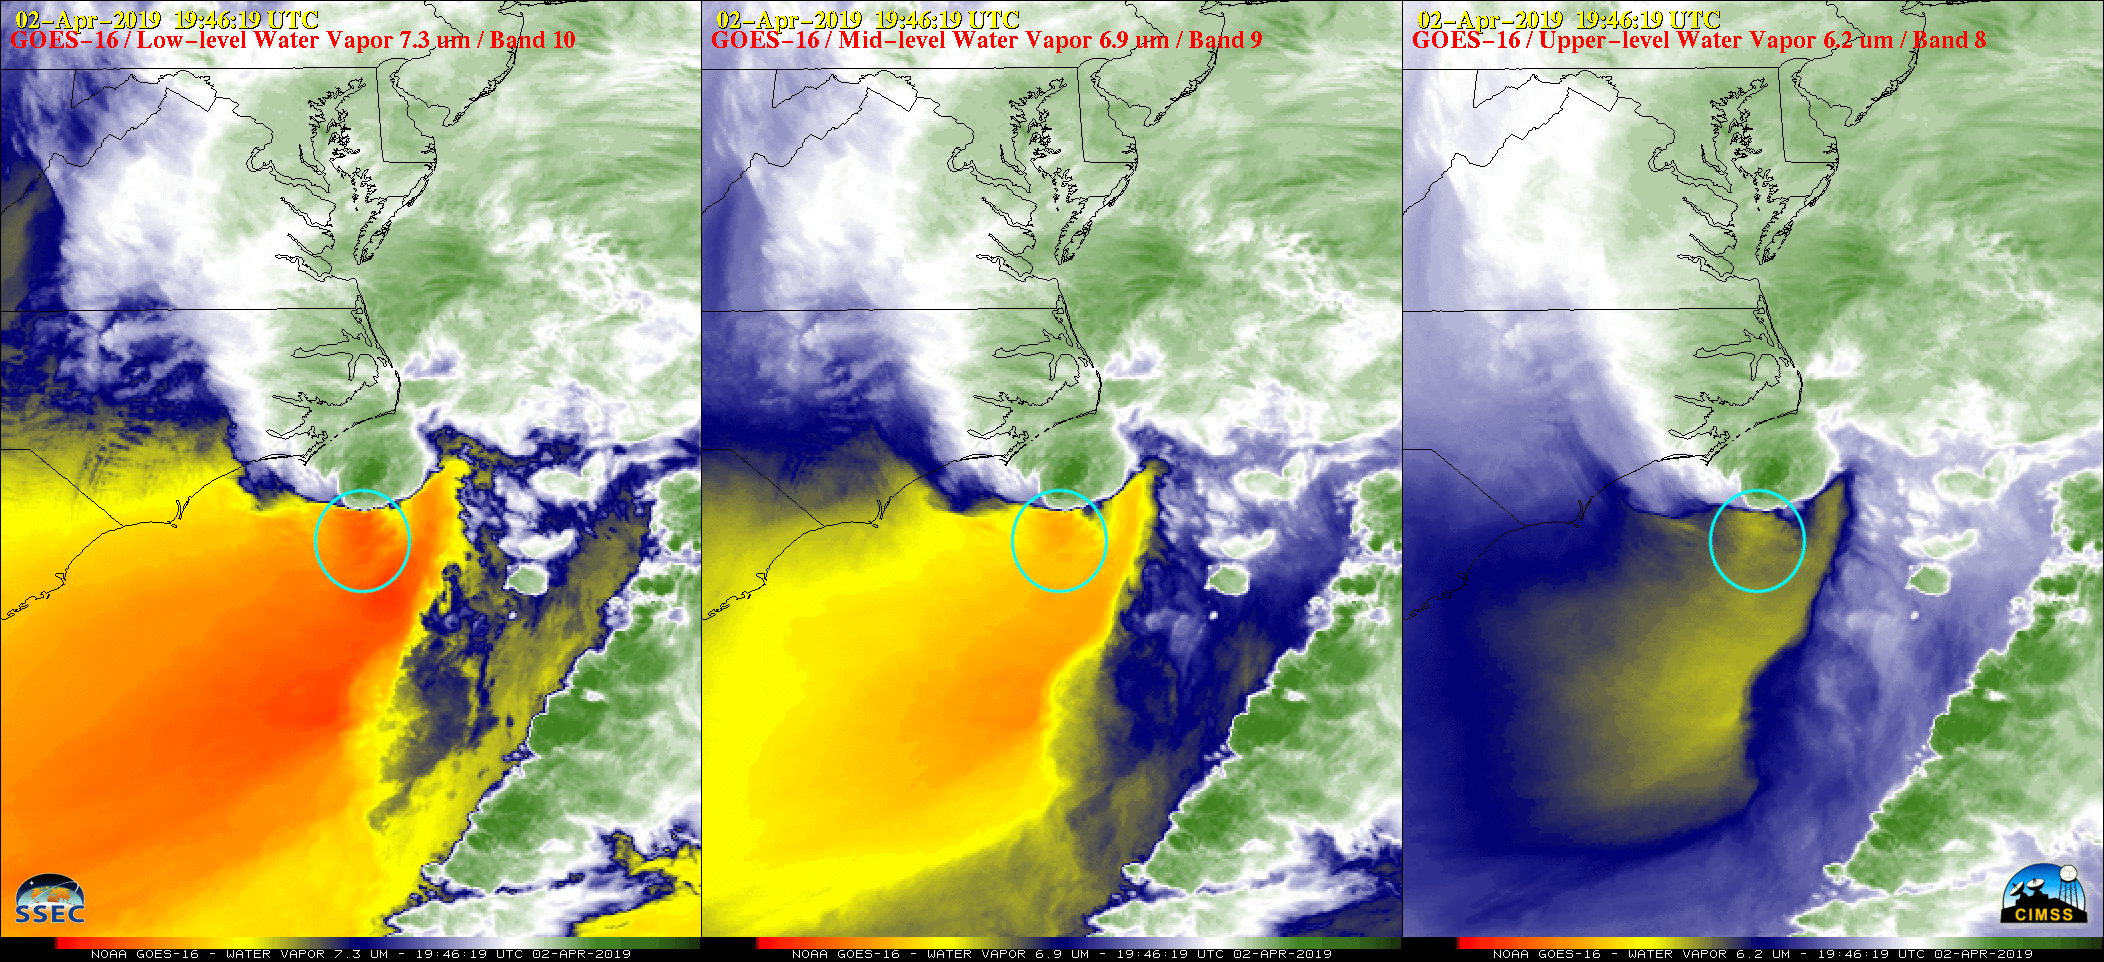
GOES-16 Low-level (7.3 µm), Mid-level (6.9 µm) and Upper-level (6.2 µm) Water Vapor images [click to play animation | MP4]
![GOES-16 "Clean" Infrared Window (10.3 µm) images [click to play MP4 animation]](https://cimss.ssec.wisc.edu/satellite-blog/wp-content/uploads/sites/5/2019/04/190402_goes16_infrared_North_Carolina_coastal_low_anim.gif)
GOES-16 “Clean” Infrared Window (10.3 µm) images [click to play animation | MP4]
Yesterday’s top long lasting expansive superbolt lightning flash #GOES16 #GLM @NOAASatellites pic.twitter.com/r4kP7vORjO
— Michael J. Peterson (@WeatherArchive) April 4, 2019
As you might imagine, this monster system produced some incredible lightning #GLM #lightningfromspace #GLMTOE pic.twitter.com/diBKAEOJVG
— Scott Rudlosky (@goesglm) April 3, 2019
A comparison between 1-km resolution Terra MODIS Infrared Window (11.0 µm) imagery at 0237 UTC with an Aqua MODIS Sea Surface Temperature product at 1755 UTC on the following afternoon (below) showed that the storm intensified and formed the large eye-like feature over the northern portion of the axis of warmest Gulf Stream water (where SST values were in the 70-76ºF range).
![Terra and Aqua MODIS Infrared Window (11.0 µm) images from 0237 UTC and 0649 UTC, along with the Aqua MODIS Sea Surface Temperature product at 1755 UTC [click to enlarge]](https://cimss.ssec.wisc.edu/satellite-blog/wp-content/uploads/sites/5/2019/04/190403_modis_infraredWindow_seaSurfaceTemperature_bomb_cyclone_2_anim.gif)
Terra MODIS Infrared Window (11.0 µm) image at 0237 UTC, along with the 1755 UTC Aqua MODIS Sea Surface Temperature product [click to enlarge]
![NOAA-20 VIIRS Infrared Window (11.45 µµ) and Day/Night Band (0.7 µm) images [click to enlarge]](https://cimss.ssec.wisc.edu/satellite-blog/wp-content/uploads/sites/5/2019/04/190403_0651utc_noaa20_infraredWindow_dayNightBand_surfaceAnalysis_coastal_low_anim.gif)
NOAA-20 VIIRS Infrared Window (11.45 µm) and Day/Night Band (0.7 µm) images, with an overlay of the 06 UTC surface analysis [click to enlarge]