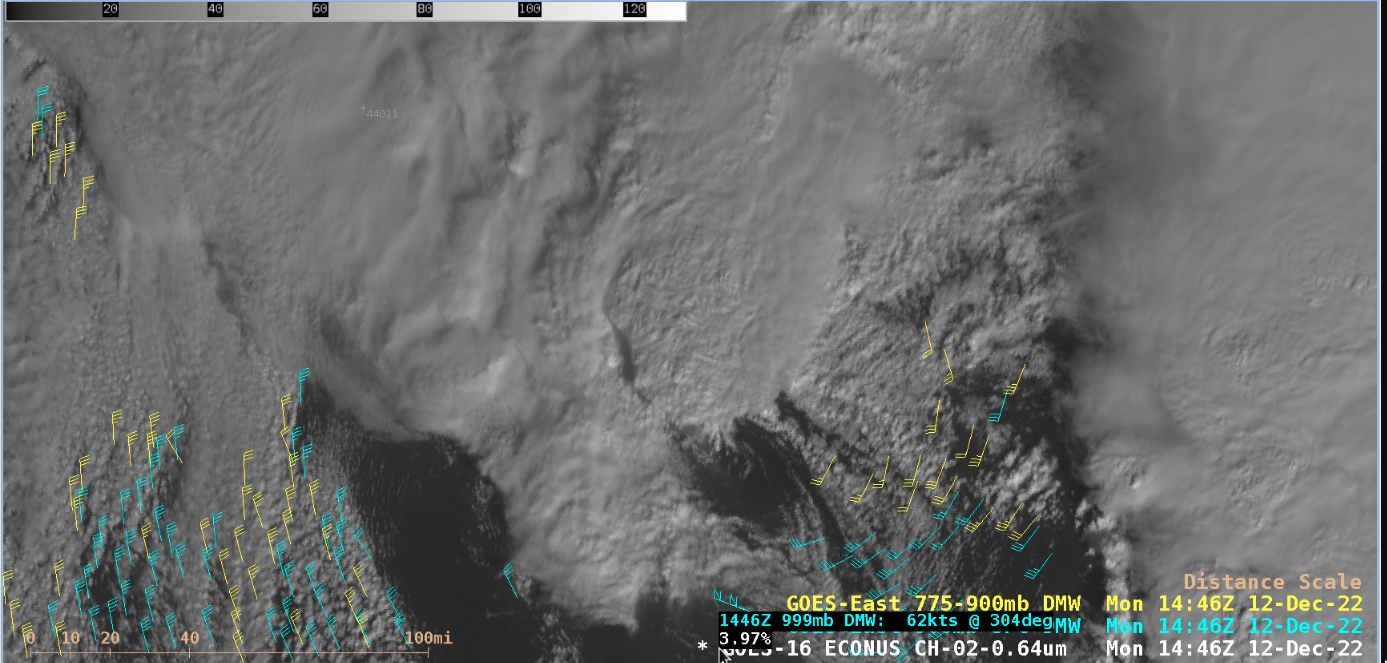
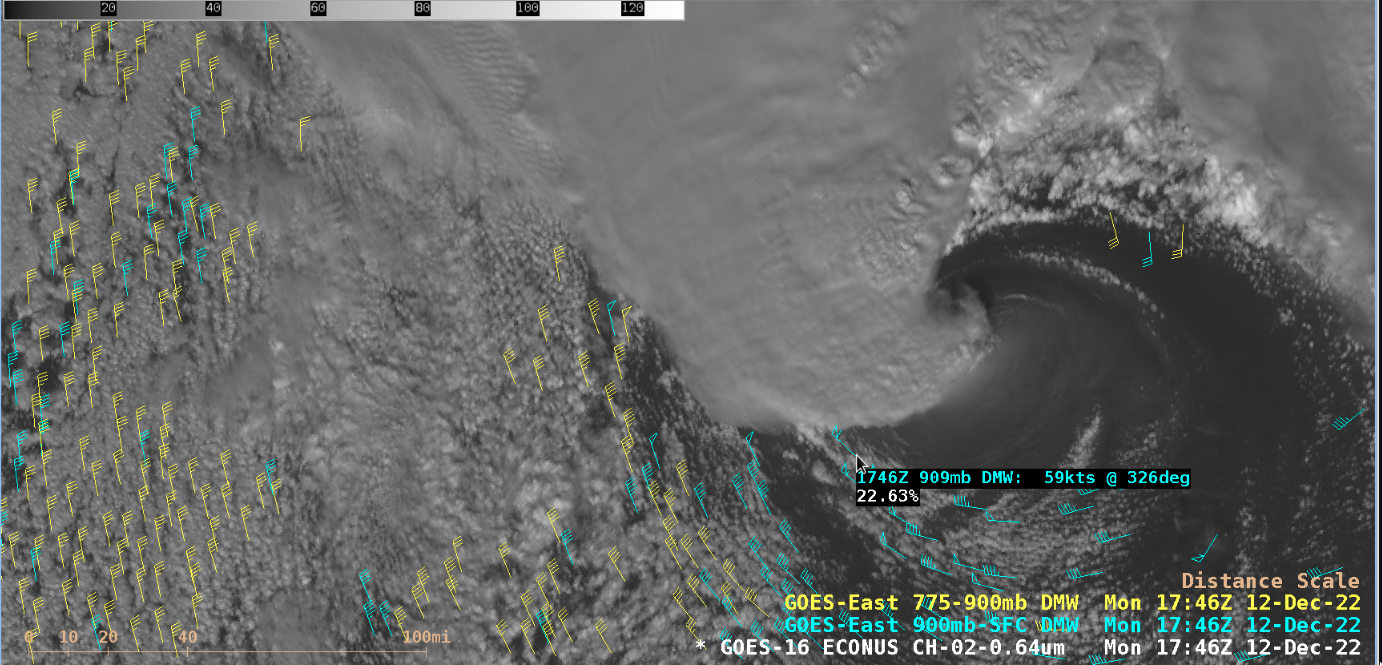
Satellite signature of strong surface winds over the West Atlantic Ocean
GOES-16 “Red” Visible (0.64 µm) images, with plots of GOES-16 Derived Motion Winds within the 775 – 900 hPa layer (yellow) and the 900 hPa – Surface layer (cyan) [click to play animated GIF | MP4]
This region of enhanced diffuse reflection was further highlighted in GOES-16 True Color RGB images from the CSPP GeoSphere site (below).
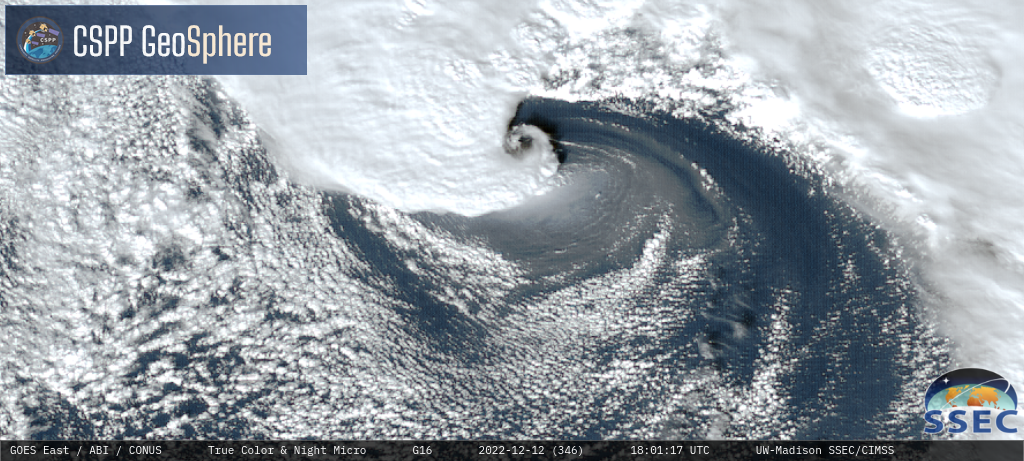
GOES-16 True Color RGB images [click to play MP4 animation]
GOES-16 Low-level Water Vapor (7.3 µm) images [click to play animated GIF | MP4]
Suomi-NPP VIIRS Visible (0.64 µm), Near-Infrared (0.87 µm), Near-Infrared (1.61 µm), Shortwave Infrared (3.74 µm), Infrared Window (11.45 µm), True Color RGB and False Color RGB images, along with GOES-16 Derived Motion Winds [click to enlarge]