True color imagery from the CSPP Geosphere site, shown above (click here for a direct link to the animation), depicts the sudden appearance and equally sudden ending of a small fire on the Texas Gulf Coast in Jefferson County, east-northeast of Houston.
The Fire Temperature RGB also shows the quick development (and cessation) of the fire; this RGB is a good situational awareness tool, as it shows an obvious color change (related to the increase in emissions of shortwave radation) when the fire initiates.

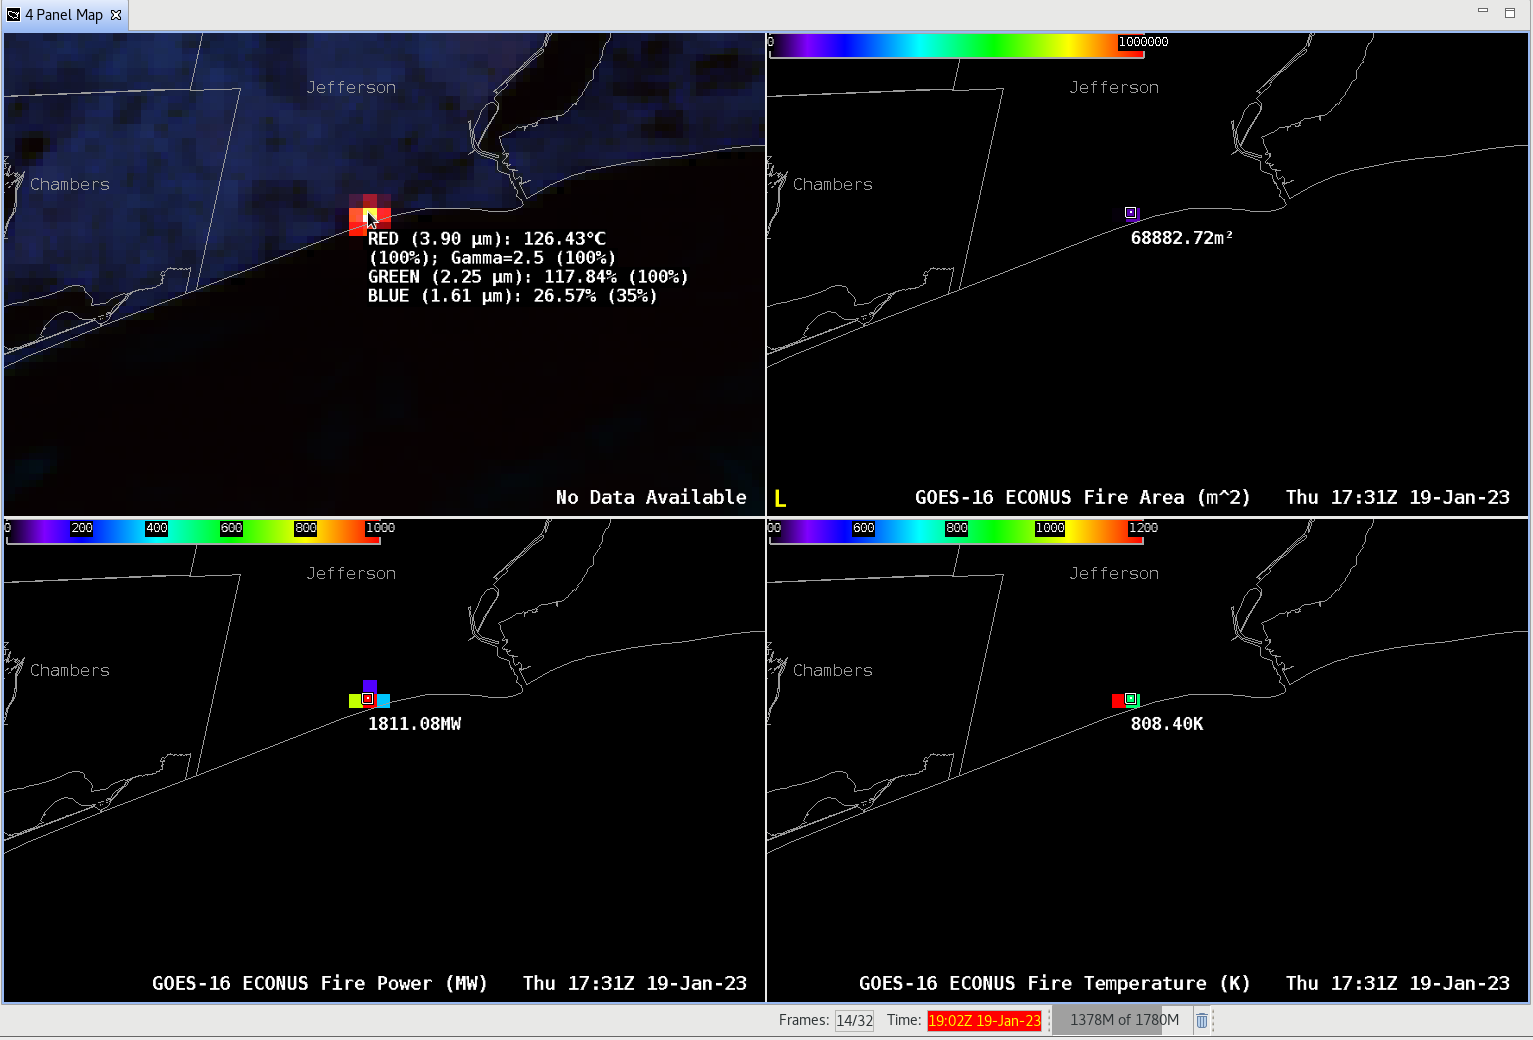
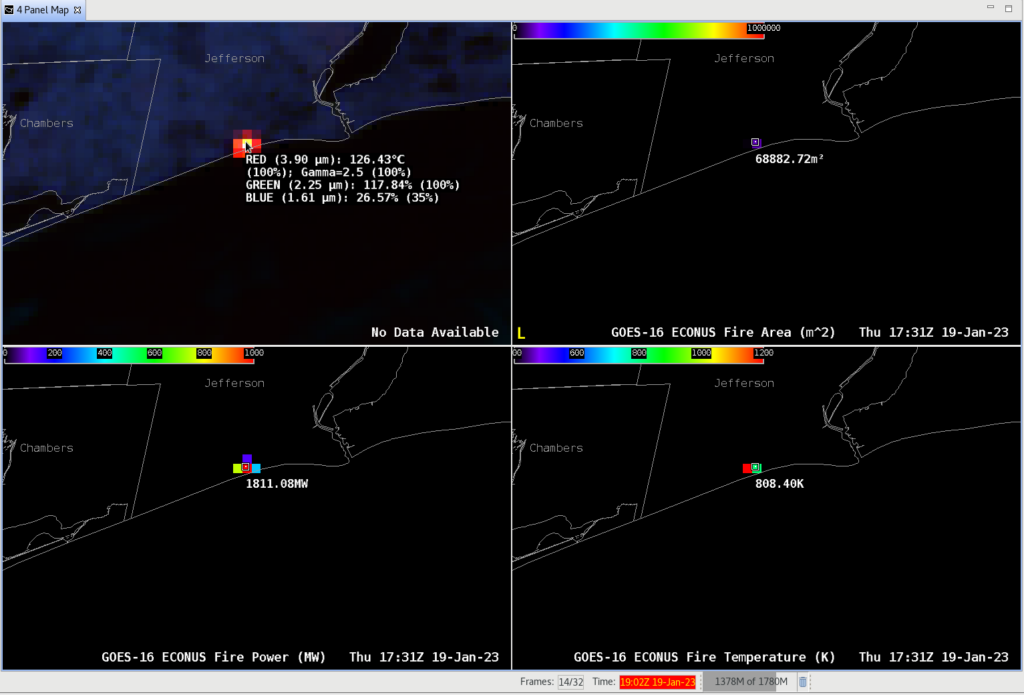
GOES-R has derived products that quantify aspects of the detected fire, as shown in the four-panel image below from 1731 UTC, near the time when the fire was most intense. Note the contributions of the red and green components of the RGB, from the 3.9 µm and 2.25 µm channels, respectively, on GOES-16, have maximized in the center pixel, so that pixel is yellow in the RGB (red + green in an RGB yields yellow); had the 1.61 µm emissions been stronger (that is, had the fire been hotter), the pixel would look whiter. The Fire Products (Area, Temperature, Power) are most useful as data assimilated into models that might simulate the evolution of the fire, or the distribution of smoke.
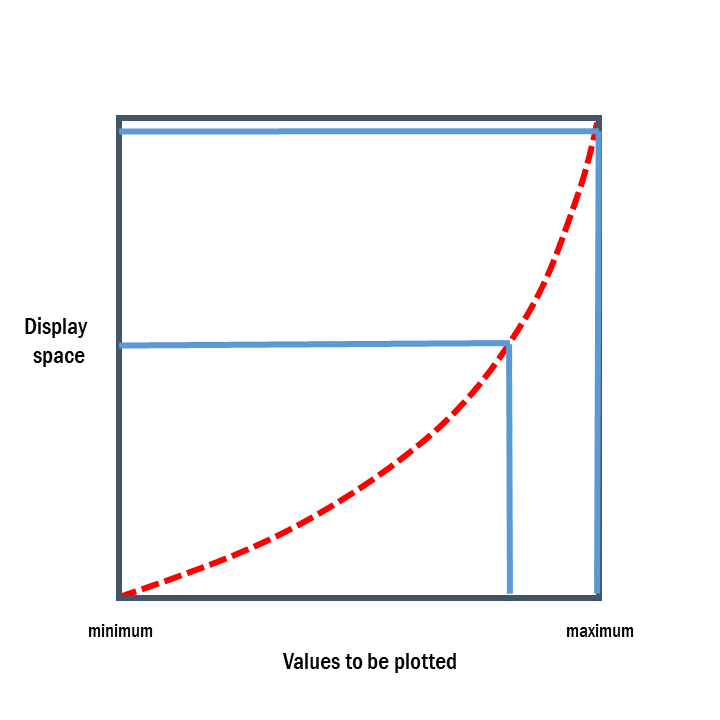
The Fire Temperature RGB is one of the few RGB products in AWIPS that has a gamma adjustment. A gamma adjustment alters how the ranges of input values (in this case, 3.9 µm brightness temperatures) are displayed. For the Fire Temperature RGB, the warmest parts of the 3.9 µm brightness temperatures occupy proportionally more of the display space in the RGB, and the cooler parts of the RGB (where fire is unlikely, yet information is still needed!) occupy less.
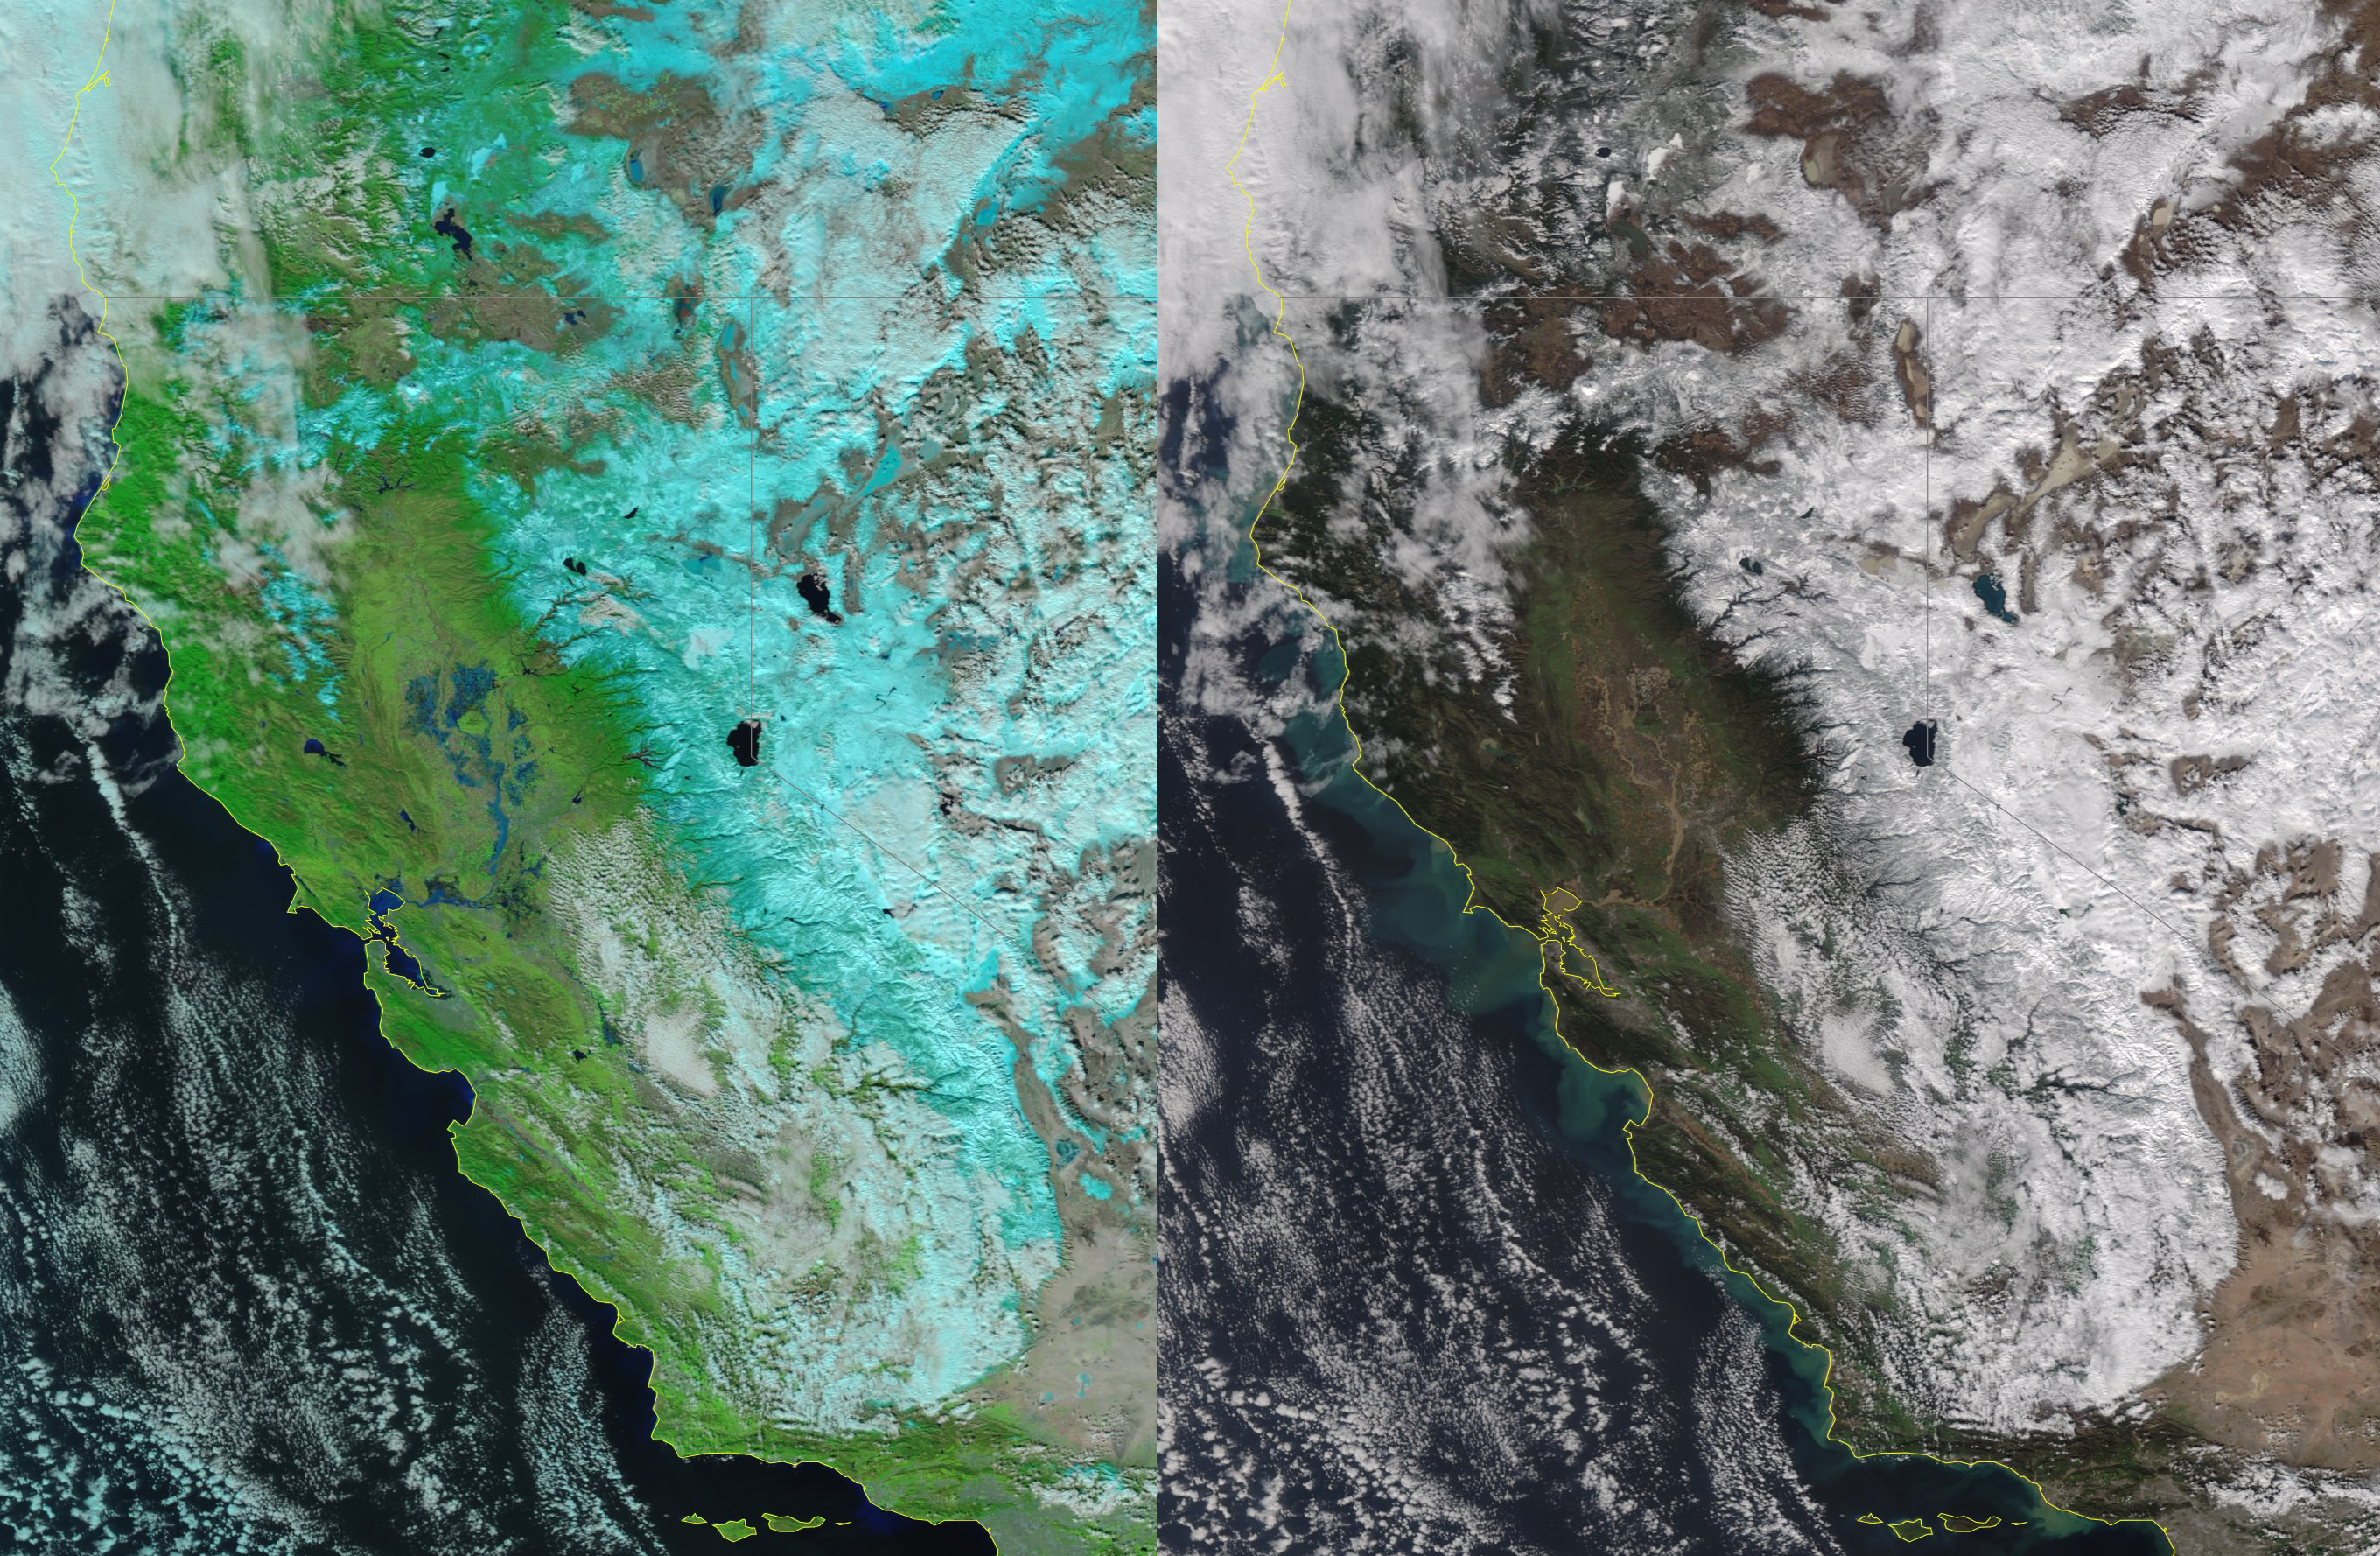
AWIPS allows a gamma adjustment to be altered (using the ‘Composite Options’ window). The toggle below compares the default RGB to one in which the Band 7 Gamma adjustment has been changed to Gamma = 1, resulting in a very red image (because cooler brightness temperatures — that are not that relevant to the detection of fire — are more emphasized).

Note: AWIPS users might note that the default Gamma of the RGB is 2.5, but the Quick Guide shows the Gamma to be 0.4 (that is, 1/2.5)! This may be a source of confusion. This website shows a Gamma modification of 1/Gamma — and if Gamma is 0.4, that exponent becomes 2.5, which is what AWIPS shows.
View only this post Read Less


