NUCAPS Cross Sections over the south Pacific
An animation from the CSPP Geosphere site, above (link), shows a quiescent period in/around Samoa and American Samoa. Low clouds (purple and pink) occasionally developed overnight into showers (dark red) that then dissipated.
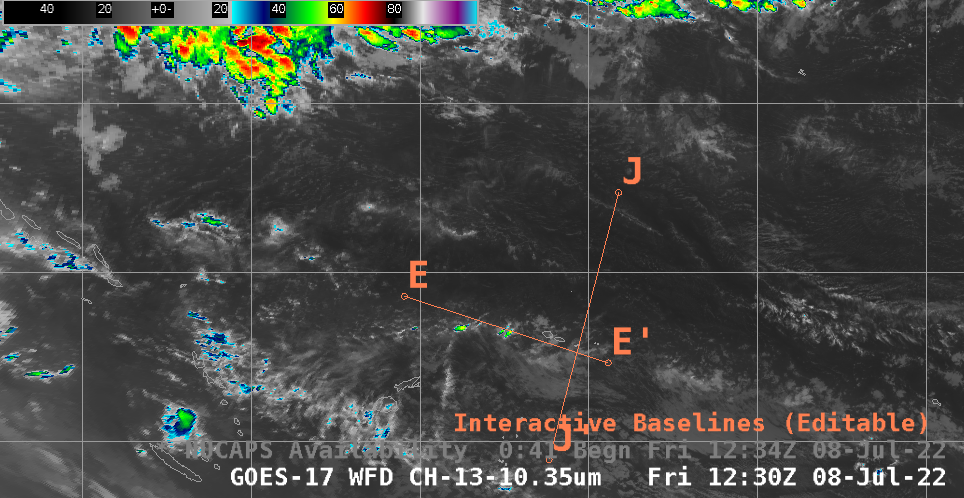
NOAA-20 overflew the Samoan islands at around 1200 UTC on 8 July, as shown in the toggle below with GOES-17’s clean window imagery (10.3 µm). The clean window imagery (as well as NOAA-20’s Day Night Band visible imagery) show no organized or large areas of precipitation, although some cold cloud tops suggest a few showers to the west of Samoa at 1230 UTC. The location of NUCAPS profiles are shown. These profiles can be used to create gridded horizontal fields of thermodynamic variables (available in AWIPS, and also at this site).

The Samoan islands are within a narrow band of enhanced total precipitable water, as shown in the MIMIC Total Precipitable Water fields below (current data; archive data). As noted above, no organized shower activity is associated with this moist band.
The Cross-Section lines J-J’ and E-E’ are represented in the GOES-17 imagery, and cross-sections of equivalent potential temperature from gridded NUCAPS Fields and from the 1-degree Global GFS model are shown below. The J-J’ cross-sections are similar: Strong low-level Potential Instability at the edges with a weaker low-level potential instability in the center of the cross-section. The 1200 UTC Sounding from Pago Pago is shown here, from this site. The atmosphere is moist up to 550 mb.
Use Cross Sections of gridded NUCAPS fields (accessible as shown in this blog post) to make comparisons to numerical models in regions where conventional data are sparse — such as over the Pacific Ocean.
This blog post used imagery from the NOAA/NESDIS TOWR-S cloud instance of AWIPS. Thank you!