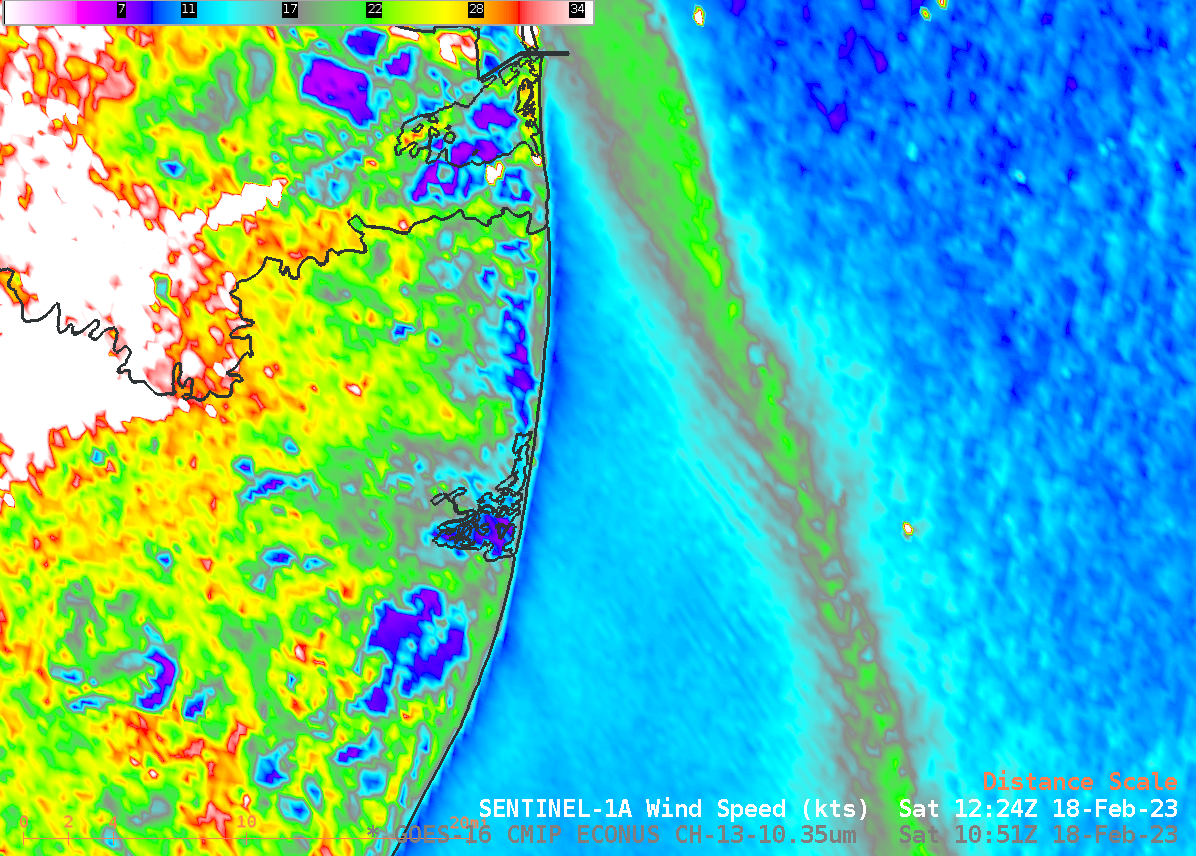
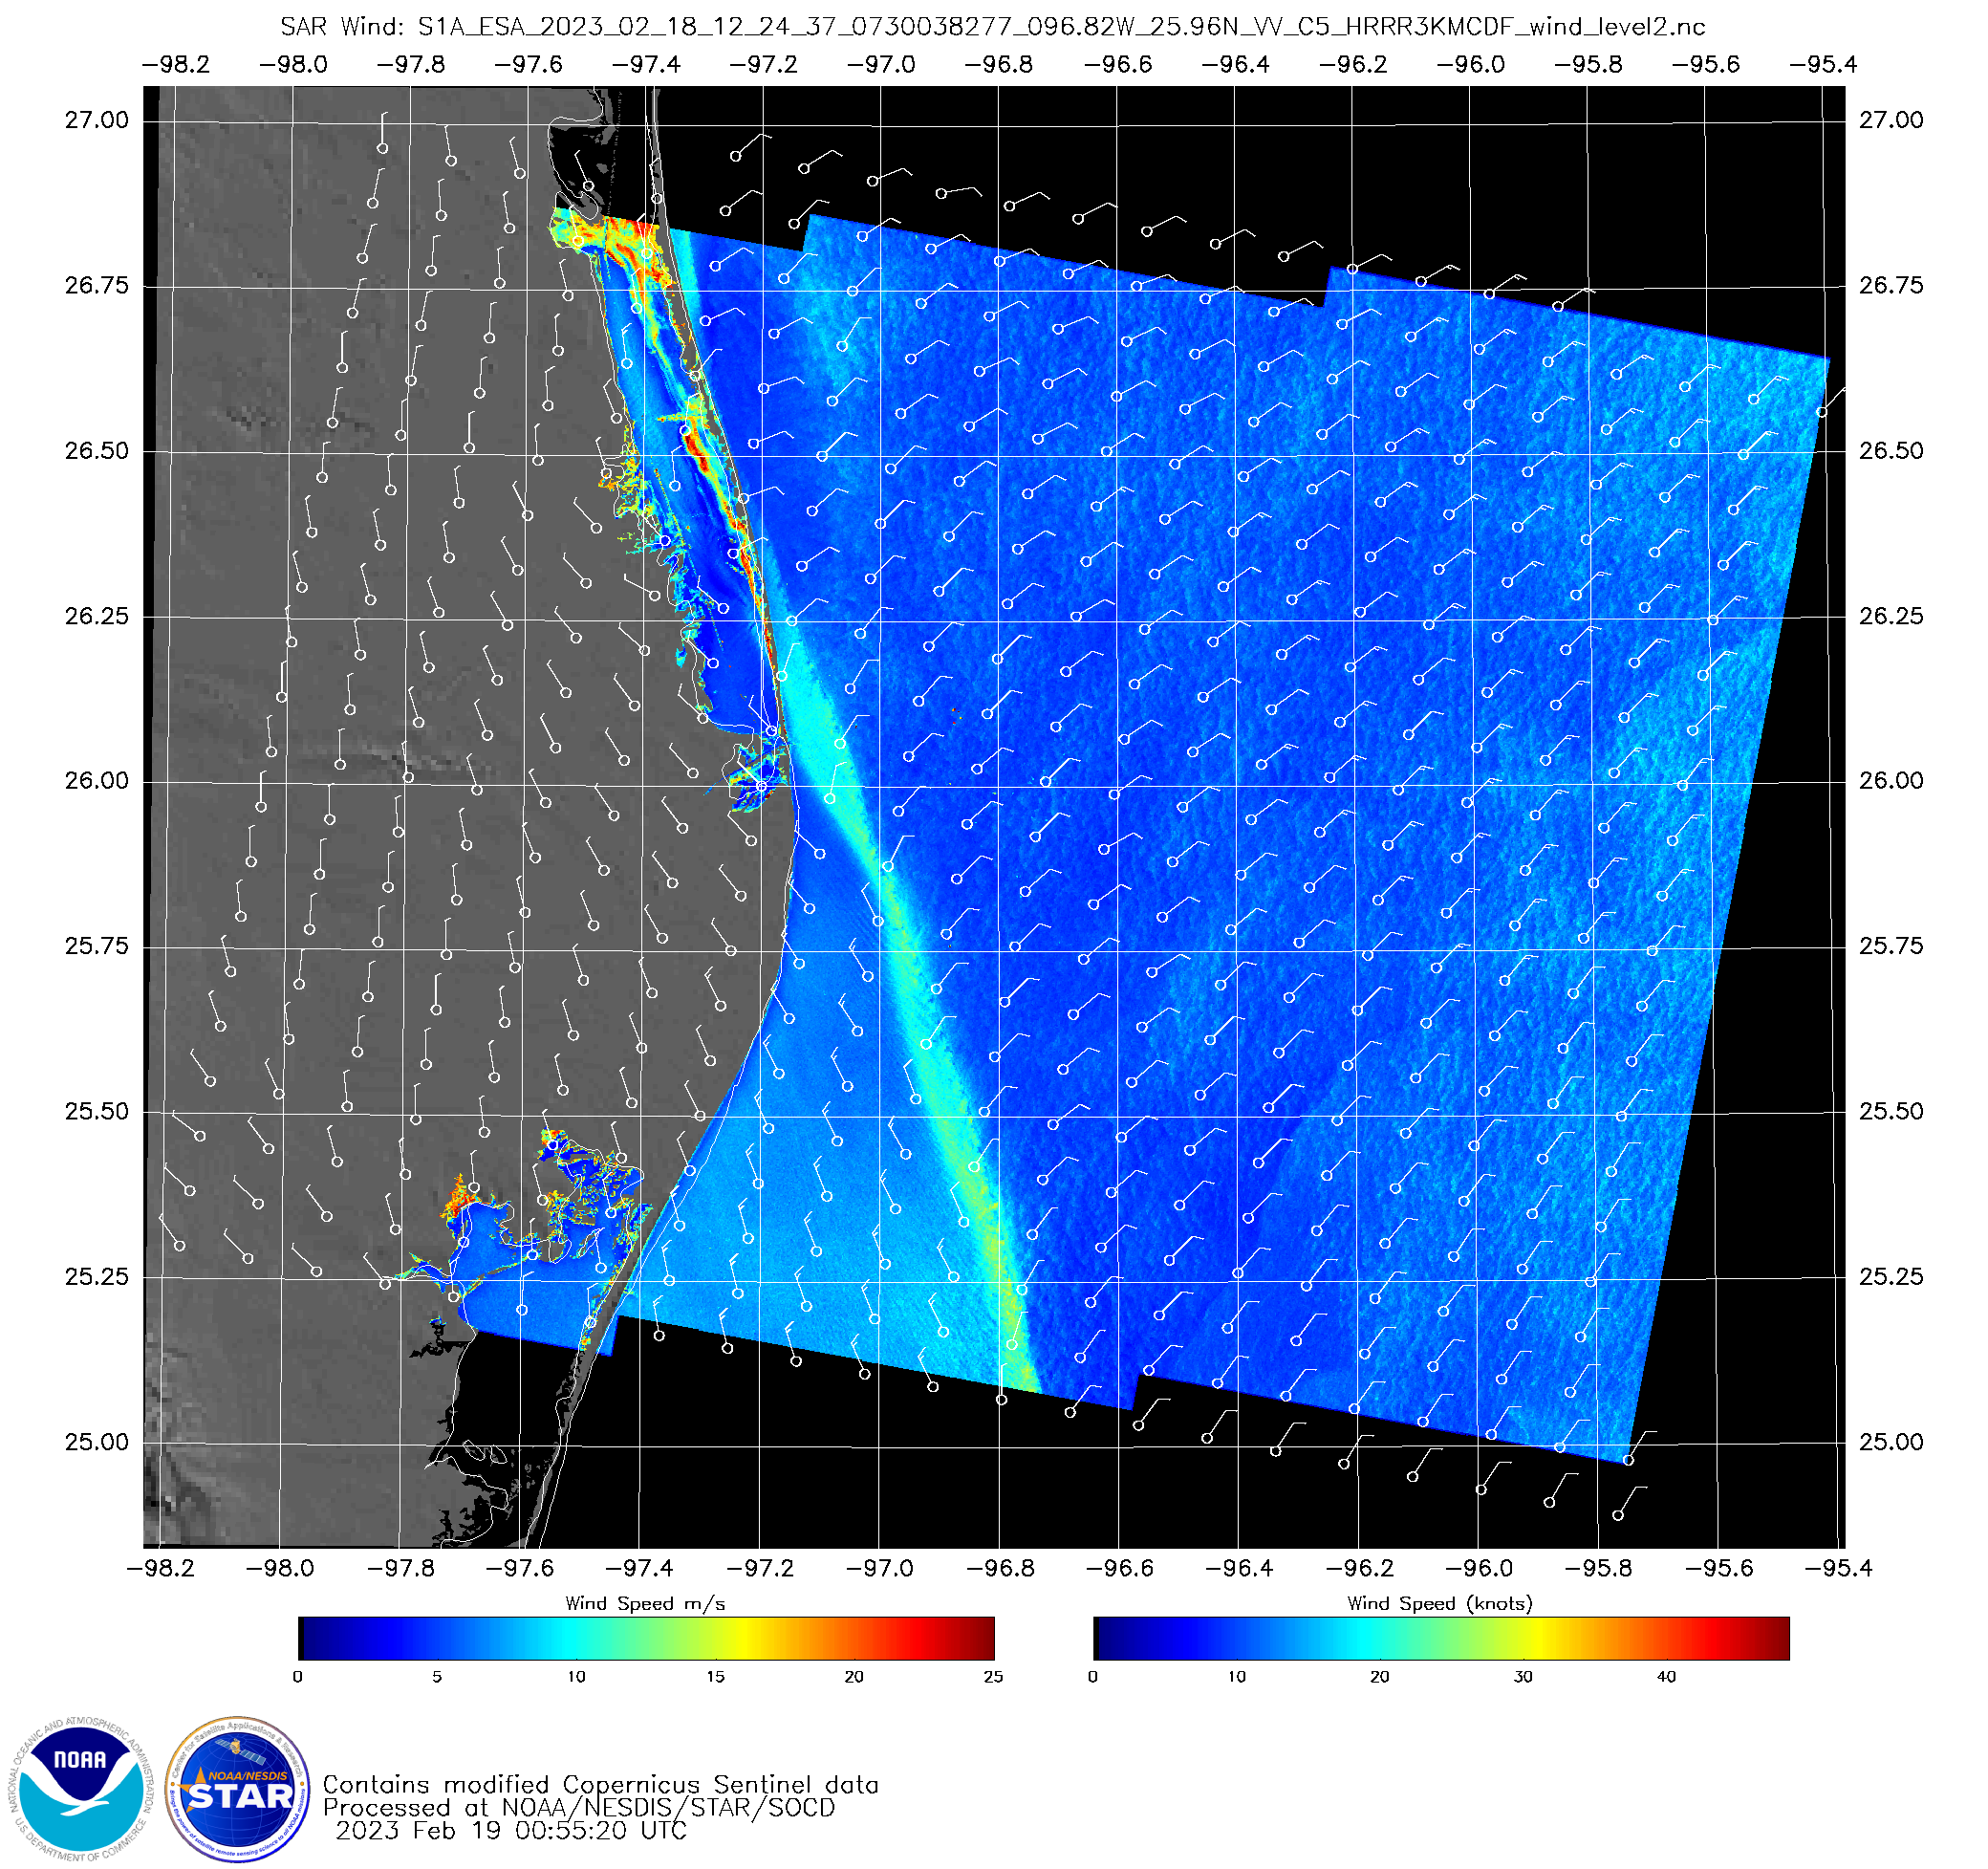
Sentinel-1A SAR data just before sunrise captured a very narrow region of enhanced winds just south of the Rio Grande delta on 18 February 2023, as shown above in a toggle with the 1226 UTC GOES-16 Band 13 Clean Window infrared (10.3 µm) imagery. There appears to be no obvious relationship between the wind structures and the brightness temperatures at this time. However, an animation of the infrared imagery for the 3 hours before sunset, below, shows a similar north-south linear feature, in about the same place as the SAR winds, between 1000 and 1100 UTC. (Here’s a toggle of the 1224 UTC Sentinel winds and the 1036 UTC Band 13 imagery).
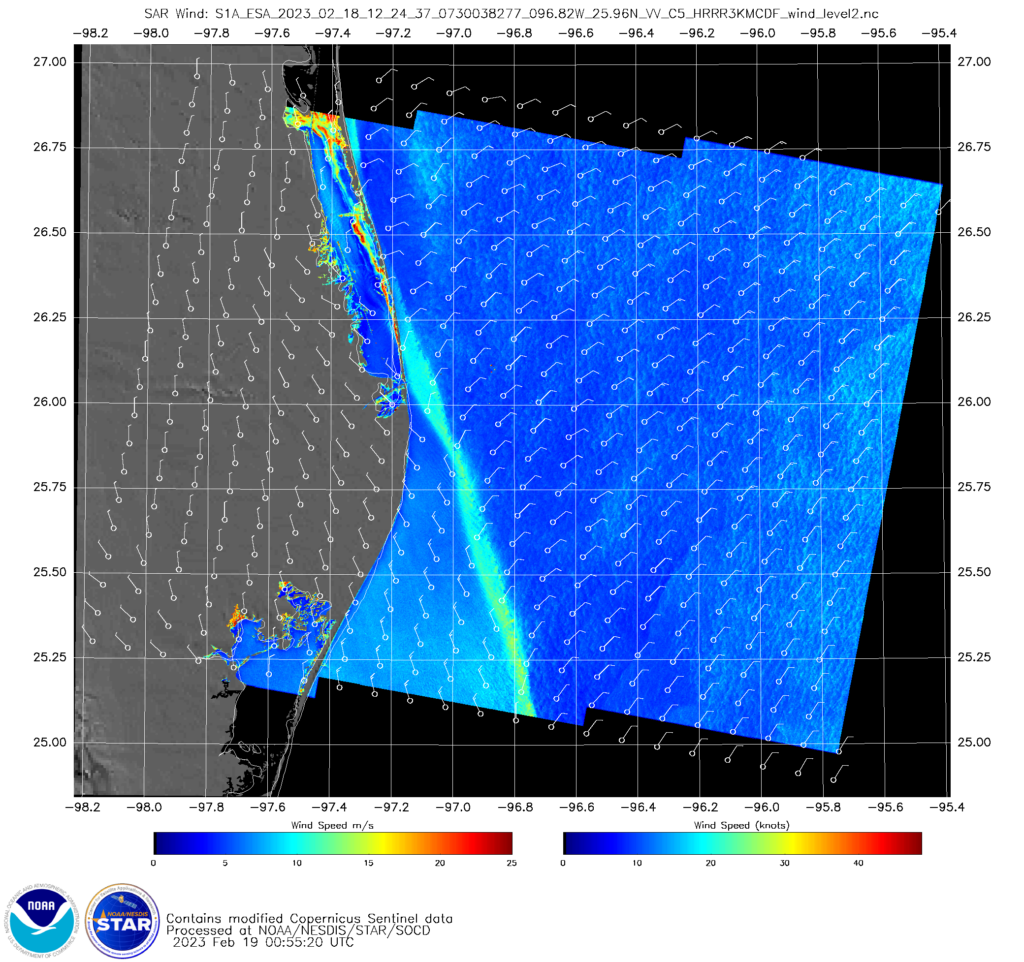
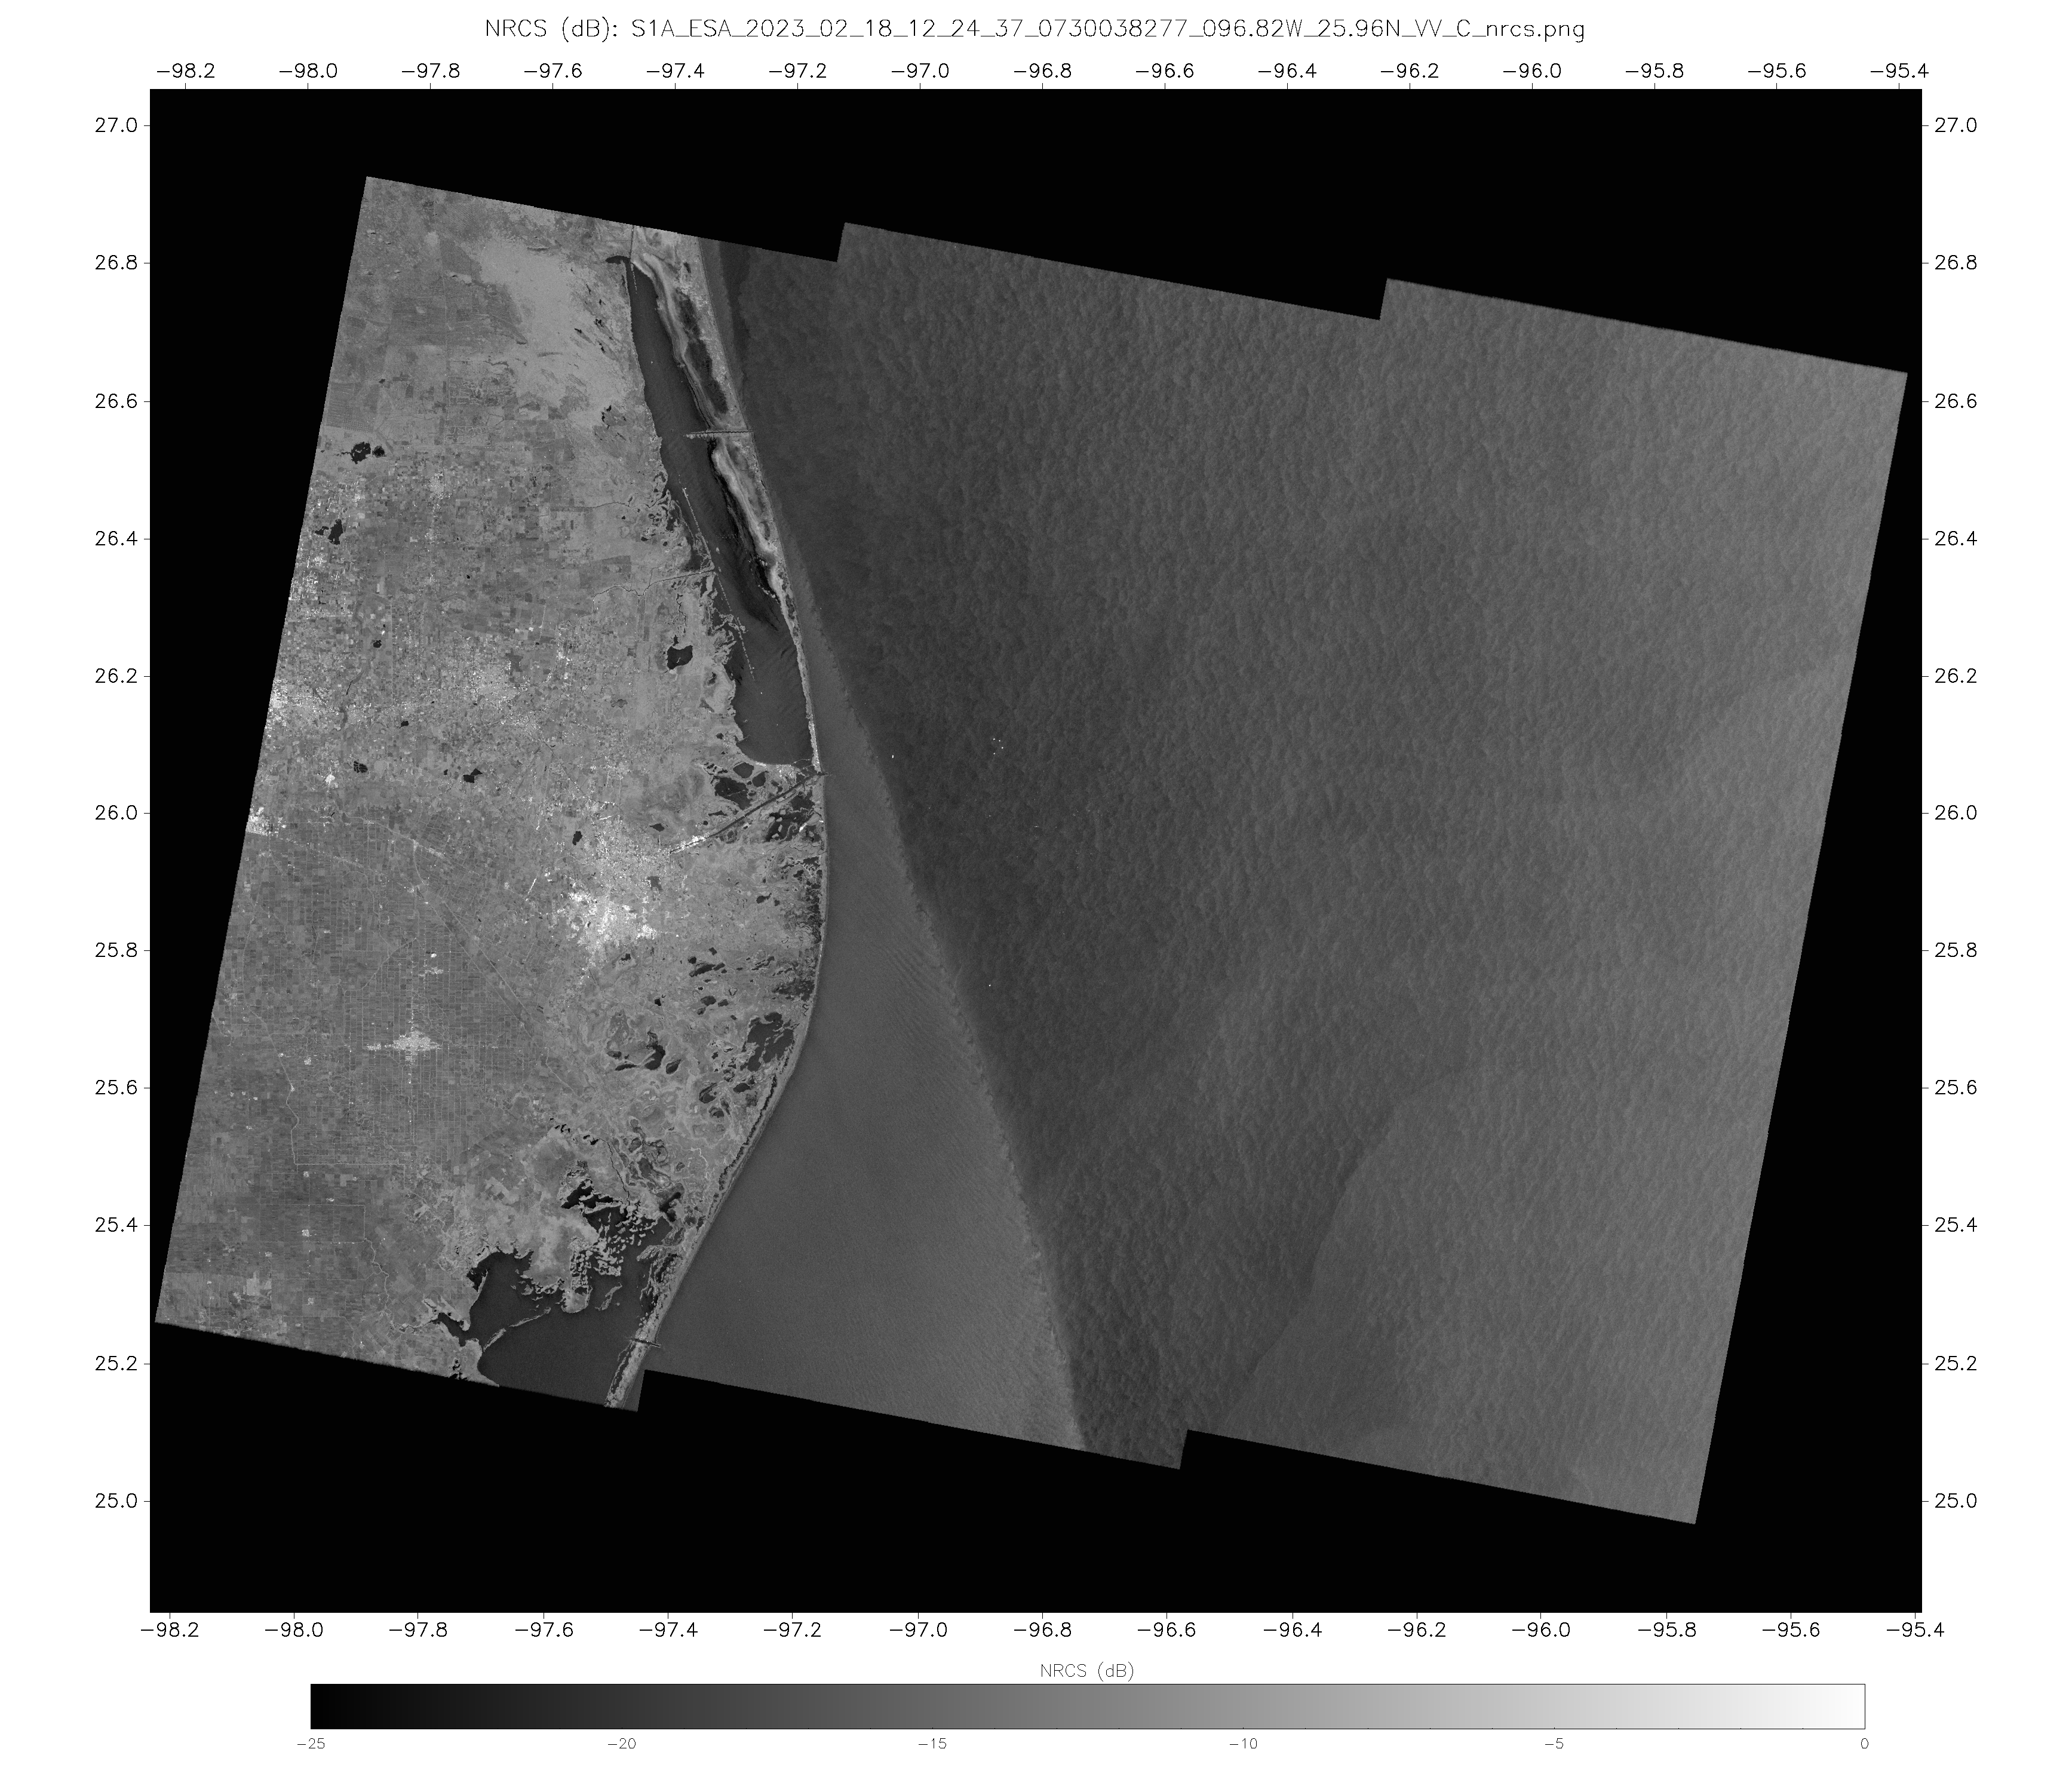
The 1200 UTC surface analysis (click here) from the 18th shows the Texas Gulf Coast near a ridge axis with easterly winds indicated. However, the Sentinel-1A wind analysis, shown below (from this website; direct link to image), shows convergence into the line of stronger winds. The normalized radar cross-section (NRCS) image (here, or here at the NOAA/STAR website), from that same website, shows evidence of small-scale gravity waves on the western edge of the wind maxima. Those fields are visible in the AWIPS imagery as well.
View only this post Read Less


