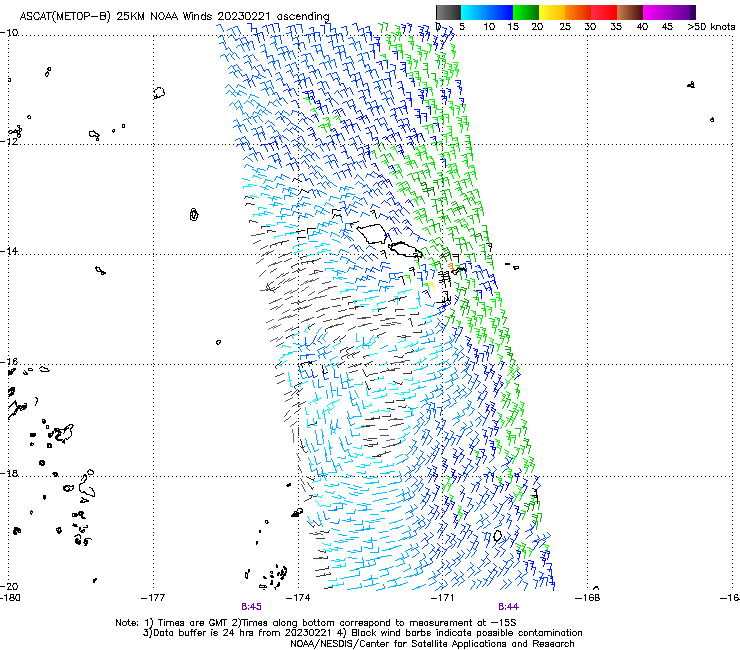
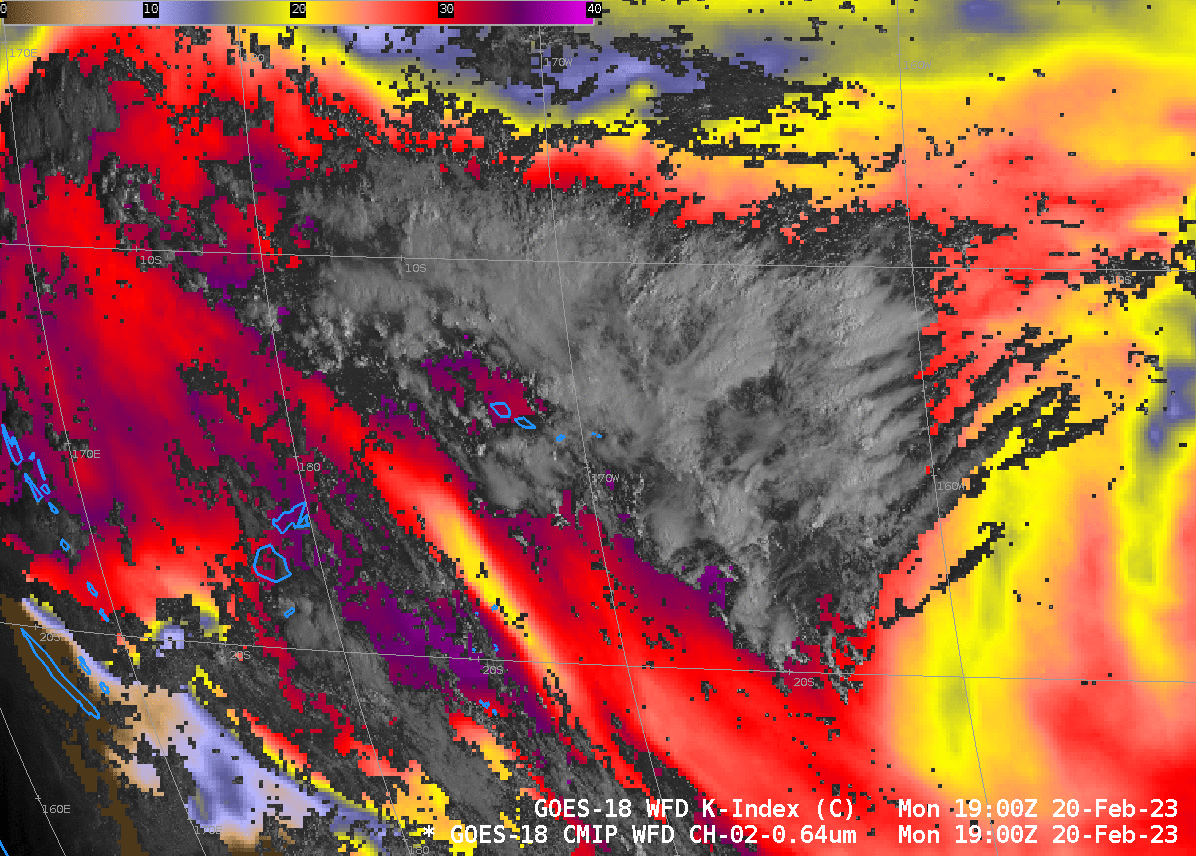
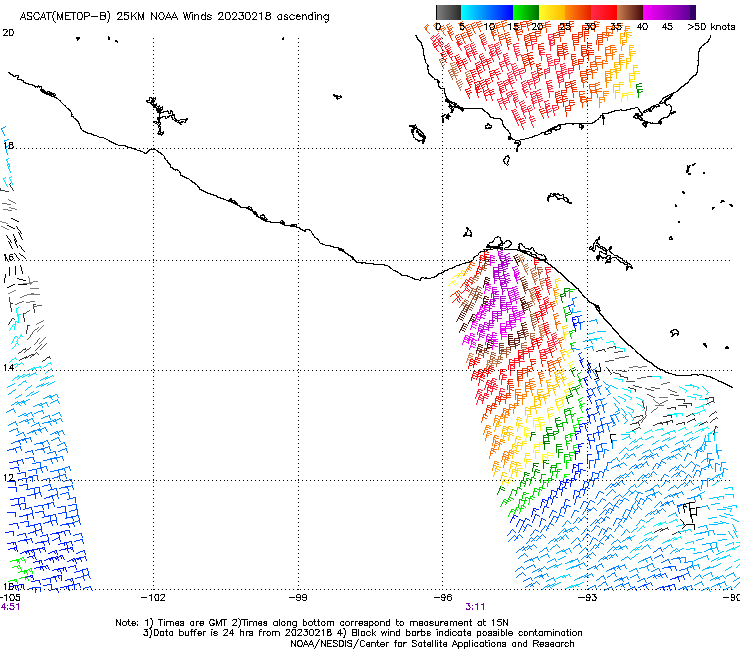
Heavy Rains overspread the Samoan Islands late on 20 February/early on 21 February 2023. ASCAT scatterometry from 0845 UTC on 21 February, above, (from this website), shows strong northerly winds Equatorward of the Samoan Islands, and weaker winds to the south: surface convergence is indicated. The animation below shows GOES-18 Visible imagery overlain on top of GOES-18 K-Index, one of the derived stability indices routinely produced. At this time, a large area of disturbed weather is located to the east of American Samoa.
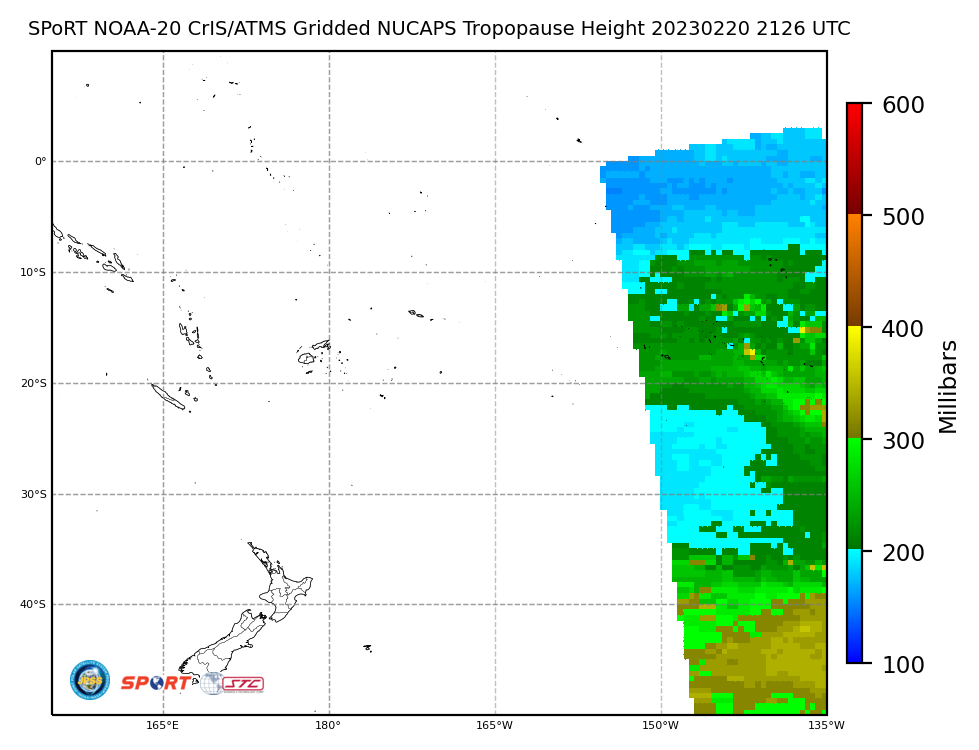
The disturbed weather was associated with a trackable feature, a lowered tropopause, in gridded NUCAPS fields (available at this site). The lowered tropopause is highlighted in green values below and surrounded by higher tropopause values that are blue/cyan. This feature was attached to the lower tropopauses poleward of 30oS (see this image from 2126 UTC on 20 February)

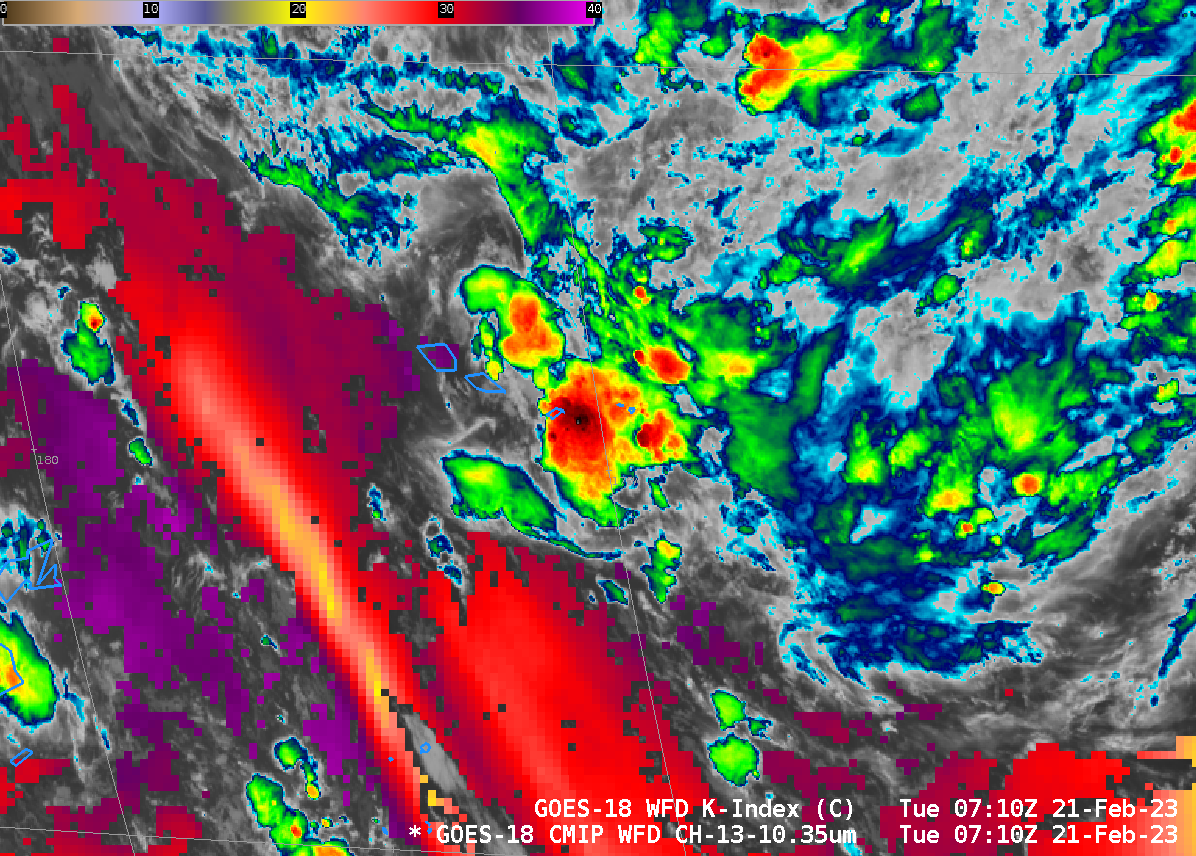
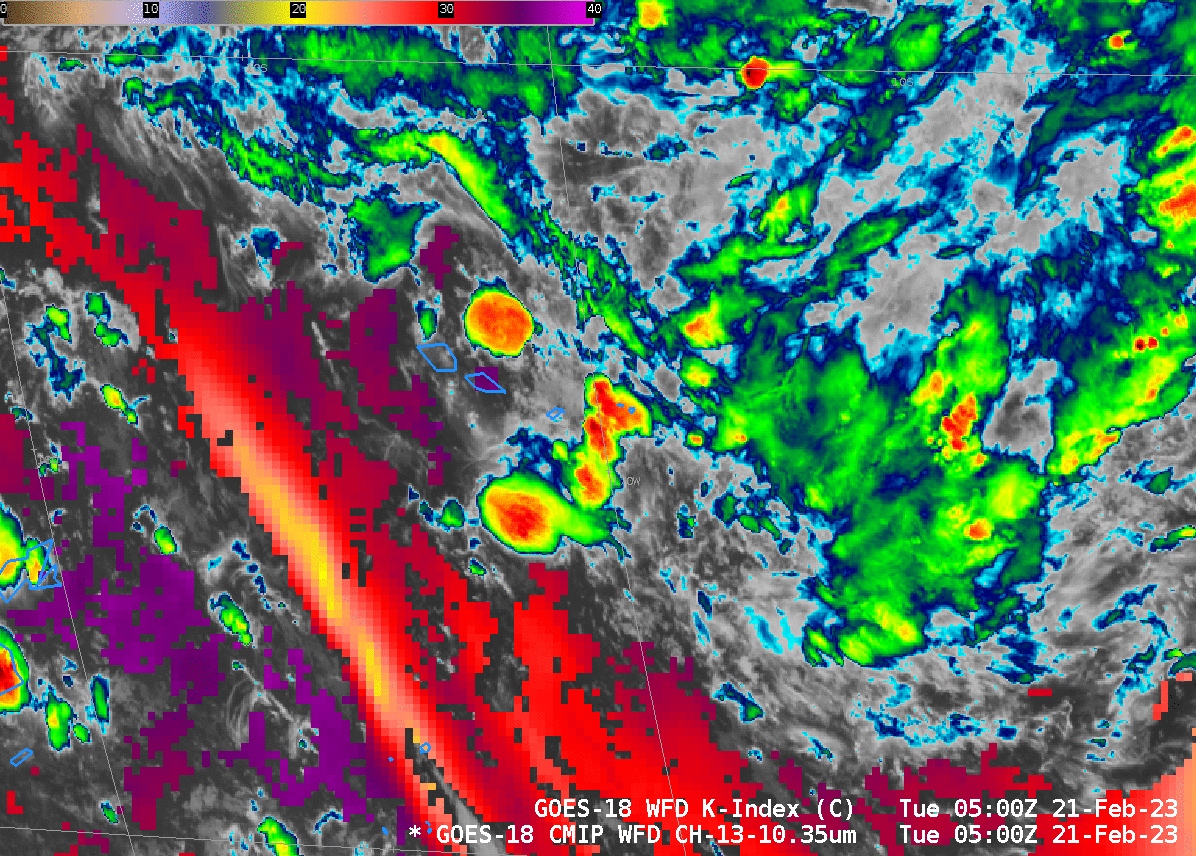
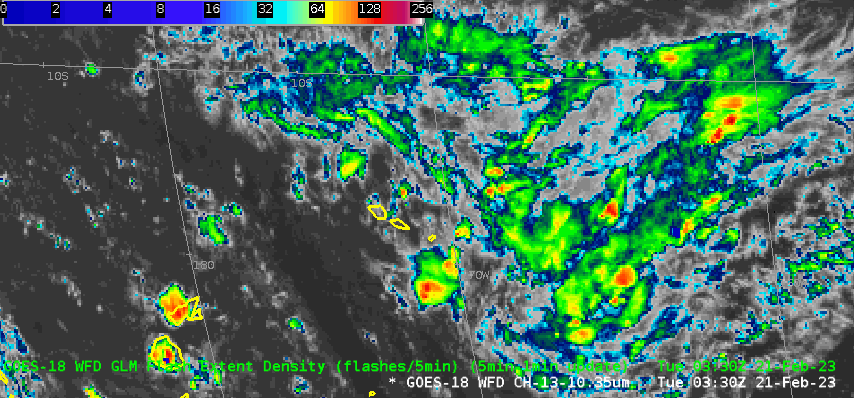
The animation below shows GOES-18 Band 13 Clean Window infrared (10.3 µm) imagery underlain with Clear-Sky-only estimates of K Index. Vigorous and persistent convection develops near Tutuila (America Samoa’s largest island) around 0700 UTC and continues through the end of the animation as it also builds northwestward over Western Samoa.
Flash Extent Density observations from the Geostationary Lightning Mapper (GLM) on GOES-18 show abundant lightning with the convection around the Samoan Islands.
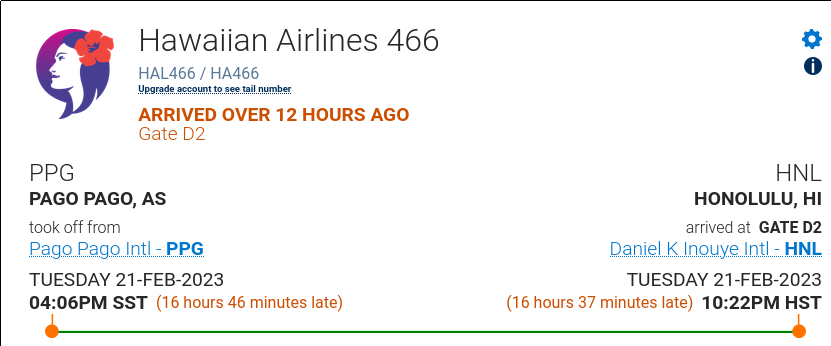
What were the impacts from this convection? Flash Flooding occurred on American Samoa, as almost five inches of rain fell at the airport between 9 PM and 4 AM Samoa Standard Time (that is, 0800 UTC to 1500 UTC). In addition, Hawaiian Airlines Flight 465 (from Honolulu to Pago Pago) landed on time — but lightning prevented passengers from disembarking for 2 hours. Consequently, the return flight (Hawaiian Airlines Flight 466) was delayed 16 hours because of crew time constraint]
———————————————————————————————————————————–
Another heavy rain event across the islands of American Samoa was documented in February 2021.
View only this post Read Less


