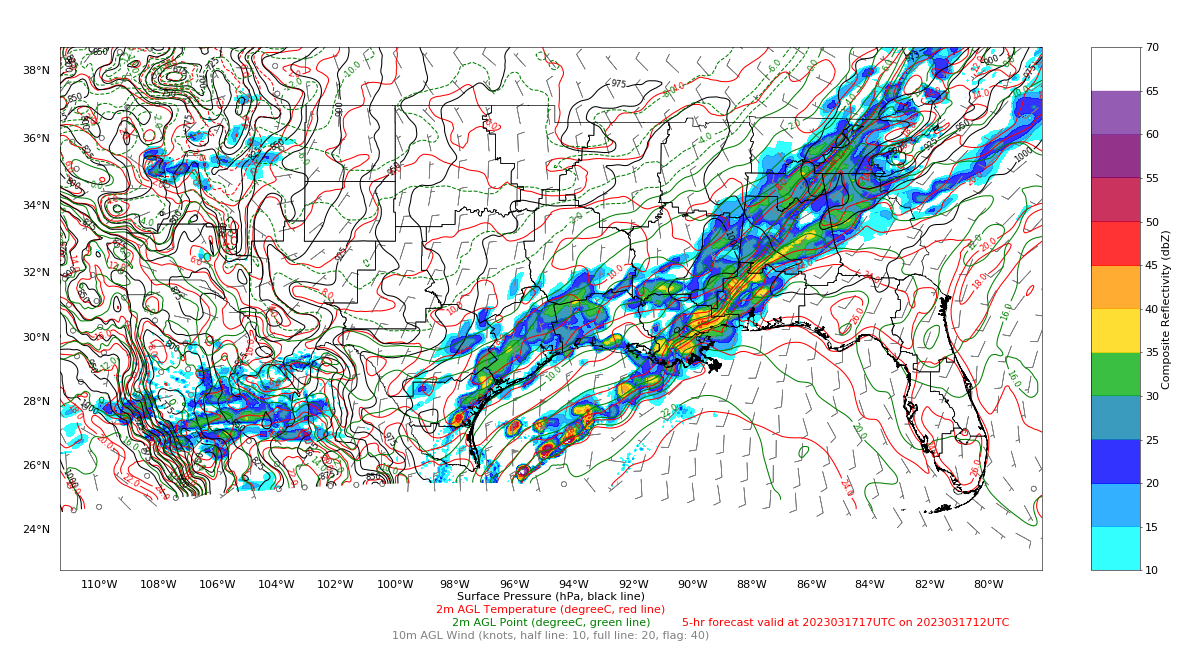
This is the first in a series of posts on the 2023 version of PHSnMWnABI modeling. CIMSS this year will again be supplying output to the Hazardous Weather Testbed (HWT, from late May through mid-June 2023) from a modeling system that includes Polar Hyperspectral Soundings (Infrared and Microwave) that are fused with ABI data (refer to this paper or this one on Data Fusion). Blog Posts on the efficacy of this modeling system from last year’s HWT can be viewed here. Model run output is available at this website where you will see a calendar. Choose the day to view. Consider the 500-mb analysis shown below, at 1700 UTC from the 1200 UTC run on 17 March, when a slight risk of severe weather over the central Gulf Coast was forecast by the Storm Prediction Center. The strongest convection stretched southwest to northeast across extreme southeastern Louisiana into southwestern Alabama — the forecast convection has not yet reached Mobile. A second line of showers lingers over southeast Texas.
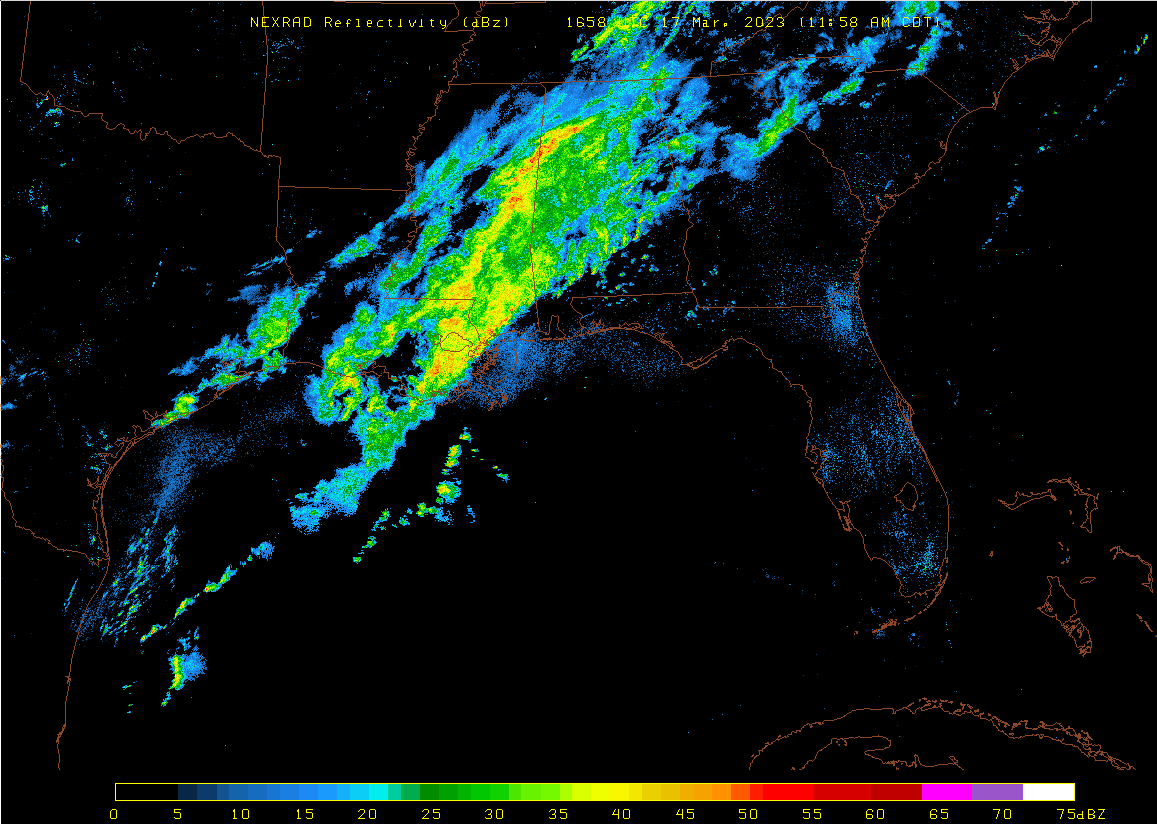
Radar observations from 1658 UTC (from this site) are shown below. There are similarities between the forecast above and reality below. Convection hasn’t reached Mobile; an area of lingering showers persists over southeast Texas. The leading edge of the storms is over greater New Orleans in southeastern Louisiana.
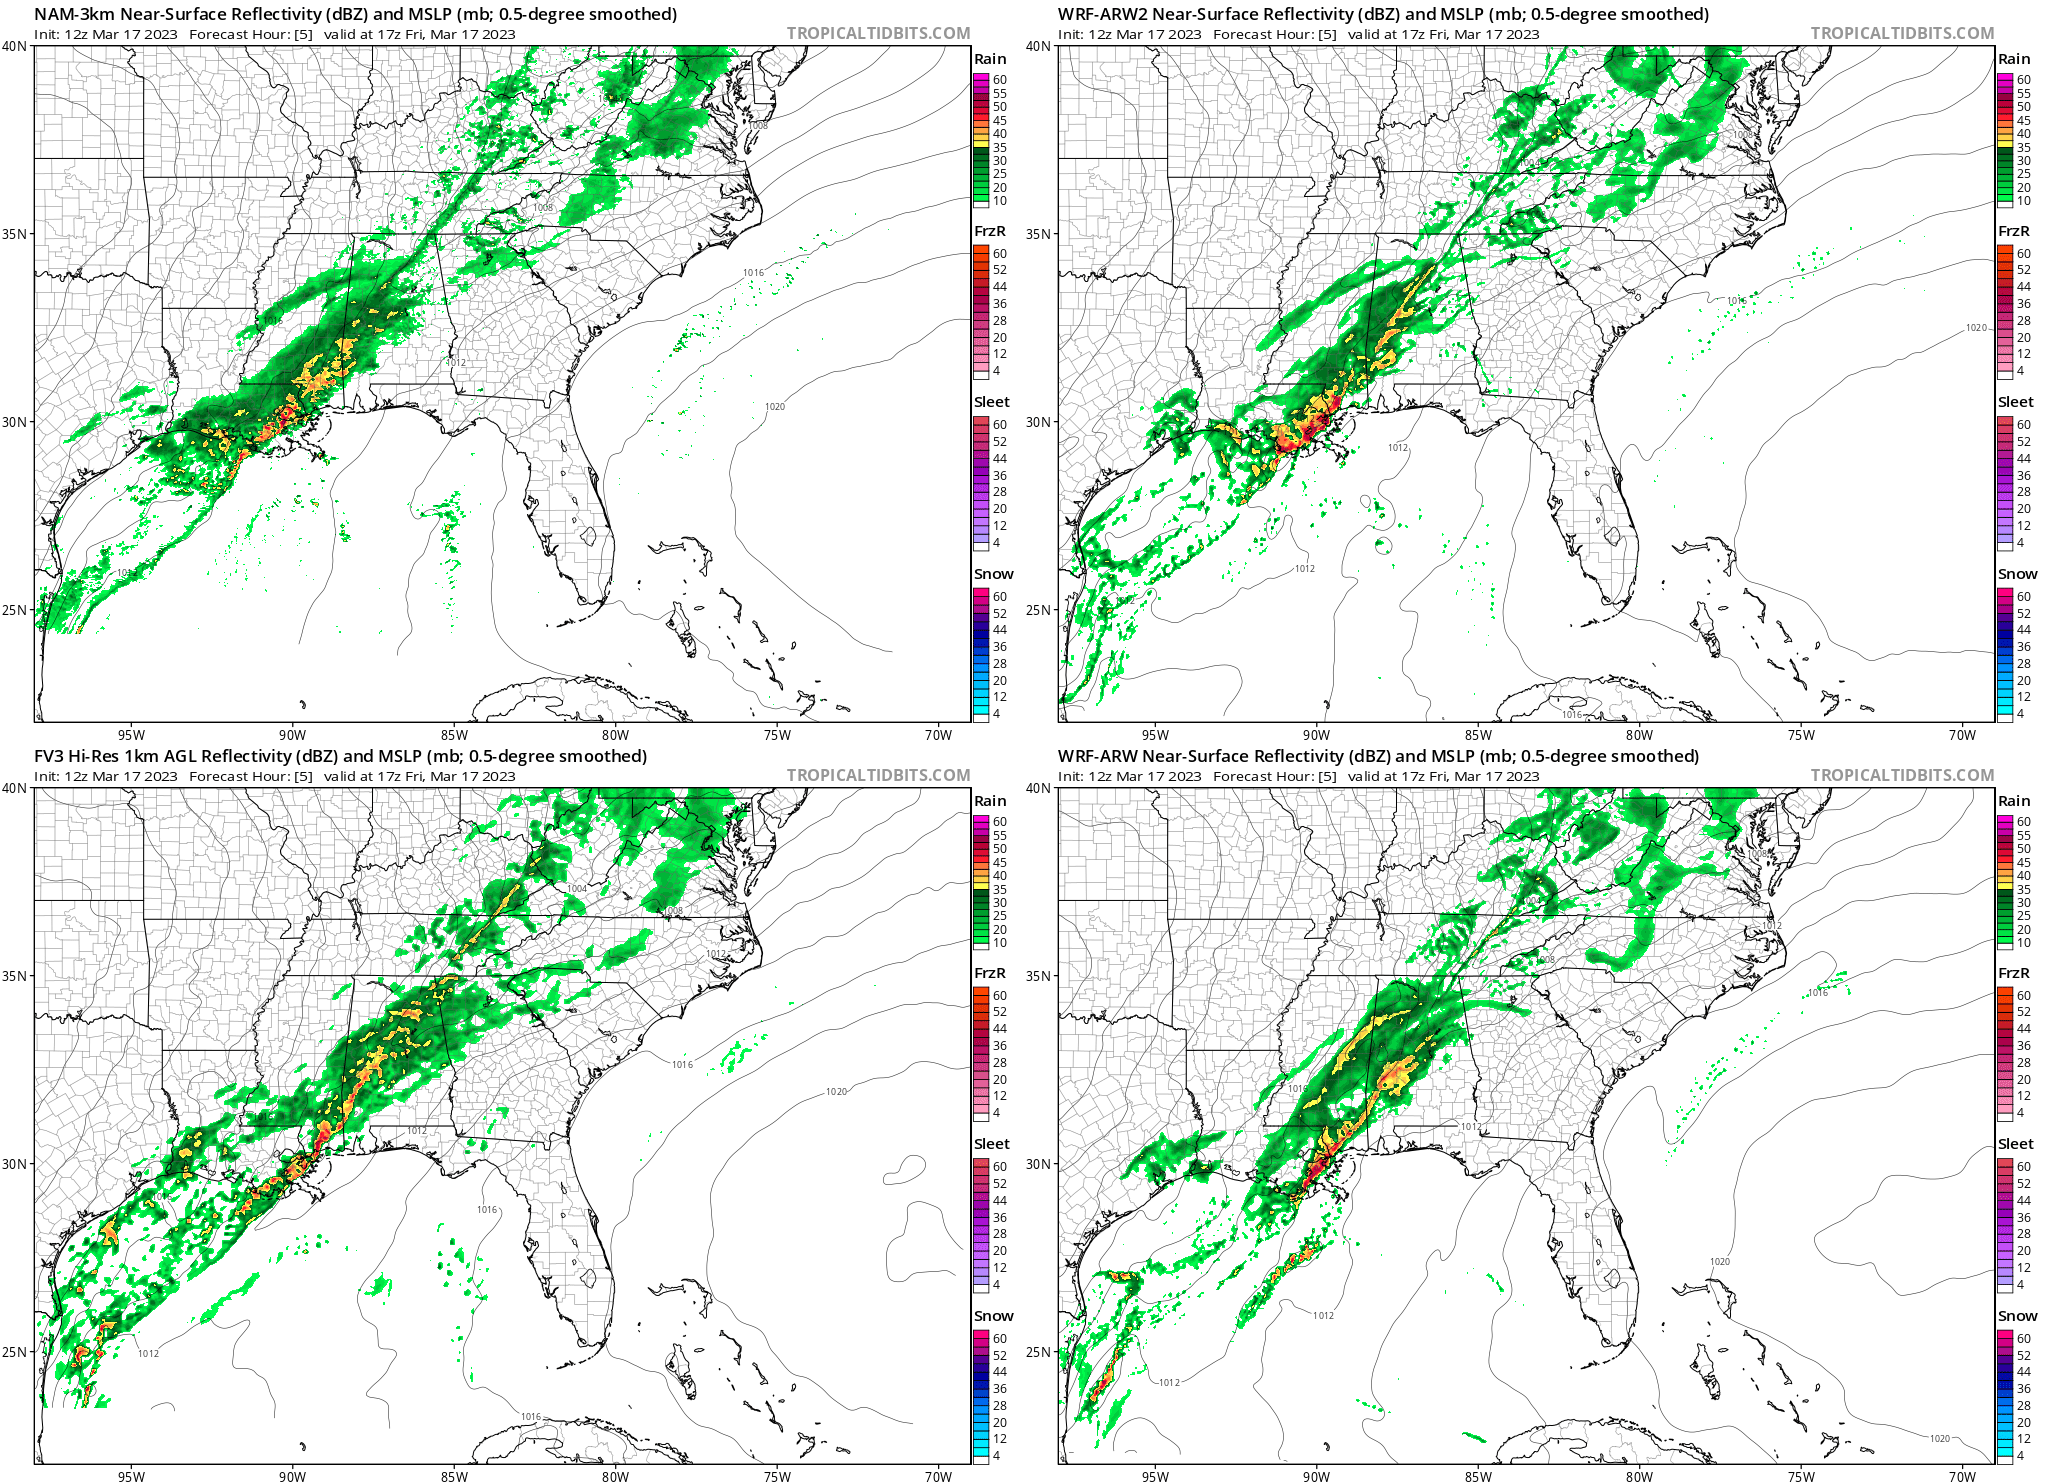
How did other convective-allowing models do with this event? The 4-panel below shows four different forecasts intialized, as above, at 1200 UTC and valid at 1700 UTC, 5 hours later (Imagery taken from the excellent TropicalTidbits website)
View only this post Read Less


